
Chapter Overview
Course Progression
This chapter reinforces Progressive Labs PL-00 and PL-09, emphasizing validation, maintenance, troubleshooting, and evidence-based platform operations. Chapter Exercises are focused practice; Progressive Labs are cumulative investigations. See Course Progression and Progressive Lab Alignment in the front matter.
Field Guide: Wazuh Dashboard Session Timeout Configuration — configure sessions for sustained lab work.
Field Guide: Safe Lab Telemetry Cleanup — preserve evidence before clearing lab telemetry.
Chapters 3 through 8 taught you to build a Security Operations Center laboratory and to work inside it. You installed the components, configured collection, wrote detections, investigated alerts, and hunted for what never alerted. Those are the skills that get you hired. This chapter covers the skills that keep you employed.
A monitoring platform is not a project that finishes. It is a system that must continue working while disks fill, software changes, new log sources appear, and the people who configured it move on. The failures in this chapter are quieter than an attack, and in some ways more dangerous, because a platform that has stopped collecting looks exactly like an environment where nothing is happening.
Figure 9-1
Building Versus Operating
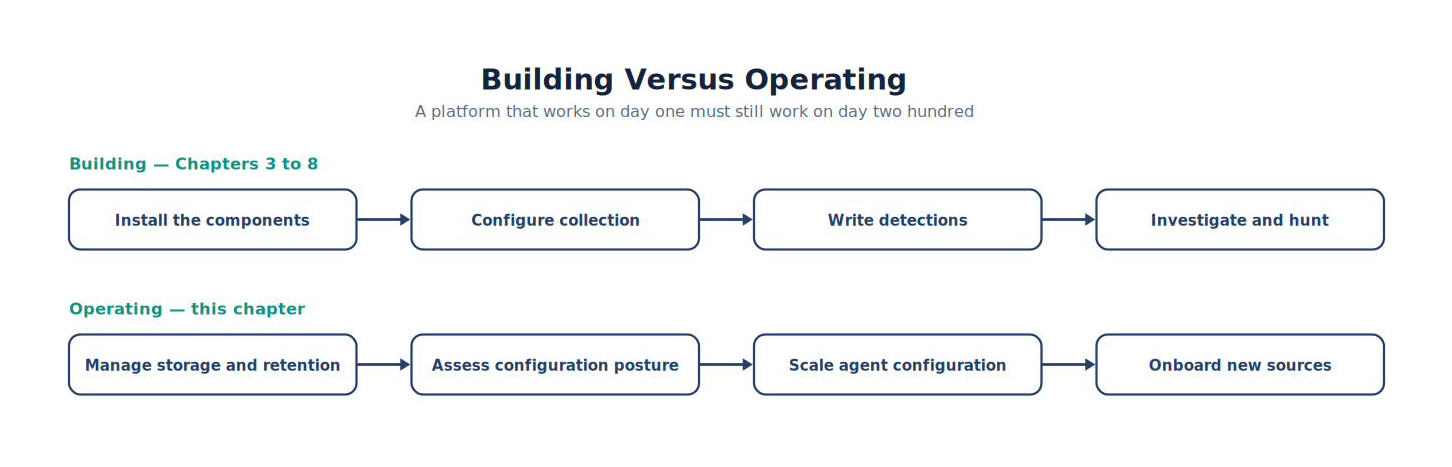
Note. The comparison highlights the operational differences represented by building Versus Operating and shows why the distinction matters during analysis.
Everything in this chapter answers one question: how do you know the platform is still telling you the truth?
Learning Objectives
After completing this chapter, you should be able to:
- Explain how the Wazuh Indexer stores data and why retention must be managed deliberately.
- Describe the failure mode produced by disk exhaustion and how to detect it before it hides an incident.
- Configure and interpret Security Configuration Assessment (SCA) results.
- Explain how vulnerability detection complements event detection.
- Use the Wazuh API to retrieve agent status and inventory.
- Apply agent groups and centralized configuration to manage many endpoints.
- Follow a repeatable method for onboarding a new log source.
- Verify sensor capture health using Suricata statistics.
- Describe why detections belong in version control.
9.1 The Indexer, Retention, and Capacity
Every alert you have investigated in this course was stored by the Wazuh Indexer. Storage is not free, and it is not infinite. Understanding how data ages is an operational requirement, not an optimization.
Log management spans generation, transmission, storage, access, retention, and disposal (Kent & Souppaya, 2006). Within the Indexer, recent data is actively written; older data remains searchable, may move to slower storage, and is eventually deleted according to approved retention and disposal policy.
Figure 9-2
Index Lifecycle
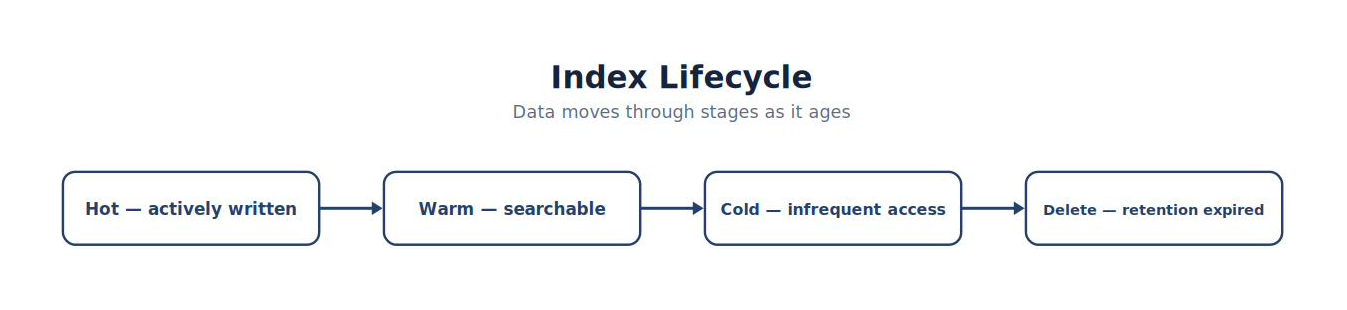
Note. The workflow presents the ordered stages of the index lifecycle and highlights the controls that make retention and disposal repeatable.
Kent and Souppaya (2006) address this directly in their guidance on log management: organizations must define how long log data is retained, balancing investigative usefulness against storage cost and policy obligation. That decision belongs to the organization, and it must be written down.
Why this matters more than it sounds
Consider what happens when nobody manages retention.
Figure 9-3
Silent Failure — Disk Exhaustion
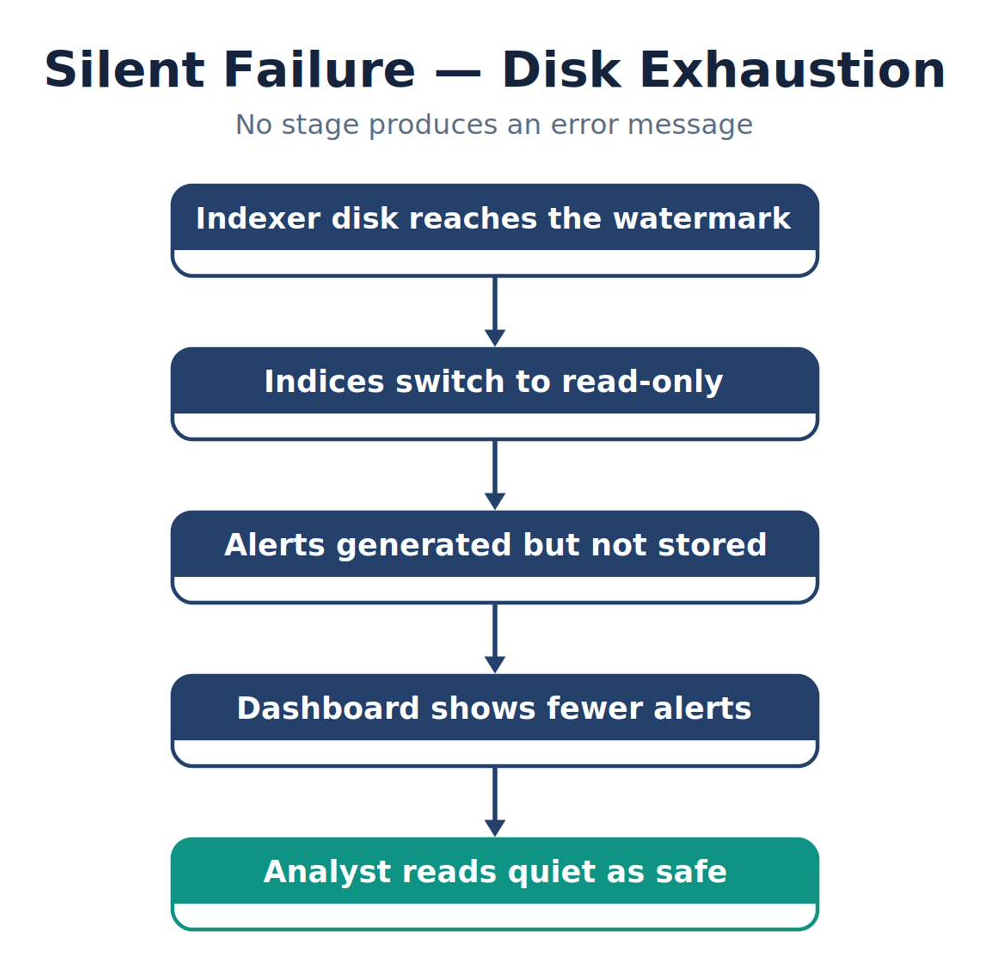
Note. The figure summarizes silent Failure — Disk Exhaustion and highlights the relationships among its principal elements, evidence sources, and analytical outcomes.
Storage fills. The Indexer protects itself by making indices read-only. Alerts continue to be generated by the Manager, but they are no longer stored. The Dashboard displays fewer alerts than yesterday. No component reports an error to the analyst. The alert queue simply gets quieter.
This is the exact ambiguity introduced in Chapter 1: an empty dashboard and a broken pipeline look identical. The difference is that this failure arrives gradually, and it arrives during normal operation rather than during setup, which is when nobody is looking for it. Why this matters: A SOC that has silently stopped storing alerts has become a very expensive way of feeling safe.
Setting a retention period
Retention is a policy decision informed by three questions.
Figure 9-4
Retention Decision
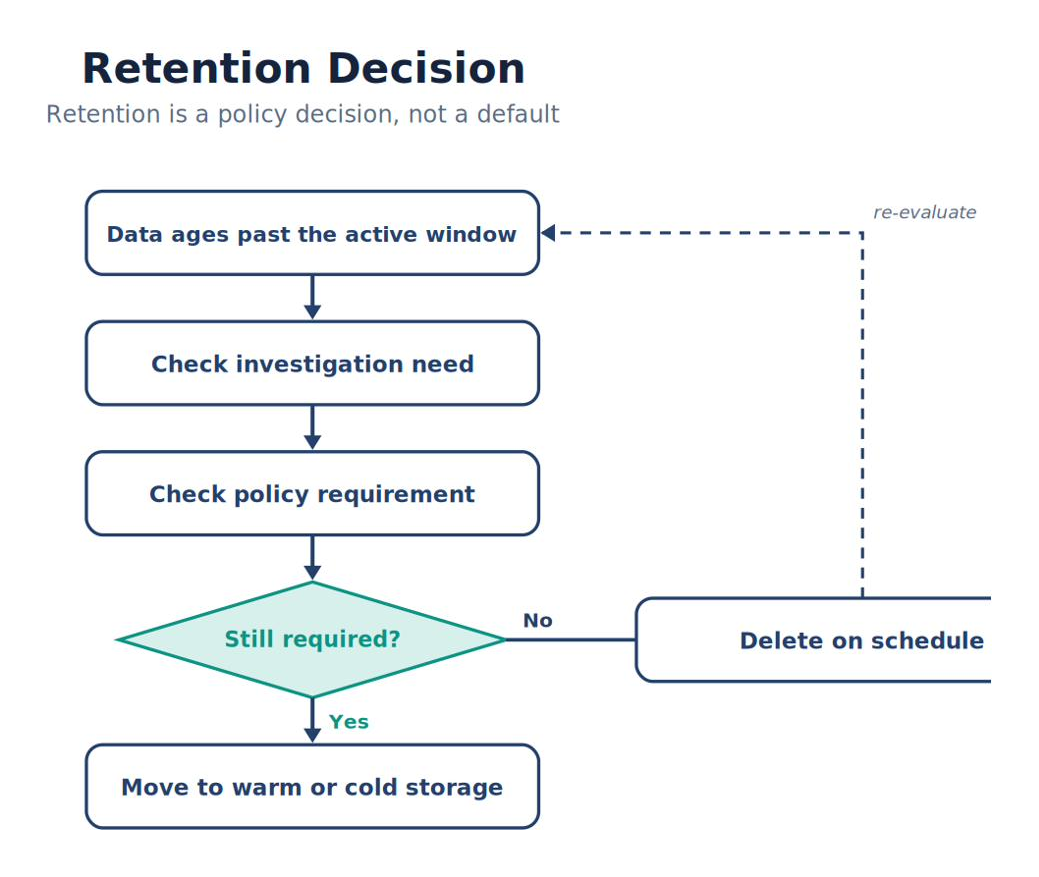
Note. The figure summarizes retention Decision and highlights the relationships among its principal elements, evidence sources, and analytical outcomes.
First, how far back does an investigation realistically need to reach? Attacks are frequently discovered weeks after initial compromise. Retention shorter than your realistic detection delay means the evidence is gone before you know to look. Second, does policy or regulation require a minimum period? Many frameworks specify retention explicitly, and that requirement is a floor rather than a target. Third, what can the available storage sustain at the observed rate of growth? This requires measuring, not estimating.
Practical monitoring
Three habits prevent the failure in Figure 9-3.
- Monitor Indexer disk usage as a routine health check, alongside agent status.
- Track index growth over time so capacity planning is based on measurement.
- Test that deletion actually occurs. A retention policy that was configured but never verified is an assumption.
9.2 Security Configuration Assessment
Everything to this point has been about events — things that happened. Security Configuration Assessment asks a different question: is this system configured correctly in the first place?
Figure 9-5
Security Configuration Assessment
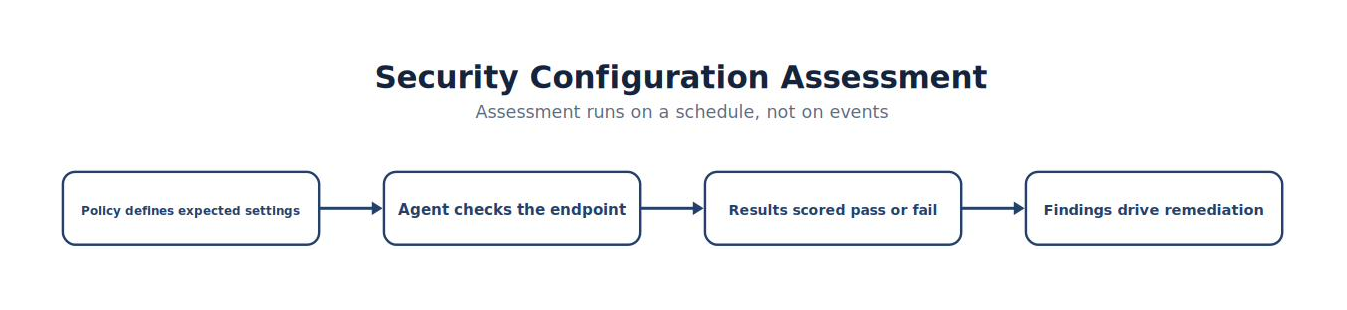
Note. The figure summarizes security Configuration Assessment and highlights the relationships among its principal elements, evidence sources, and analytical outcomes.
A policy defines the settings a system is expected to have. The agent evaluates the endpoint against that policy on a schedule. Each check is scored as a pass or a fail, and failures become findings that drive remediation (Wazuh, Inc., n.d.-a).
Detection and assessment answer different questions
Figure 9-6
Two Different Questions
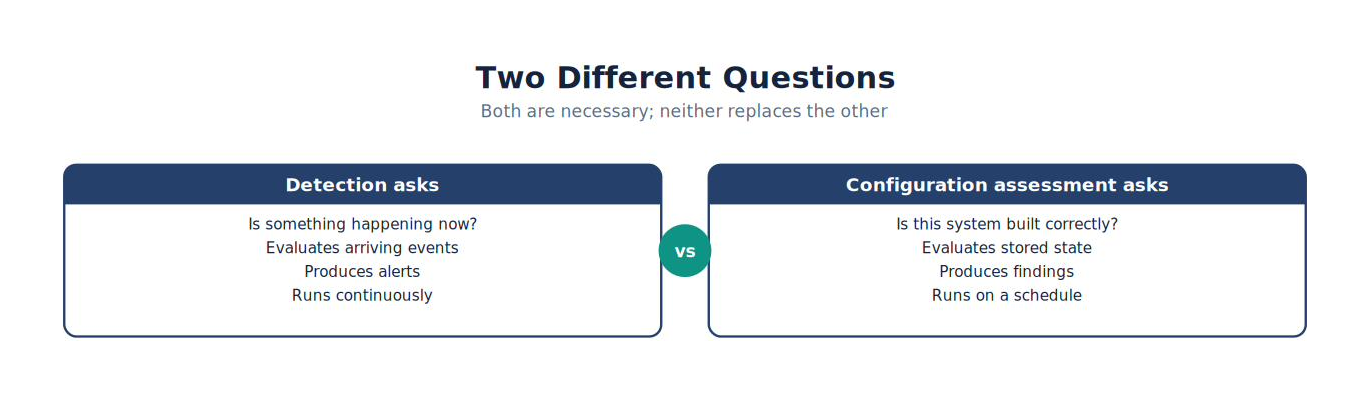
Note. The figure summarizes two Different Questions and highlights the relationships among its principal elements, evidence sources, and analytical outcomes.
Detection is continuous and reactive: it evaluates events as they arrive and produces alerts. Assessment is scheduled and proactive: it evaluates stored configuration state and produces findings.
Neither replaces the other. A detection rule can tell you that someone disabled a security control. An assessment tells you the control was never enabled on forty other machines. Joint Task Force (2020) frames this distinction in terms of security controls: controls must be both implemented and assessed. Detection observes behavior; assessment verifies implementation. Why this matters: Most successful intrusions exploit configuration weaknesses that were present long before the attack. Finding them is cheaper than detecting their exploitation.
9.3 Vulnerability Detection
Configuration assessment asks whether settings are correct. Vulnerability detection asks whether the installed software is exposed to known defects.
Figure 9-7
Vulnerability Detection
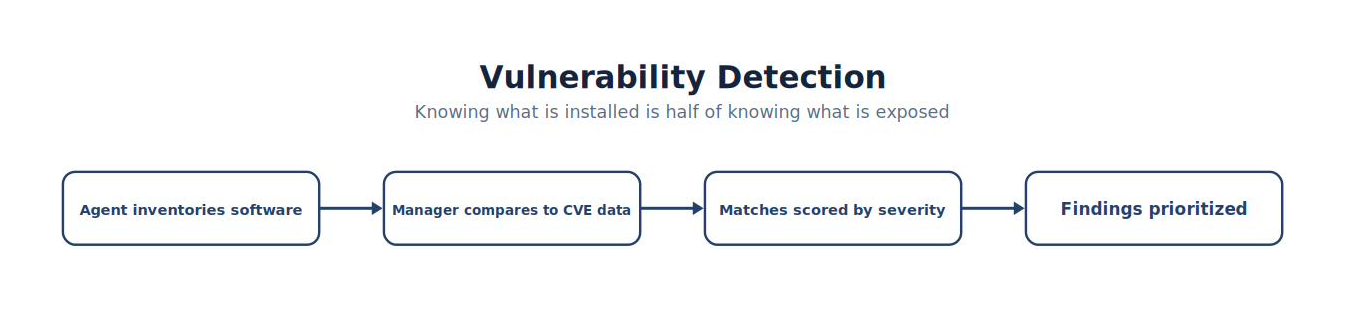
Note. The figure summarizes vulnerability Detection and highlights the relationships among its principal elements, evidence sources, and analytical outcomes.
The agent inventories installed software and versions. The Manager compares that inventory against published vulnerability data. Matches are scored by severity, and findings are prioritized for patching (Wazuh, Inc., n.d.-a). Two cautions belong with this capability.
A vulnerability finding is not an incident. It describes exposure, not compromise. Treating every high-severity finding as an emergency exhausts the same analyst attention that detection depends on.
Conversely, an unpatched vulnerability on an internet-facing service is frequently how an incident begins. The value of this data is in prioritization: which exposures matter most, given where the system sits and what it holds.
9.4 The Wazuh API
Every action available in the Dashboard is also available programmatically. The Dashboard is a client of the API, not a separate system.
Figure 9-8
Wazuh API Request Flow
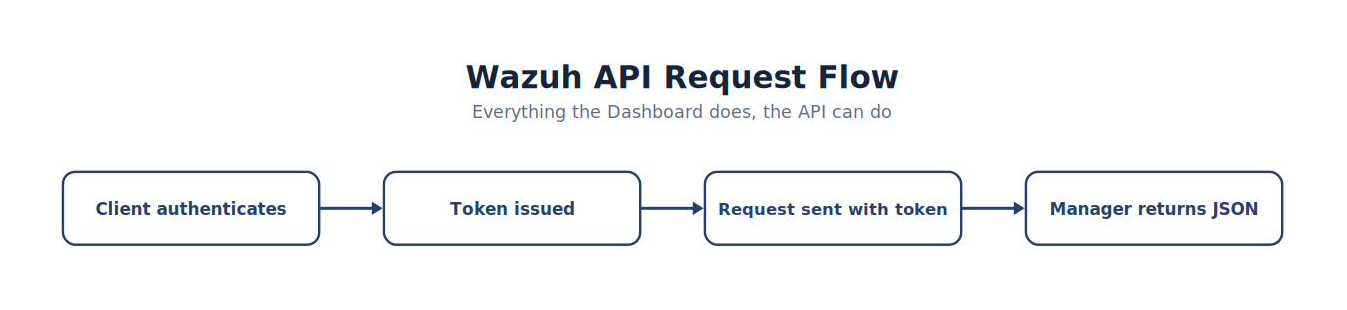
Note. The pipeline shows how information moves through wazuh API Request Flow, from its source through processing to the analyst-visible result.
A client authenticates and receives a token. Subsequent requests carry that token, and the Manager responds with structured JSON (Wazuh, Inc., n.d.-a).
Figure 9-9
What the API Enables
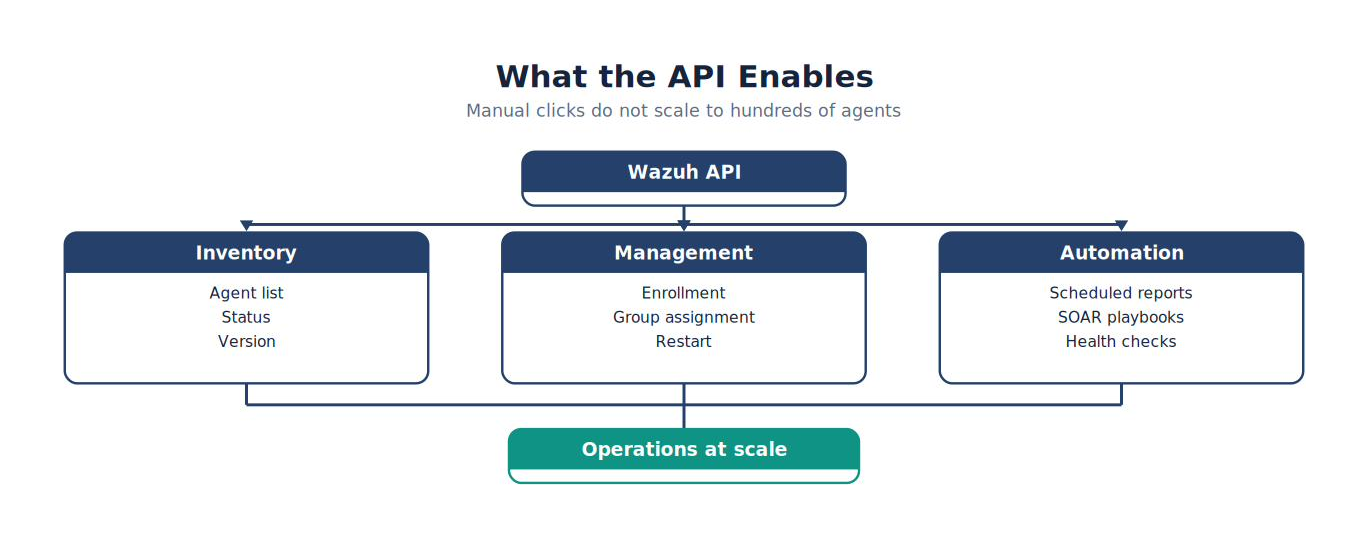
Note. The figure summarizes what the API Enables and highlights the relationships among its principal elements, evidence sources, and analytical outcomes.
Three categories of work become possible. Inventory. Retrieve agent lists, connection status, and versions without clicking through a console. When you manage four agents this is convenient. When you manage four hundred it is the only realistic approach. Management. Enroll agents, assign groups, and restart services from a script.
Automation. This is the connection to Chapter 8. Security Orchestration, Automation, and Response depends on tools exposing programmatic interfaces (Gartner, n.d.-a). The API is what makes a Wazuh playbook step possible at all. Why this matters: Automation is not an abstract future capability. It is an API call you can make today.
9.5 Agent Groups and Centralized Configuration
In this laboratory you configured two agents by editing files on each machine. That approach does not survive contact with a real environment.
Figure 9-10
Centralized Configuration with Agent Groups
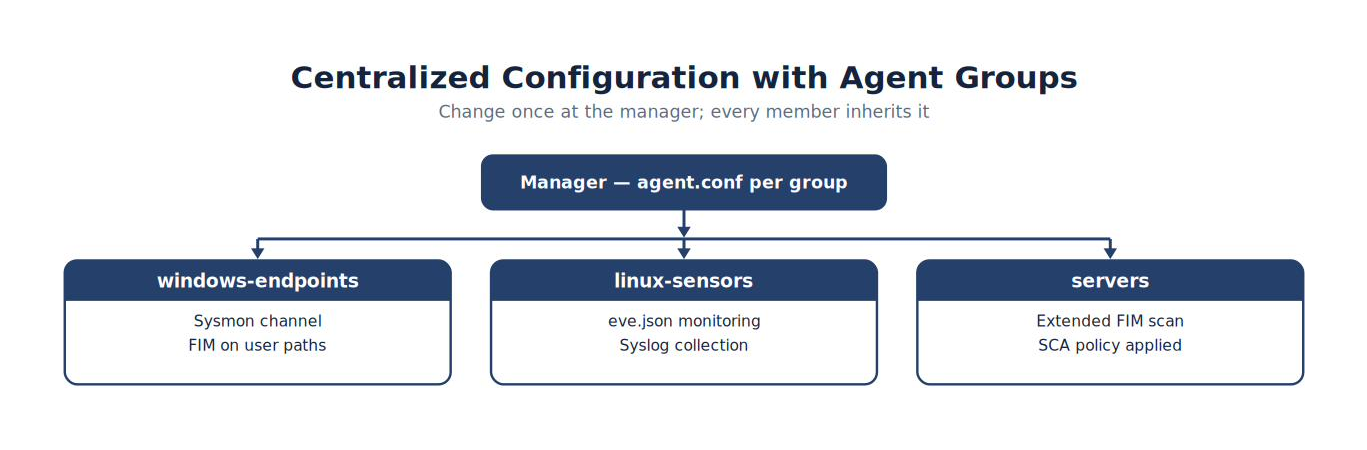
Note. The figure summarizes centralized Configuration with Agent Groups and highlights the relationships among its principal elements, evidence sources, and analytical outcomes.
Agents are assigned to groups. Each group has a configuration maintained centrally on the Manager, which member agents receive automatically (Wazuh, Inc., n.d.-a). The operational consequences are significant.
A change is made once and applied everywhere in the group. Configuration is consistent by construction rather than by discipline. A rebuilt endpoint inherits the correct configuration when it rejoins its group, rather than depending on someone remembering which files to edit. Grouping usually follows role: Windows endpoints, Linux sensors, servers. Systems with the same job need the same telemetry.
Why this matters: Configuration drift — where machines that should be identical quietly differ — is a leading cause of blind spots. One unmonitored server is invisible in exactly the way an attacker prefers.
9.6 Onboarding a New Log Source
Adding a new source of telemetry is among the most common tasks in professional security operations. In this course you have configured several sources individually. This section generalizes those experiences into a method you can apply to any source.
Figure 9-11
Onboarding a New Log Source
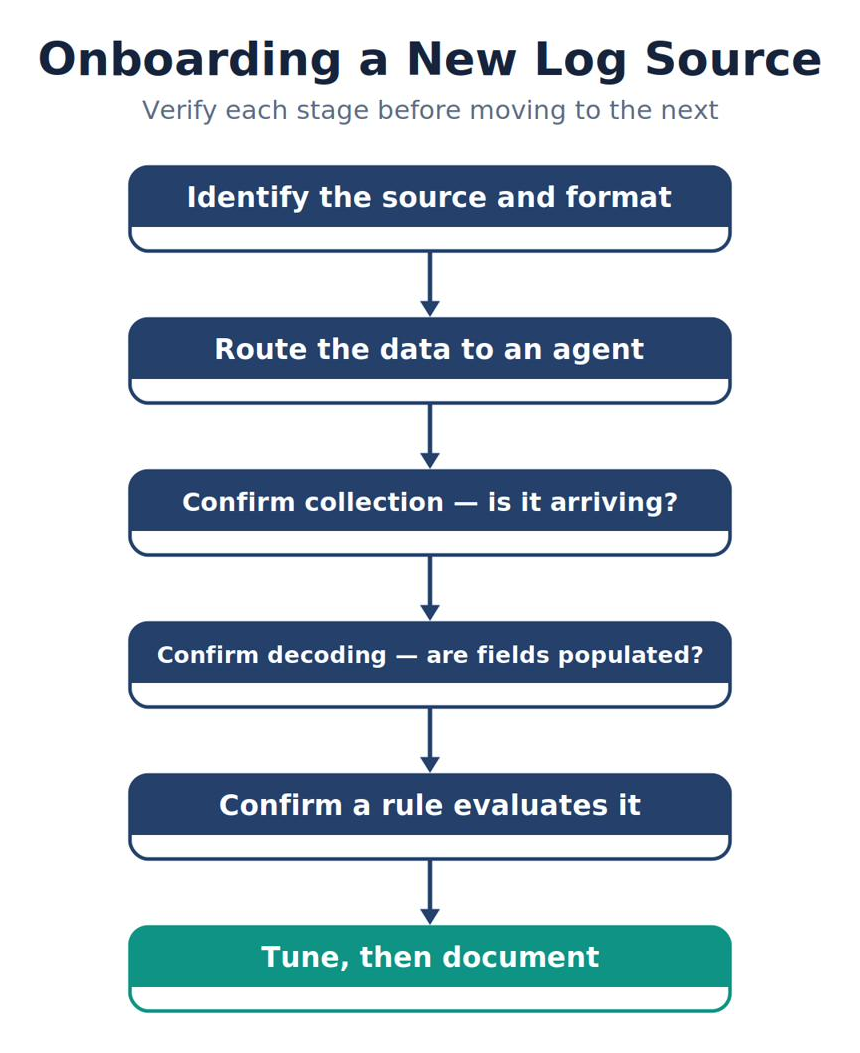
Note. The figure summarizes onboarding a New Log Source and highlights the relationships among its principal elements, evidence sources, and analytical outcomes.
Identify the source and its format. What system produces this data, in what format, and where does it write it?
Route the data to an agent. The agent must be able to read the data — a file it has permission to open, or a channel it is configured to monitor. Confirm collection. Is the data arriving at the Manager? This is a distinct question from whether it is useful yet.
Confirm decoding. Are fields being populated? Recall from Chapter 5 that rules evaluate fields, not raw text. A log that arrives but does not decode produces empty fields and matches nothing. Confirm a rule evaluates it. Does anything act on the decoded data? Collection without evaluation is storage. Tune, then document. Adjust for noise, then record what was configured and why.
Diagnosing failures
Each stage fails differently, and the symptoms overlap enough to be confusing.
Figure 9-12
Where Onboarding Fails
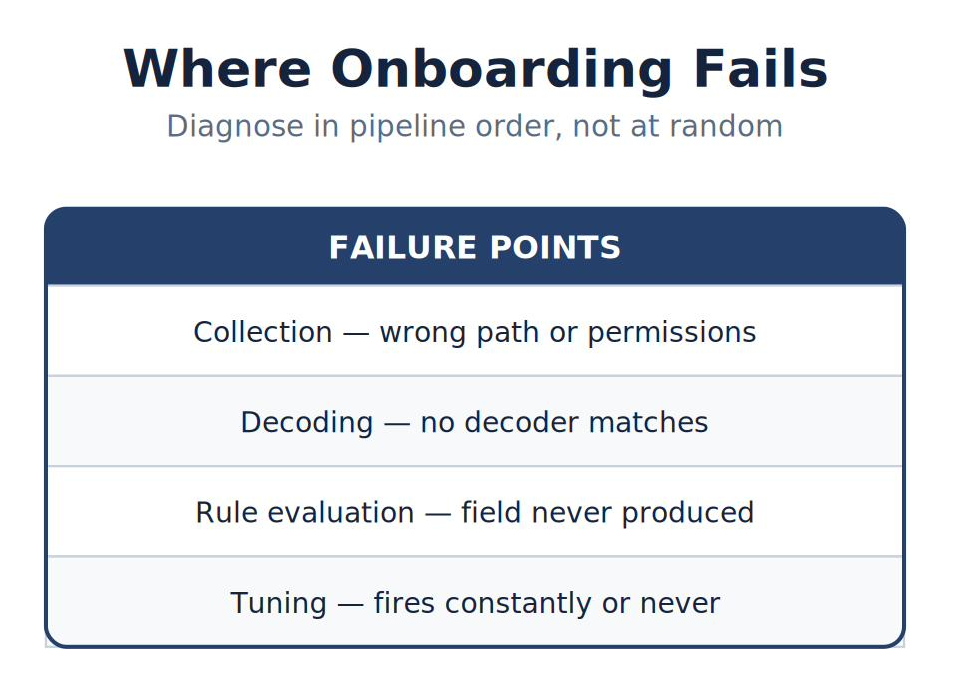
Note. The figure summarizes where Onboarding Fails and highlights the relationships among its principal elements, evidence sources, and analytical outcomes.
The discipline is the same one introduced in Chapter 2: diagnose in pipeline order. Confirm collection before investigating decoding; confirm decoding before investigating rules. Testing stages at random produces confusion rather than answers. Why this matters: This method transfers. The specific commands change between platforms; the sequence does not.
9.7 Sensor Health and Capture Integrity
A network sensor can be running perfectly, with current rules and a healthy service, and still be blind.
Figure 9-13
Capture Health Check
Note. The figure summarizes capture Health Check and highlights the relationships among its principal elements, evidence sources, and analytical outcomes.
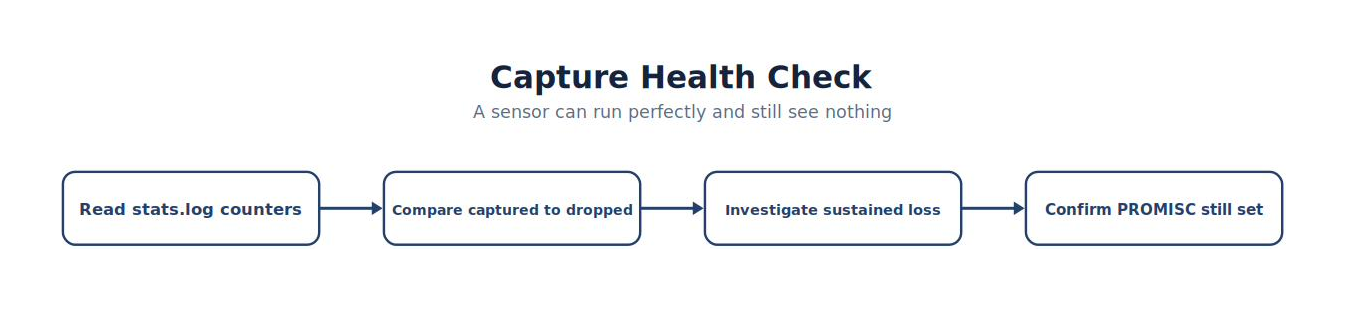
Suricata records statistics about its own operation, including how many packets it captured and how many it dropped before inspection (Open Information Security Foundation, n.d.). Packets that were dropped were never evaluated against any rule.
Figure 9-14
Packet Loss Produces Silent Blindness
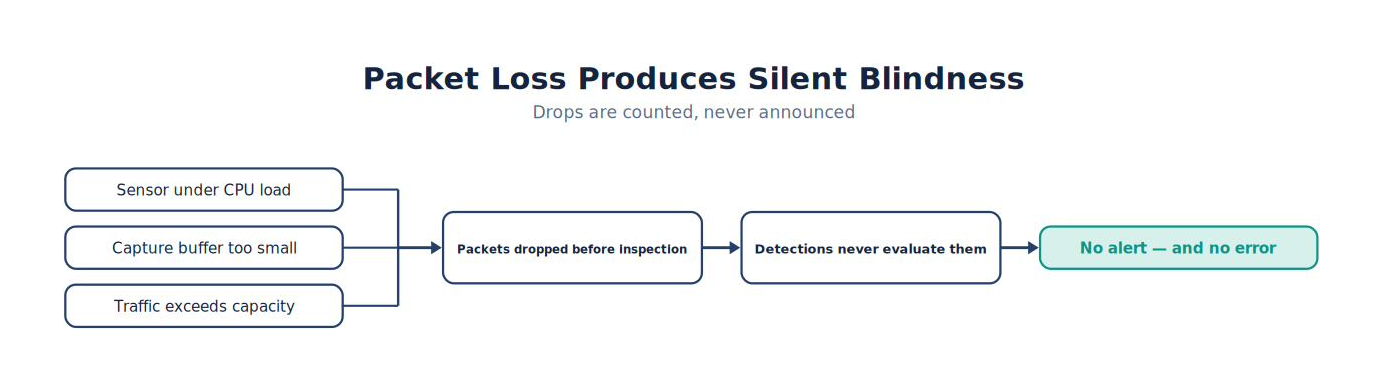
Note. The figure summarizes packet Loss Produces Silent Blindness and highlights the relationships among its principal elements, evidence sources, and analytical outcomes.
Loss occurs when the sensor cannot keep pace — insufficient processing capacity, undersized capture buffers, or traffic beyond the sensor's throughput. The result is that some fraction of traffic is never inspected, and no alert is generated because no evaluation occurred.
Sustained packet loss deserves the same attention as a stopped service. Add two checks to routine sensor verification: confirm the capture interface still carries the promiscuous flag, and confirm the drop counters are not climbing.
Why this matters: A sensor reporting zero alerts may be observing a quiet network, or may be discarding a quarter of it. Only the counters distinguish the two.
9.8 Detection as Code
Detection rules are software. They are written, reviewed, deployed, and maintained, and they break when the environment changes around them.
Figure 9-15
Detection as Code
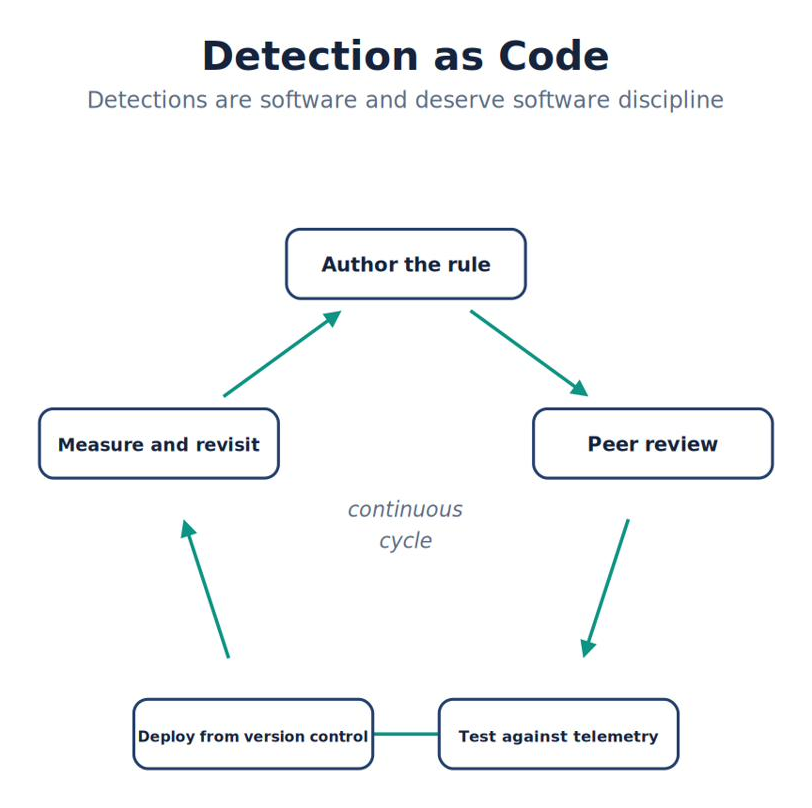
Note. The figure summarizes detection as Code and highlights the relationships among its principal elements, evidence sources, and analytical outcomes.
Mature detection teams apply software practices to detection content. Rules are stored in version control, so every change has an author, a date, and a reason. Changes are peer-reviewed before deployment, because a rule that floods the queue affects everyone. Rules are tested against real telemetry before they are trusted. Deployment is from the repository, so the running configuration matches what was reviewed. And coverage is measured and revisited, because detections decay (Knerler et al., 2022). The alternative is a rule set that nobody fully understands, containing suppressions added years ago for reasons no one recorded.
9.9 The Operational Cadence
Operations is a rhythm rather than a project. The tasks in this chapter belong at defined intervals.
Figure 9-16
Operational Cadence
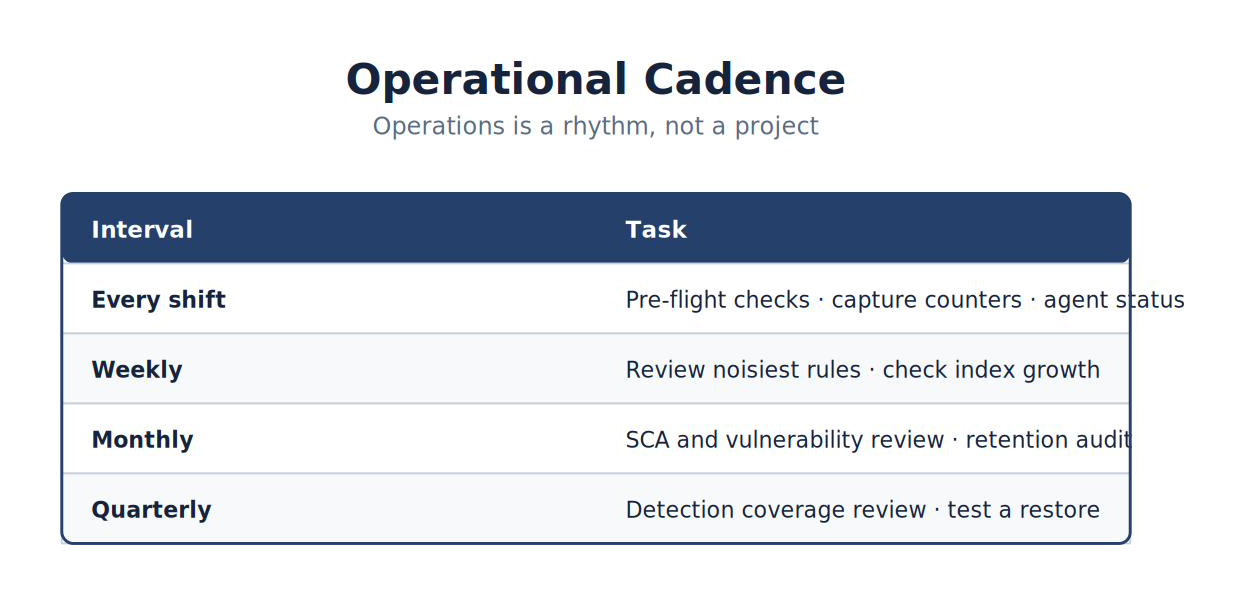
Note. The workflow presents the ordered stages of operational Cadence and highlights the validation and feedback steps that make the process repeatable.
Every shift begins with pre-flight checks, capture counters, and agent status. Scheduled reviews should cover noisy rules, index growth, configuration findings, retention, detection coverage, and tested restoration. Reassess controls sooner when architecture, mission, threats, software, or regulatory obligations change. Operational assurance depends on measured checks and verified recovery—not cadence alone (Bartock et al., 2016; Kent & Souppaya, 2006).
9.10 Chapter Summary
Building a monitoring platform and operating one are different disciplines. This chapter covered the second. The Wazuh Indexer stores every alert you investigate, and that storage must be managed deliberately. Retention is a policy decision balancing investigative need, regulatory obligation, and capacity (Kent & Souppaya, 2006). Unmanaged, storage exhaustion produces a silent failure in which alerts are generated but never stored, and the analyst sees only a quieter dashboard.
Security Configuration Assessment answers a different question than detection. Detection asks whether something is happening; assessment asks whether the system was built correctly. Vulnerability detection extends this to installed software, describing exposure rather than compromise.
The Wazuh API exposes programmatically everything the Dashboard does, making inventory, management, and automation possible at scale. Agent groups apply the same principle to configuration: define once centrally, inherit everywhere, and eliminate the configuration drift that produces blind spots.
Onboarding a new log source follows a repeatable sequence — identify, route, confirm collection, confirm decoding, confirm evaluation, tune, and document — and failures are diagnosed in that same order.
A network sensor can run perfectly and still be blind. Packet loss is counted but never announced, which makes capture statistics a required health check rather than an optional one. Finally, detection content is software and benefits from software practice: version control, peer review, testing, and measurement (Knerler et al., 2022).
The question underneath all of it is the one this book began with. An empty dashboard is not evidence of a quiet environment. It is a claim that requires verification.
Knowledge Check
Select the best answer for each question.
1. The Indexer disk reaches its watermark. What does an analyst most likely observe?
A. A prominent error banner in the Dashboard
B. Fewer alerts than usual, with no error message
C. All agents disconnecting simultaneously
D. Suricata stopping automatically
2. Security Configuration Assessment primarily answers which question?
A. Is something happening on this system right now?
B. Which packets crossed the network?
C. Is this system configured according to policy?
D. Which process created this file?
3. A vulnerability finding indicates:
A. A confirmed compromise
B. Exposure to a known software defect
C. That an alert rule matched
D. That an agent has disconnected
4. What is the primary operational benefit of agent groups?
A. They increase the speed of packet capture
B. They allow configuration to be defined once and inherited by every member
C. They replace the need for decoders
D. They encrypt agent communication
5. When onboarding a new log source, in what order should failures be diagnosed?
A. Rules, then decoding, then collection
B. Collection, then decoding, then rule evaluation
C. Tuning, then collection, then rules
D. Any order, since the stages are independent
6. Suricata reports a rising number of dropped packets. What does this mean?
A. The rules are working correctly
B. Traffic was discarded before inspection and was never evaluated
C. The agent has disconnected
D. Retention has expired
7. Why are detection rules kept in version control?
A. To reduce disk usage on the Manager
B. To provide authorship, history, and review for every change
C. Because Wazuh requires it
D. To increase alert severity
8. Which task belongs to the "every shift" cadence?
A. Quarterly detection coverage review
B. Retention audit
C. Pre-flight checks, capture counters, and agent status
D. Annual policy revision
9. An analyst observes zero Suricata alerts for a full day. What is the correct conclusion?
A. The network is confirmed clean
B. Suricata should be uninstalled
C. Nothing can be concluded until capture counters and interface state are verified
D. All rules should be set to a higher severity
10. What distinguishes operating a platform from building one?
A. Operating requires no configuration
B. Operating maintains correctness over time as conditions change
C. Building is performed by analysts and operating by vendors
D. There is no meaningful difference
Discussion Questions
Your organization requires ninety days of log retention, but current storage supports only forty-five days at the present rate of growth. Describe three possible responses and the trade-off each involves.
A configuration assessment reports that a security setting is disabled on sixty machines. Detection has never alerted on this. Explain why both facts can be true simultaneously, and what each tells you.
Automating agent enrollment through the API reduces manual effort but introduces a new risk. Identify that risk and propose a control.
A colleague proposes suppressing a noisy rule to reduce alert volume. Using the material in this chapter and Chapter 5, describe what should be recorded before the suppression is applied.