

Chapter Overview
Course Progression
This chapter supports Progressive Labs PL-00 and PL-09, which establish a known-good platform, validate telemetry, and develop systematic diagnostic skills. Chapter Exercises are embedded practice; Progressive Labs are cumulative investigations. See Course Progression and Progressive Lab Alignment in the front matter.
Field Guide: Wazuh Lab Platform Operations Quick Reference — start, stop, and verify the lab platform.
Field Guide: Wazuh Dashboard Authorization-Token Troubleshooting — resolve dashboard token failures.
Field Guide: Install, Validate, and Integrate Osquery on Ubuntu 26.04 — add Ubuntu osquery telemetry to Wazuh.
Cybersecurity professionals rarely investigate attacks on production systems while learning new technologies. Instead, they build controlled laboratory environments where they can safely generate attacks, validate detections, troubleshoot problems, and improve investigative skills without affecting organizational operations. Throughout the remainder of this textbook, you will build and operate your own Security Operations Center using enterprise security software.
Unlike many instructional books that rely upon screenshots of preconfigured environments, every alert, dashboard, detection, and investigation described in this textbook will originate from your own laboratory. You will generate the telemetry. You will validate the detections. You will troubleshoot failures. You will investigate the alerts.
By the end of this book, your laboratory will resemble a small enterprise SOC capable of monitoring Windows endpoints, Linux systems, and network traffic using Wazuh, Sysmon, Suricata, and Emerging Threats Open. More importantly, you will understand why every component exists and how each contributes to the overall security monitoring pipeline.
Learning Objectives
After completing this chapter, you should be able to:
Explain the purpose of a cybersecurity laboratory.
Describe the complete architecture of the Wazuh SOC laboratory.
Identify the role of every virtual machine.
Explain the telemetry flow between systems.
Configure a repeatable VMware networking environment.
Validate communication between laboratory systems.
Troubleshoot common laboratory problems before they affect investigations.
Introduction
One of the defining characteristics of successful cybersecurity professionals is that they build reliable laboratories. A poorly designed lab creates frustration. A well-designed lab accelerates learning. Students often believe cybersecurity laboratories exist simply to provide systems to attack. Professional analysts understand something much more important. A laboratory is an environment where hypotheses can be tested repeatedly under controlled conditions. Consider a chemist. A chemist does not perform experiments inside a manufacturing plant. Instead, experiments occur inside a laboratory where variables can be controlled. Cybersecurity laboratories serve exactly the same purpose.
Why Build Your Own SOC?
Public cloud laboratories and demonstrations are useful, but learning is strongest when you control the environment. Throughout this textbook, you will modify detection rules; Wazuh Agent, Sysmon, and Suricata configurations; ET Open signatures; Dashboard searches; decoders; Active Response; File Integrity Monitoring; and Vulnerability Detection. These activities require administrative access, while your own laboratory provides complete visibility into every component.
Laboratory Design Goals
The laboratory balances four design goals: simplicity, so students understand every component; repeatability, so each build supports consistent troubleshooting; realism, so the architecture resembles an enterprise deployment; and expandability, so students can add Windows systems, Kali Linux, Active Directory, web servers, vulnerability scanners, Zeek, pfSense, Docker workloads, or cloud telemetry without redesigning the core laboratory.
Analyst Tradecraft Tip
If you build it, document it.
Precise records turn future failures into solvable problems.
Laboratory Components
Our environment consists of five primary systems.
| System | Purpose |
|---|---|
| Wazuh Server v4.14.5 on Amazon Linux 2023 | SIEM Platform |
| Ubuntu 26.04 (dual-NIC) | Suricata Network Sensor / Wazuh Agent |
| Windows 11 Pro | Endpoint Monitoring / Wazuh Agent |
| Security Onion 14.04.5.2 (hostname SO14) | Comparative NIDS Platform |
| VMware Workstation | Virtual Infrastructure |
Each machine performs a distinct function. None are redundant.
The Wazuh Server
The Wazuh Server forms the operational center of the SOC.
Responsibilities include:
Receiving telemetry
Running detection rules
Decoding events
Correlation
Dashboard services
Indexing
Agent management
Every investigation eventually reaches the Wazuh Server.
Ubuntu Network Sensor
Ubuntu performs two independent roles.
Endpoint
The Ubuntu machine runs a Wazuh Agent. It behaves like any monitored Linux endpoint.
Network Sensor
The same Ubuntu system runs Suricata. One network interface operates in promiscuous mode, allowing Suricata to inspect packets traversing the monitored network (Open Information Security Foundation, n.d.).
Emerging Threats Open signatures evaluate those packets and generate alerts written to:
/var/log/suricata/eve.json
The Wazuh Agent forwards those alerts to the Wazuh Manager.
Windows 11 Endpoint
The Windows workstation represents a standard enterprise endpoint.
Installed software includes:
Windows 11 Pro
Wazuh Agent
Sysmon
Microsoft Defender
Together these components generate rich endpoint telemetry including:
Process creation
Network connections
DNS queries
File creation
Malware detection
Authentication events
Security Onion
Security Onion is a security monitoring and threat-hunting platform that combines network telemetry, detections, packet analysis, and investigative tools in one environment. In this laboratory, SO14 provides an independent view of the same mirrored traffic observed by Suricata on UB2604, allowing students to compare what two monitoring platforms detect and present (Security Onion Solutions, n.d.).
Students frequently ask:
Which platform is better?
Rather than answering that question philosophically, the laboratory allows students to compare both environments using identical network traffic.
Throughout later chapters students will compare:
Alert generation
Dashboards
Network visibility
Investigation workflow
Detection quality
Ease of administration
Understanding multiple platforms prepares students for diverse enterprise environments.
VMware Workstation
VMware provides the infrastructure supporting the laboratory.
Benefits include:
Snapshots
Cloning
Isolated networking
Repeatability
Easy recovery
Resource management
Professional analysts rely heavily on virtualization because environments can be restored within minutes after mistakes or malware testing.
Figure 3-1
Complete Laboratory Topology
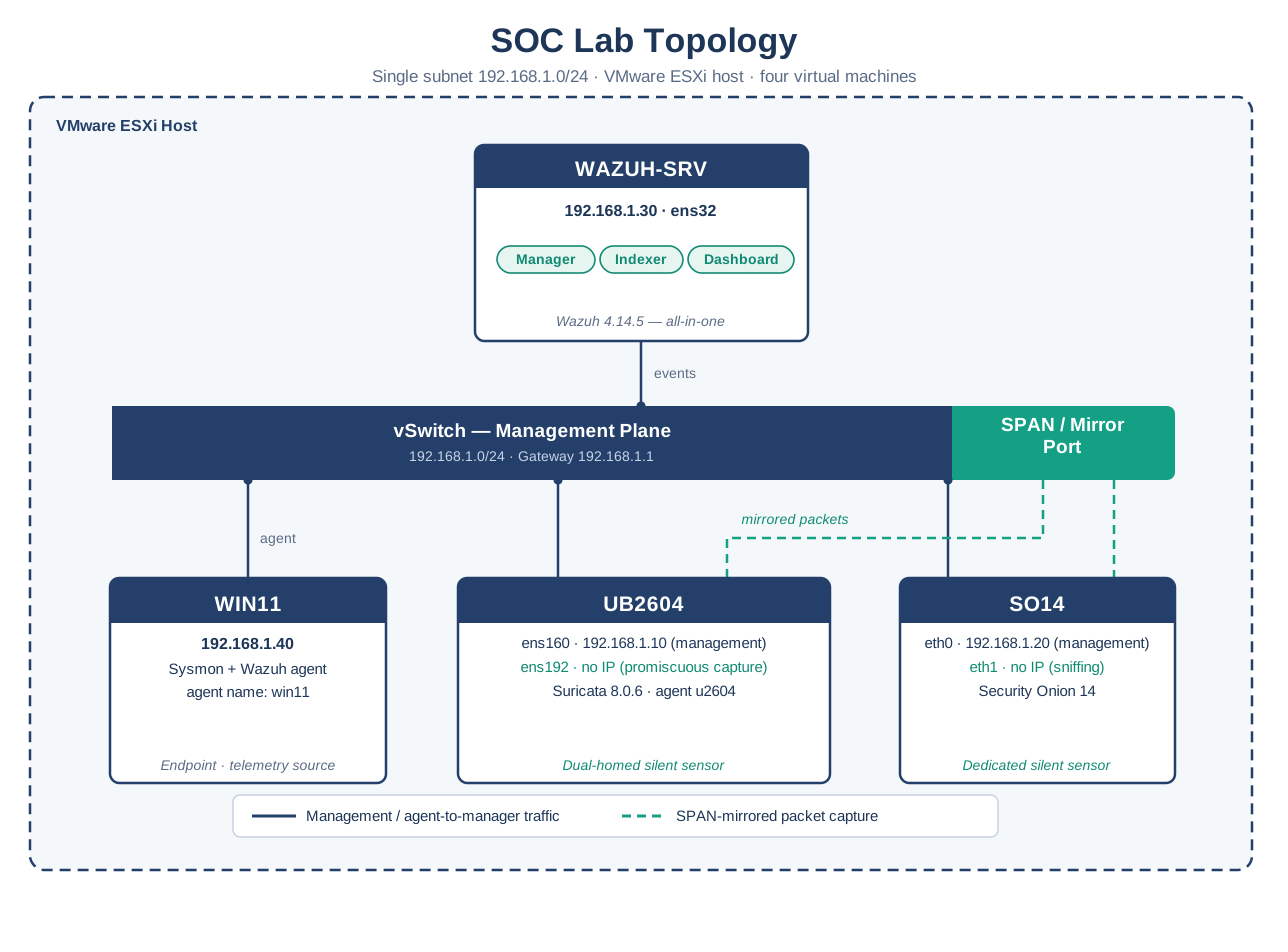
Note. The diagram identifies the primary components of complete Laboratory Topology and shows how they connect, exchange data, and support security operations.
| WAZUH SERVER Manager Indexer Dashboard |
|---|
Figure 3-2
Secure Agent Communication
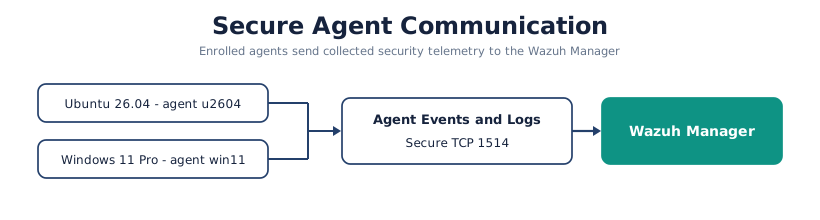
Note. TCP 1514 is the Wazuh Agent connection service: enrolled agents use this secure channel to send collected events, logs, and other security telemetry to the Wazuh Manager for analysis. It is not the enrollment or Dashboard port (Wazuh, Inc., n.d.-a).
Know What Each Wazuh Port Carries
A listening port identifies a service, not merely an open firewall rule. During troubleshooting, ask which component is communicating, what data should cross the connection, and whether the flow is enrollment, telemetry, administration, clustering, or syslog collection. The default ports are configurable, but both ends and any intervening firewall must agree (Wazuh, Inc., n.d.-a).
| Default port | Communication path | Purpose |
|---|---|---|
| TCP 1514 | Wazuh Agent → Wazuh Manager | Persistent secure Agent connection used to send events, logs, and security telemetry for analysis |
| TCP 1515 | Wazuh Agent → Wazuh Manager | Agent enrollment and key request; not routine event transport |
| TCP 55000 (HTTPS) | Authorized client → Wazuh Server | Wazuh REST API; restrict access to systems and users that require it |
| TCP 1516 | Wazuh Server ↔︎ Wazuh Server | Manager-node communication in a multi-node Wazuh cluster; endpoints do not use it |
| UDP/TCP 514 | Network device → Wazuh Server | Syslog collection when explicitly configured; disabled by default |
For the single-node course laboratory, an intervening firewall normally permits the endpoint networks to reach WAZUH-SRV on TCP 1514 and TCP 1515. Do not expose TCP 1516 to endpoints, and do not expose TCP 55000 broadly. Older deployments may use UDP 1514, but current Wazuh Agent communication uses TCP 1514 by default (Wazuh, Inc., n.d.-a).
This distinction prevents a common diagnostic error: a successful enrollment on TCP 1515 does not prove that Agent events are flowing on TCP 1514. Validate the port that corresponds to the failed stage of the pipeline.
Integrating Emerging Threats Open
One enhancement over many introductory Wazuh labs is the inclusion of Emerging Threats Open (ET Open) as a first-class component of the architecture (Proofpoint, n.d.). Instead of treating the rule set as an afterthought, students will learn that ET Open is an integral part of the network detection pipeline.
The workflow is:
Figure 3-3
From Network Packet to SOC Analyst
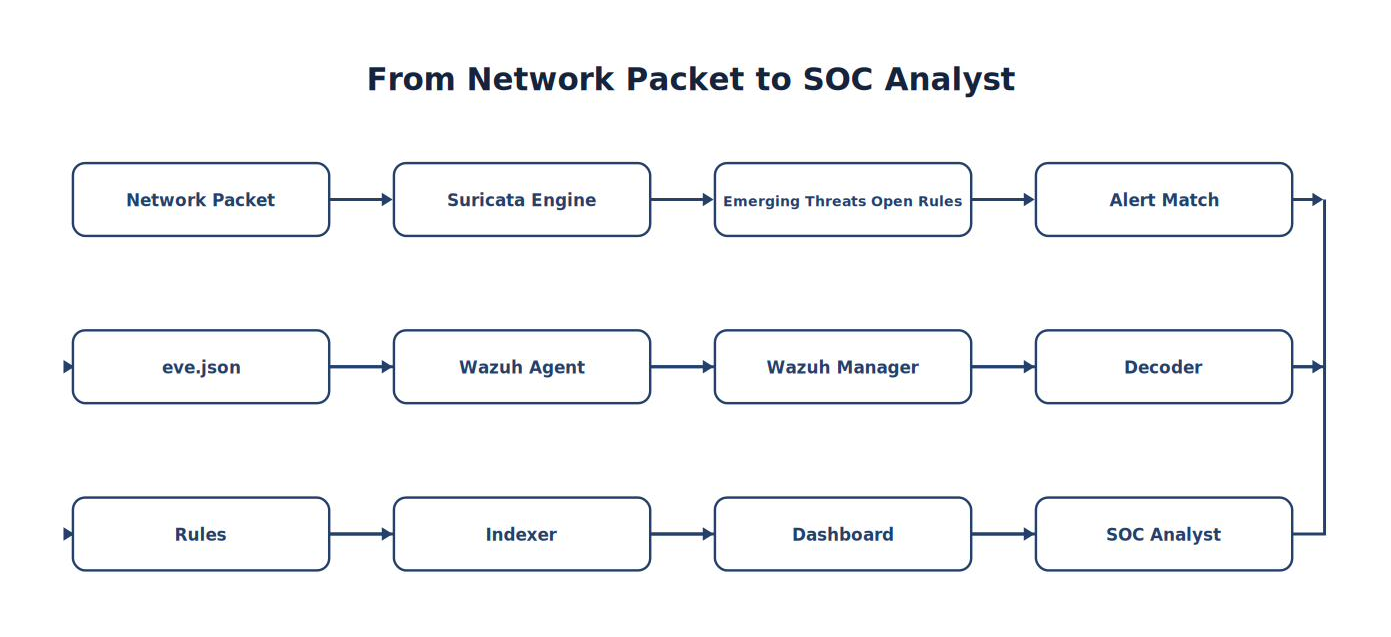
Note. The sequence traces how Network Packet progresses to SOC Analyst, emphasizing the intermediate evidence and processing steps.
Read One Authentic ET Open Rule
The following ET Open signature is a useful first example because it combines direction, connection state, a content match, case handling, an HTTP buffer, a negated exception, rate limiting, classification, and rule identity. It is shown as published; ET Open revisions can change as the community tunes detections (Proofpoint, n.d.).
ET OPEN · SURICATA RULE · SID 2003927
alert http $HOME_NET any -> $EXTERNAL_NET any (msg:"ET USER_AGENTS Suspicious User-Agent (HTTPTEST) - Seen used by downloaders"; flow:to_server,established; content:"HTTPTEST"; nocase; http_user_agent; depth:8; content:!"PlayStation"; http_header; threshold: type limit, count 2, track by_src, seconds 300; classtype:trojan-activity; sid:2003927; rev:12;)Read the signature from left to right:
| Rule part | What it tells the analyst |
|---|---|
alert http |
Inspect HTTP traffic and generate an alert when every condition matches. |
$HOME_NET any -> $EXTERNAL_NET any |
Evaluate outbound traffic from an internal host to an external destination on any port. |
flow:to_server,established |
Require an established connection traveling toward the server. |
content:"HTTPTEST"; nocase; http_user_agent; depth:8 |
Search the first eight bytes of the normalized HTTP User-Agent buffer for HTTPTEST, without case sensitivity. |
content:!"PlayStation"; http_header |
Exclude traffic whose HTTP headers contain PlayStation; the exclamation mark negates the match. |
threshold: type limit, count 2, track by_src, seconds 300 |
Limit alerts to two per source address in five minutes, reducing repetitive noise. |
classtype:trojan-activity |
Assign the rule's alert classification. |
sid:2003927; rev:12 |
Identify the signature and its revision so analysts can search, document, suppress, or compare it precisely. |
The lesson is not to memorize every keyword. First identify the traffic scope, then the required evidence, then any exceptions or noise controls, and finally the SID and revision. Chapter 5 develops this anatomy into rule testing, tuning, suppression, and custom signature design.
Throughout later chapters, students will learn not only how to update ET Open, but also how to:
Read rule syntax.
Enable and disable rules.
Suppress noisy signatures.
Tune HOME_NET and EXTERNAL_NET.
Write custom Suricata signatures.
Validate detections using controlled attacks.
Chapter Roadmap
Chapter 3 is intentionally different from the conceptual chapters that preceded it. It marks the transition from theory to implementation. Over the next sections, students will:
Design the virtual network.
Assign IP addresses and hostnames.
Build the Wazuh Server.
Configure Ubuntu 26.04.
Install the Wazuh Agent.
Install Suricata.
Configure Emerging Threats Open.
Install Windows 11.
Configure Sysmon.
Validate the complete telemetry pipeline.
Perform the first end-to-end SOC health verification.
By the end of Chapter 3, every student will have a fully operational SOC lab capable of generating, collecting, correlating, and investigating security telemetry—the foundation for all subsequent detection engineering, threat hunting, and incident response exercises.
3.1 Laboratory Planning and Design
Learning Objectives
After completing this section, you should be able to:
Explain why planning is essential before deploying a SOC.
Design a repeatable virtual infrastructure.
Develop a logical IP addressing scheme.
Understand host naming conventions.
Document a cybersecurity laboratory using professional engineering practices.
Introduction
One of the most common mistakes made by beginning cybersecurity students is starting installations immediately.
The process often looks like this:
Install Windows.
Install Ubuntu.
Install Wazuh.
Install Suricata.
Hope everything works.
Professional engineers work differently. They plan first. Large organizations may spend weeks designing infrastructure before installing a single operating system. Although our laboratory is much smaller, the engineering methodology remains exactly the same. Good planning reduces installation problems, simplifies troubleshooting, and creates an environment that can be expanded throughout the remainder of the textbook.
Engineering Before Installation
Imagine constructing a hospital.
Would construction begin before creating architectural drawings?
Of course not. Cybersecurity laboratories deserve the same level of planning.
Before installing software, engineers answer questions such as:
Which systems are required?
How will they communicate?
Which IP addresses will they use?
Which systems monitor traffic?
Which components require Internet access?
Which systems generate telemetry?
Which services depend upon other services?
Only after answering these questions does installation begin.
Analyst Tradecraft Tip
One habit has consistently distinguished successful cybersecurity professionals throughout my career:
They document everything. Documentation is not busy work. Documentation is a troubleshooting tool.
Maintain a Laboratory Build Record
Three weeks after building a laboratory, you should be able to answer questions such as:
Which version of Ubuntu am I running?
Which IP address belongs to Suricata?
Which interface operates in promiscuous mode?
Which Emerging Threats rule set is installed?
Which version of Sysmon am I using?
Which Wazuh Agent version is installed?
If you cannot answer those questions quickly, your documentation is incomplete.
Laboratory Design Principles
Throughout this textbook, the laboratory follows six engineering principles.
Principle 1 — Simplicity
Every component should have a clearly defined purpose. Avoid unnecessary systems. If a machine contributes no operational value, it does not belong in the laboratory.
Principle 2 — Consistency
Every student should use:
Similar hostnames
Similar IP addresses
Similar operating systems
Similar software versions
Consistency greatly simplifies classroom troubleshooting.
Principle 3 — Repeatability
A professional laboratory should be reproducible. If the entire environment is lost, you should be able to rebuild it using only your documentation. This is one reason virtualization is so valuable.
Principle 4 — Isolation
The laboratory should remain isolated from production networks whenever possible. Document its trust boundaries, management paths, permitted external connectivity, and sensor visibility so students can explain what each interface can reach and observe. These principles are consistent with secure enterprise network design, but this instructional topology is not a claim of NIST compliance (Chandramouli, 2022).
Students will intentionally generate:
Malware detections
Port scans
Password attacks
PowerShell activity
Network reconnaissance
DNS testing
These activities should remain within the controlled environment.
Principle 5 — Expandability
Today’s four-machine laboratory becomes tomorrow’s enterprise network.
Later chapters will introduce:
Active Directory
Multiple Windows endpoints
Kali Linux
Linux servers
Web servers
Vulnerability scanners
Docker containers
Cloud logging
Zeek
pfSense
A good design anticipates future growth.
Principle 6 — Validation
Every installation step concludes with verification. Never assume a configuration works simply because no error appeared. Generate telemetry. Verify alerts. Confirm communication. Trust evidence—not assumptions.
Laboratory Documentation
Professional engineers maintain infrastructure documentation. Throughout this textbook, students will create and maintain a SOC Engineering Notebook.
The notebook records:
| Category | Information |
|---|---|
| Hostnames | Every system name |
| IP Addresses | IPv4 and IPv6 assignments |
| Operating Systems | Version and build |
| Installed Software | Versions and installation dates |
| Network Interfaces | Interface names and roles |
| Snapshots | VMware snapshot history |
| Configuration Changes | Date, change, reason |
| Problems Encountered | Symptoms and resolution |
This notebook becomes one of the most valuable tools in the course.
Host Naming Standards
Large organizations rarely name computers randomly. Compare these examples.
Poor naming:
Computer1
Ubuntu
Jim-PC
Windows
LinuxBox
Professional naming:
WAZUH-SRV
UB2604
WIN11
SO14
Immediately, the second naming convention communicates purpose. Throughout this textbook we will use consistent naming standards.
Recommended Hostnames
| System | Hostname | Agent Name |
|---|---|---|
| Wazuh Server | WAZUH-SRV | — |
| Ubuntu Sensor | UB2604 | u2604 |
| Windows Endpoint | WIN11 | win11 |
| Security Onion | SO14 | — |
As the laboratory expands, additional systems will follow the same convention.
Examples:
WIN11-B
UBU-WEB01
DC01
WEB01
Consistency simplifies investigations. Note that Wazuh agent names (set at enrollment) are lowercase — u2604, win11 — while hostnames are uppercase. Dashboard queries are case-sensitive, so this distinction matters the moment you search for events.
IP Address Planning
Good network design begins with predictable addressing. Throughout this textbook we use a dedicated laboratory subnet.
Example:
| Host | Interface | IPv4 Address |
|---|---|---|
| WAZUH-SRV | ens32 | 192.168.1.30 |
| Security Onion | eth0 | 192.168.1.20 |
| Security Onion | eth1 (sniffing) | No IP |
| Ubuntu Sensor | ens160 (management) | 192.168.1.10 |
| Ubuntu Sensor | ens192 (promiscuous) | none — silent capture |
| Windows 11 | Ethernet | 192.168.1.40 |
| VMware Gateway | — | 192.168.1.1 |
Students should avoid relying on DHCP whenever possible. Static addressing improves troubleshooting and documentation.
Figure 3-4
Laboratory Address Plan
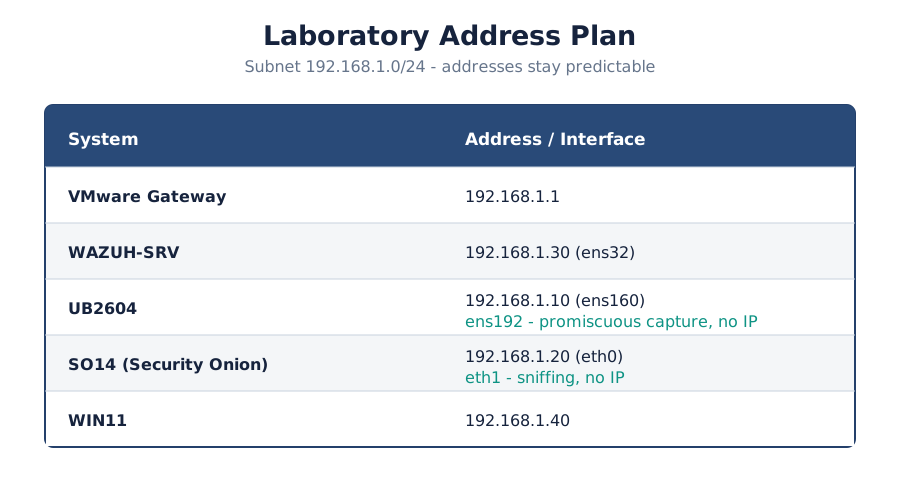
Note. The figure summarizes laboratory Address Plan and highlights the relationships among its principal elements, evidence sources, and analytical outcomes.
As additional systems are introduced, addresses remain predictable.
Network Interface Documentation
One lesson learned from our own laboratory development is that network interfaces matter. For example, the Ubuntu sensor contains two interfaces.
| Interface | IPv4 Address | Purpose |
|---|---|---|
| ens160 | 192.168.1.10 | Management and Internet access |
| ens192 | none | Suricata monitoring (Promiscuous Mode) |
Note that in this laboratory ens192 carries no IP address and runs in promiscuous mode — the silent sensor design introduced in Chapter 1. The interface receives every frame on the segment but cannot itself be addressed. Security Onion’s dedicated sniffing interface (eth1) uses the same design. What differs between the two is role, not addressing: UB2604 is a dual-homed host that also captures, while SO14 is a dedicated capture appliance.
Students should document:
Interface names
MAC addresses
IP addresses
Connected virtual network
Operational purpose
Failure to document interfaces is one of the most common causes of Suricata troubleshooting problems.
Analyst Tradecraft Tip
Name the interface—not its position.
Write ens160 or ens192, never “first adapter” or “second NIC.”
Version Control
Another hallmark of professional engineering is version tracking.
Throughout the course, students will record:
| Component | Example | Version-check syntax |
|---|---|---|
| Ubuntu | 26.04 LTS | lsb_release -ds |
| Wazuh | 4.14.5 | /var/ossec/bin/wazuh-control info -v |
| Suricata | 8.0.6 | suricata --version |
| Emerging Threats Open | Current daily snapshot | stat -c '%y %n' /var/lib/suricata/rules/suricata.rules |
| Sysmon | Current release | & "$env:WINDIR\Sysmon64.exe" -? |
| Windows 11 | Current supported build | Get-ComputerInfo | Select-Object WindowsProductName,WindowsVersion,OsBuildNumber |
| Security Onion | 14 | cat /etc/soversion |
When troubleshooting, version information is often just as important as configuration.
Think Like a Cybersecurity Analyst
Suppose another instructor asks you to duplicate your laboratory.
Could you rebuild it using only your documentation?
If the answer is no, your documentation is incomplete.
Professional engineers create environments that are:
Repeatable
Understandable
Maintainable
Expandable
Recoverable
Those five characteristics will guide the design of every system throughout this textbook.
Looking Ahead
With the laboratory design complete, the next section begins building the virtual infrastructure itself. Students will learn how to configure VMware networking, choose the appropriate virtual network modes, assign adapters, create snapshots, allocate CPU and memory resources, and prepare each virtual machine for installation. By the end of the next section, the virtual foundation of the Security Operations Center will be complete and ready for operating system deployment.
3.2 Virtualization — The Foundation of the Modern Security Operations Center
Learning Objectives
After completing this section, you should be able to:
Explain why virtualization is fundamental to cybersecurity.
Describe the advantages of VMware Workstation for SOC laboratories.
Differentiate between virtual machines, virtual networks, and virtual switches.
Understand resource planning for a multi-system laboratory.
Explain why snapshots are one of the most valuable cybersecurity tools available.
Introduction
Nearly every modern Security Operations Center relies heavily on virtualization. Whether deployed in a university laboratory, a corporate data center, or a cloud environment, security professionals routinely investigate systems that exist entirely as virtual machines. Virtualization has transformed cybersecurity by allowing analysts to rapidly deploy, modify, clone, snapshot, destroy, and rebuild complete computing environments within minutes. Without virtualization, building a Security Operations Center would require multiple physical servers, networking equipment, storage systems, and considerable financial investment. Instead, our entire SOC operates on a single workstation.
What Is Virtualization?
Virtualization is the process of creating software-based computers that behave exactly like physical computers.
Each virtual machine has its own:
CPU
Memory
Storage
Network adapters
BIOS/UEFI
Operating system
Applications
Security software
To the operating system, there is no practical difference between running on physical hardware or virtual hardware. Windows believes it is installed on a real computer. Ubuntu believes it is installed on a real computer. Suricata has no knowledge that the packets it analyzes originate from virtual network adapters. This abstraction makes virtualization one of the most important technologies in modern cybersecurity.
Figure 3-5
Physical vs. Virtual Infrastructure
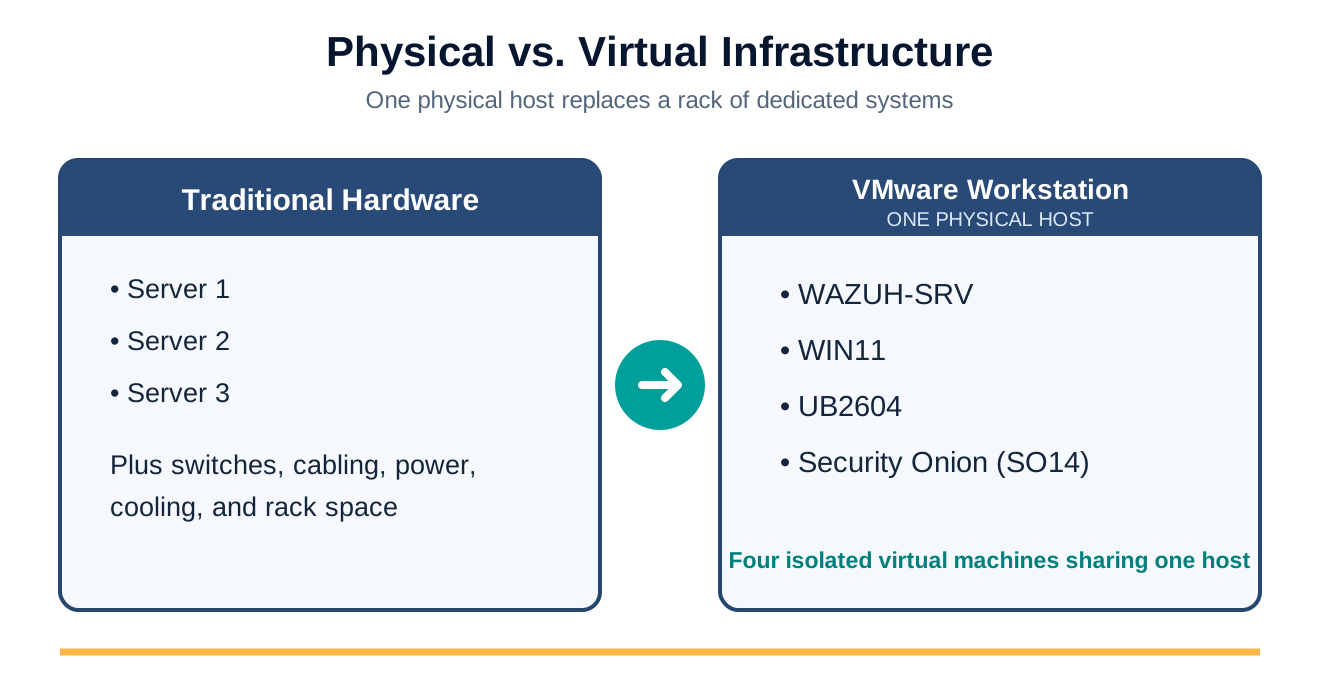
Note. The figure organizes the major elements of physical vs. Virtual Infrastructure to clarify their roles, relationships, and escalation or inheritance paths.
One physical computer now hosts an entire Security Operations Center.
Why Virtualization Changed Cybersecurity
Virtualization offers several significant advantages.
Rapid Deployment
Creating a new server often requires only a few minutes. No physical hardware needs to be purchased.
Safe Malware Testing
Students will intentionally generate:
Malware detections
PowerShell alerts
Port scans
Network attacks
Authentication attacks
Virtual machines isolate these activities from production systems.
Repeatability
If something breaks, restore a snapshot. The laboratory immediately returns to a known-good configuration.
Cost Reduction
A four-system SOC laboratory requiring thousands of dollars in hardware can be operated from a single workstation.
Easy Recovery
Mistakes become learning opportunities rather than disasters. Snapshots allow complete recovery within minutes.
Analyst Tradecraft Tip
One phrase you’ll hear throughout this course is:
“Take a snapshot before making changes.” Professional SOC engineers never perform major upgrades without first creating a recovery point. Snapshots have saved countless hours of rebuilding laboratories after configuration mistakes, failed software updates, or accidental deletions. If you develop only one virtualization habit from this textbook, make it this one.
Understanding the Hypervisor
A hypervisor is the software responsible for creating and managing virtual machines.
Examples include:
| Hypervisor | Common Usage |
|---|---|
| VMware Workstation | Desktop laboratories |
| VMware ESXi | Enterprise data centers |
| Microsoft Hyper-V | Windows environments |
| Oracle VirtualBox | Education and home labs |
| Proxmox VE | Enterprise homelabs |
| KVM | Linux servers |
Throughout this textbook we use VMware Workstation because it provides:
Excellent stability
Robust snapshot management
Flexible virtual networking
Strong hardware compatibility
Enterprise-quality virtualization
VMware Components
Students often think VMware simply “runs virtual machines.” It actually provides several independent technologies.
| Component | Purpose |
|---|---|
| Virtual Machine | Simulated computer |
| Virtual Disk | Simulated hard drive |
| Virtual Network Adapter | Simulated network card |
| Virtual Switch | Connects virtual machines |
| Snapshot Manager | Recovery system |
| Virtual BIOS/UEFI | Hardware initialization |
| VM Configuration File | Hardware definition |
Understanding these components greatly simplifies troubleshooting.
Hardware Resource Planning
Unlike physical computers, virtual machines share hardware resources. Proper planning prevents performance problems.
Recommended minimum resources for our laboratory:
| Virtual Machine | vCPU | Memory | Storage |
|---|---|---|---|
| WAZUH-SRV | 8 | 16 GB | 250 GB |
| Ubuntu Sensor | 4 | 8 GB | 80 GB |
| Windows 11 | 4 | 8 GB | 100 GB |
| Security Onion | 8 | 16 GB | 200 GB |
Host computer recommendation:
| Resource | Recommended |
|---|---|
| Memory | 64 GB RAM |
| SSD | 1 TB NVMe |
| VMware | Current Version |
These recommendations provide sufficient resources for smooth laboratory operation while leaving capacity for future expansion.
Resource Overcommitment
Virtualization allows more virtual CPUs and memory to be assigned than physically exist. This is called overcommitment.
While useful in enterprise environments, excessive overcommitment can lead to:
Slow virtual machines
Delayed alerts
Dropped packets
Missed Suricata detections
Poor user experience
Throughout this textbook we intentionally allocate conservative resources to ensure consistent performance.
Understanding Virtual Hardware
Every virtual machine receives simulated hardware.
Windows and Ubuntu detect devices such as:
Network adapters
Hard disks
Display adapters
USB controllers
Firmware
Sound devices (optional)
Although simulated, these devices behave much like physical hardware.
For example, Ubuntu identifies virtual NICs using predictable names such as:
ens160 ens192
These interface names become important when configuring Suricata.
The Importance of Snapshots
Snapshots are perhaps the single greatest advantage of virtualization.
A snapshot records:
Virtual disks
Memory state (optional)
Virtual hardware configuration
Machine state
Before making major changes, create a snapshot.
Examples include:
Installing Wazuh
Updating Ubuntu
Modifying Sysmon
Editing Suricata configuration
Changing HOME_NET
Installing Emerging Threats
Testing malware
If something goes wrong, restore the snapshot. Recovery typically requires only minutes.
Figure 3-6
Snapshot Workflow
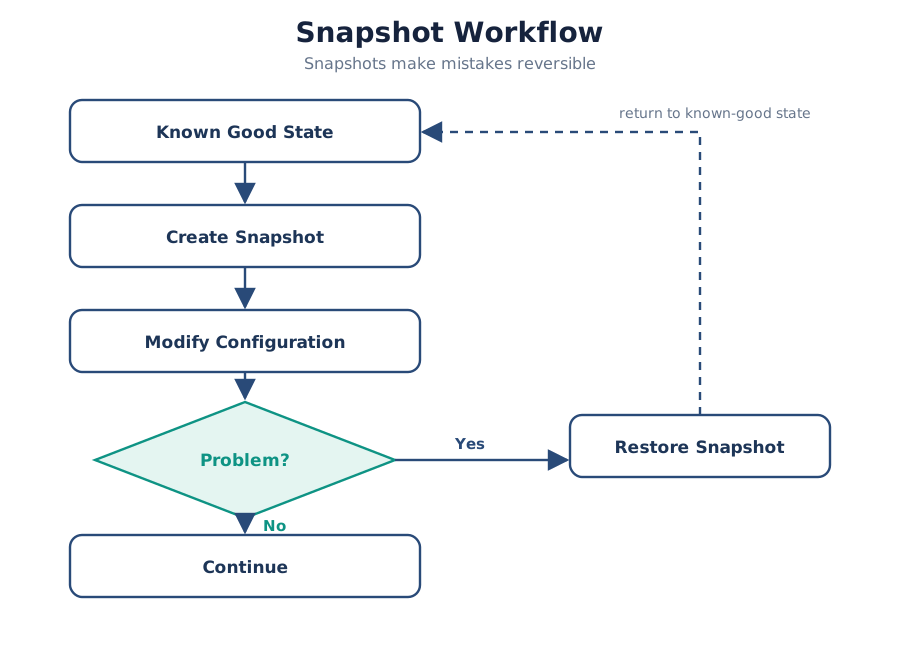
Note. The workflow presents the ordered stages of snapshot Workflow and highlights the validation and feedback steps that make the process repeatable.
Snapshots encourage experimentation because mistakes become reversible.
Snapshot Naming Standards
Use snapshot names that identify a recognizable system state or milestone. Avoid vague labels such as Snapshot 1, Backup, Today, or Test. Prefer descriptive names such as Fresh Windows Install, Before Sysmon Installation, Before Wazuh Agent, Before Suricata Install, After ET Rules Configured, or Lab 3 Completed. A clear name should tell another analyst exactly which recovery point to select without opening or guessing from each snapshot.
Configuration Backup Filename Standard
Virtual-machine snapshots protect an entire system; file-level backups protect the configuration being changed. Use one common taxonomy throughout the laboratory:
BACKUP FILENAME TAXONOMY
filename.pre-change-desc.$(date +%y%m%d-%H%M%S).bakThe pattern preserves five useful facts: the original filename, that the copy was made before a change, a short description of the planned change, the local date and time, and the .bak backup designation. Keep desc concise and use hyphens instead of spaces. For example, before enabling additional EVE JSON output in Suricata's configuration on UB2604, type:
UB2604 · TERMINAL
sudo cp /etc/suricata/suricata.yaml /etc/suricata/suricata.yaml.pre-change-enable-eve-json.$(date +%y%m%d-%H%M%S).bakExpected result: The directory contains the working file and a backup resembling suricata.yaml.pre-change-enable-eve-json.260830-171500.bak. Use this taxonomy for Wazuh, Suricata, Sysmon, and other configuration files so the filename alone explains what was protected, why the copy was made, and when it was created.
Common Student Mistake
Students often create one snapshot at the beginning of the semester and never create another.
Professional engineers create snapshots:
Before upgrades
Before software installations
Before configuration changes
Before malware testing
Before laboratory exercises involving significant risk
Snapshots are part of normal operational workflow—not emergency recovery.
Best Practice
Maintain at least three important snapshots for every virtual machine:
| Snapshot | Purpose |
|---|---|
| Clean Installation | Operating system only |
| Software Installed | Major applications installed |
| Current Stable Configuration | Ready for classroom exercises |
This strategy allows recovery to multiple stages of the laboratory lifecycle.
Analyst Tradecraft Tip
Think like an offender. Defend like a defender.
Plan Recovery Before Failure
Imagine your Suricata configuration becomes corrupted immediately before a classroom demonstration. If you created a snapshot five minutes earlier, recovery requires less than a minute. Without a snapshot, you may spend hours rebuilding the system. Professional engineers plan for failure before failure occurs.
Looking Ahead
With virtualization understood, the next section explores one of the most important—and most misunderstood—topics in cybersecurity laboratories:
Virtual networking. Students will learn how VMware virtual switches work, the differences between Bridged, NAT, and Host-Only networking, why promiscuous mode matters for network intrusion detection, and how to design a network that allows Suricata to observe the traffic it must inspect. This networking foundation will directly support the installation and validation of Suricata, Wazuh, and the complete telemetry pipeline later in the chapter.
3.3 VMware Virtual Networking
Learning Objectives
After completing this section, you should be able to:
Explain how virtual networking operates within VMware Workstation.
Differentiate between Bridged, NAT, and Host-Only networking.
Understand how virtual switches forward traffic.
Explain why network architecture directly affects IDS visibility.
Design a VMware network suitable for a Security Operations Center laboratory.
Introduction
Computers cannot investigate network traffic unless they can see network traffic. That statement sounds obvious. However, it is one of the most misunderstood concepts in beginner cybersecurity laboratories. Students often install Suricata correctly. The Emerging Threats rules load successfully. The Wazuh Agent runs normally. Everything appears operational. Yet no alerts are generated. The problem usually isn’t Suricata. The problem is that Suricata never receives the packets. Before configuring any Network Intrusion Detection System (NIDS), we must understand how packets move through VMware virtual networks.
Virtual Networks
Inside VMware Workstation, virtual machines communicate through virtual switches. A virtual switch behaves much like a physical Ethernet switch.
It:
Connects devices.
Learns MAC addresses.
Forwards Ethernet frames.
Separates broadcast domains.
Maintains Layer 2 connectivity.
The difference is that everything occurs in software.
Figure 3-7
VMware Virtual Switch
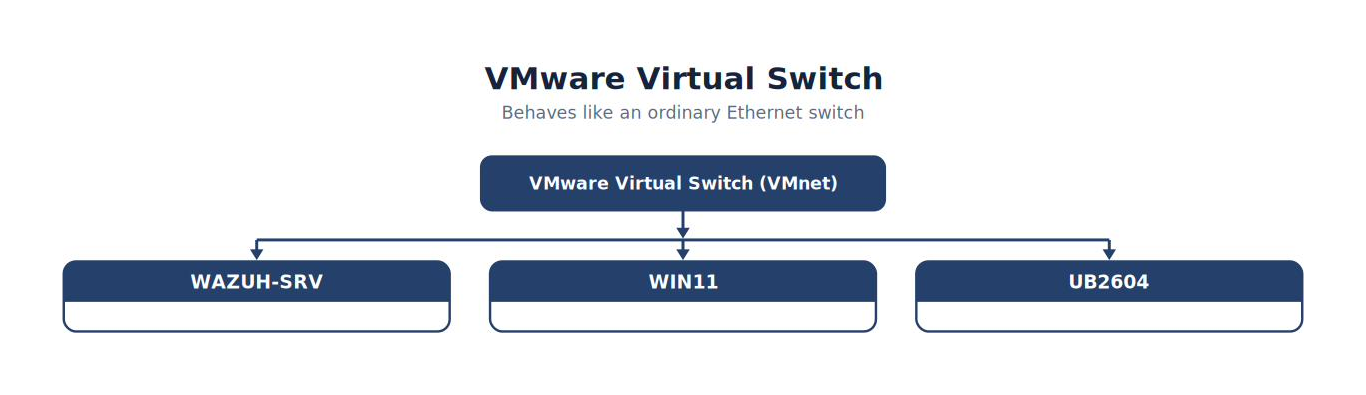
Note. The figure summarizes vMware Virtual Switch and highlights the relationships among its principal elements, evidence sources, and analytical outcomes.
Understanding VMnet Networks
VMware creates several virtual networks.
The most common are:
| Network | Purpose |
|---|---|
| VMnet0 | Bridged |
| VMnet1 | Host-Only |
| VMnet8 | NAT |
Additional VMnets may be created for specialized laboratory environments. Each virtual machine connects one or more virtual network adapters to one of these virtual networks.
Bridged Networking
In Bridged Mode, the virtual machine appears as an independent device on the physical network.
The VM receives:
Its own MAC address.
Its own IP address.
Direct Layer 2 connectivity.
Visibility from other devices.
Example:
Physical Switch
Figure 3-8
VMware Networking Modes
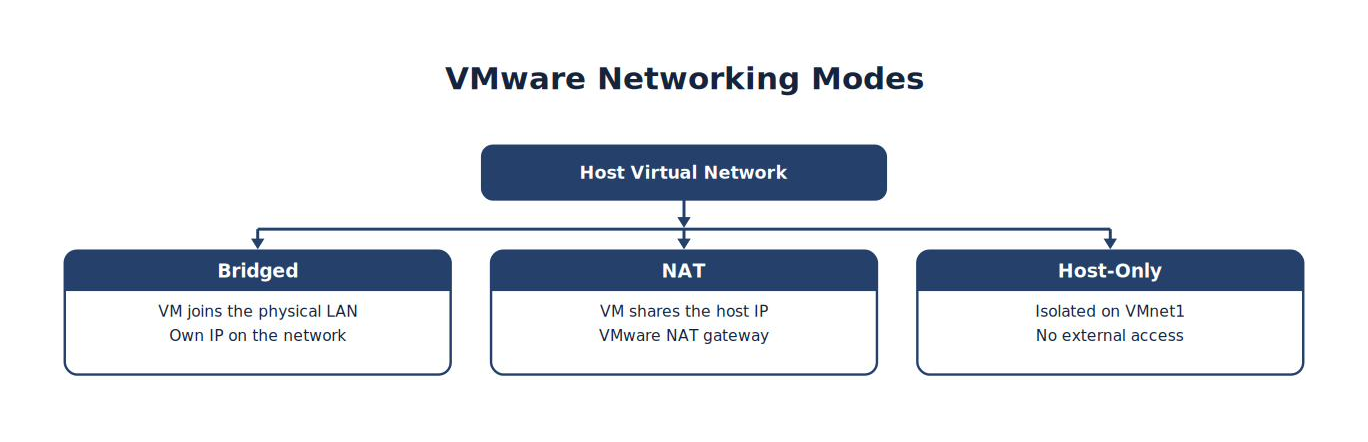
Note. The figure summarizes vMware Networking Modes and highlights the relationships among its principal elements, evidence sources, and analytical outcomes.
In bridged mode, each VM behaves like a separate physical computer on the LAN. This provides realistic communication and visibility for IDS monitoring.
NAT Networking
In NAT mode, VMware routes traffic for the VMs instead of exposing each VM directly to the physical network. NAT is simple and provides Internet access with additional isolation, but it offers less realistic topology and more limited packet visibility.
Host-Only Networking
Host-only mode isolates the VMs from the physical network and provides no Internet access unless routing is added. It is useful for malware analysis, isolated attack labs, and offline experimentation.
Comparing Network Modes
| Feature | Bridged | NAT | Host-Only |
|---|---|---|---|
| Internet Access | Yes | Yes | No |
| Visible on Physical LAN | Yes | No | No |
| Receives DHCP from LAN | Yes | No | No |
| Suitable for Enterprise Simulation | Excellent | Good | Limited |
| Malware Isolation | Low | Medium | High |
No mode is universally “best.” The correct choice depends on laboratory objectives.
Analyst Tradecraft Tip
Choose the network mode that supports the objective.
Throughout this textbook, the labs use multiple network modes because each mode serves a different purpose. Understanding their tradeoffs is more valuable than memorizing one configuration.
Multiple Network Adapters
One of the strengths of virtualization is that a single virtual machine may contain multiple network adapters. Our Ubuntu sensor uses this capability extensively.
Example:
| Adapter | Purpose |
|---|---|
| ens160 | Management |
| ens192 | Network Monitoring |
These adapters perform entirely different jobs. Management traffic should never interfere with packet capture.
Figure 3-9
Dual-Homed Ubuntu Sensor
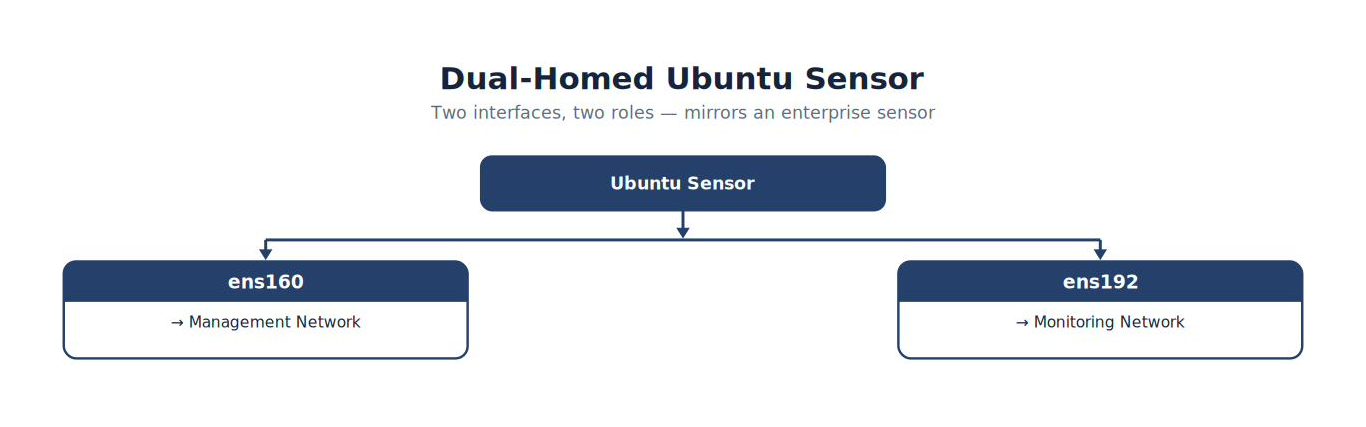
Note. The figure summarizes dual-Homed Ubuntu Sensor and highlights the relationships among its principal elements, evidence sources, and analytical outcomes.
This design closely resembles enterprise network sensors.
Why Suricata Needs Visibility
Remember one fundamental principle. Suricata cannot inspect packets it never receives. Imagine placing a security camera inside a room.
Can it monitor activity occurring outside the building?
Of course not. Network Intrusion Detection Systems behave similarly. Visibility determines detection capability.
Packet Flow
Consider a simple web request.
Figure 3-10
From Windows Browser to Dashboard
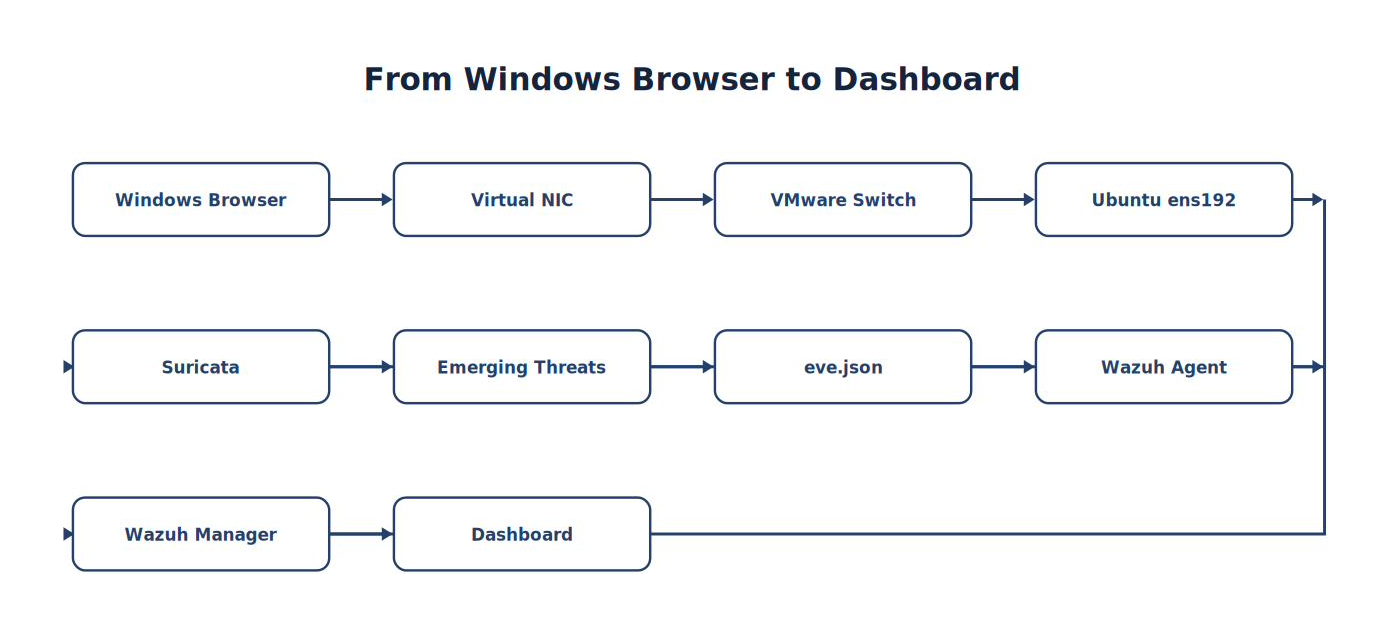
Note. The sequence traces how Windows Browser progresses to Dashboard, emphasizing the intermediate evidence and processing steps.
Every laboratory exercise later in this textbook follows this exact path. Understanding it now greatly simplifies troubleshooting later.
Promiscuous Mode
By default, network interfaces accept only packets addressed to themselves. Promiscuous mode changes this behavior.
When enabled, the interface accepts:
Unicast traffic
Broadcast traffic
Multicast traffic
Packets not specifically addressed to the interface (subject to the virtual networking architecture)
For Suricata, this greatly expands packet visibility.
Important Clarification
Many beginning analysts believe that enabling promiscuous mode alone allows an interface to see all network traffic. This is not correct. Promiscuous mode only allows the interface to accept packets that actually reach it. If the virtual switch never forwards the traffic to the monitoring interface, Suricata cannot inspect it regardless of the interface mode. Visibility is determined by both the network architecture and the interface configuration.
Figure 3-11
Packet Visibility
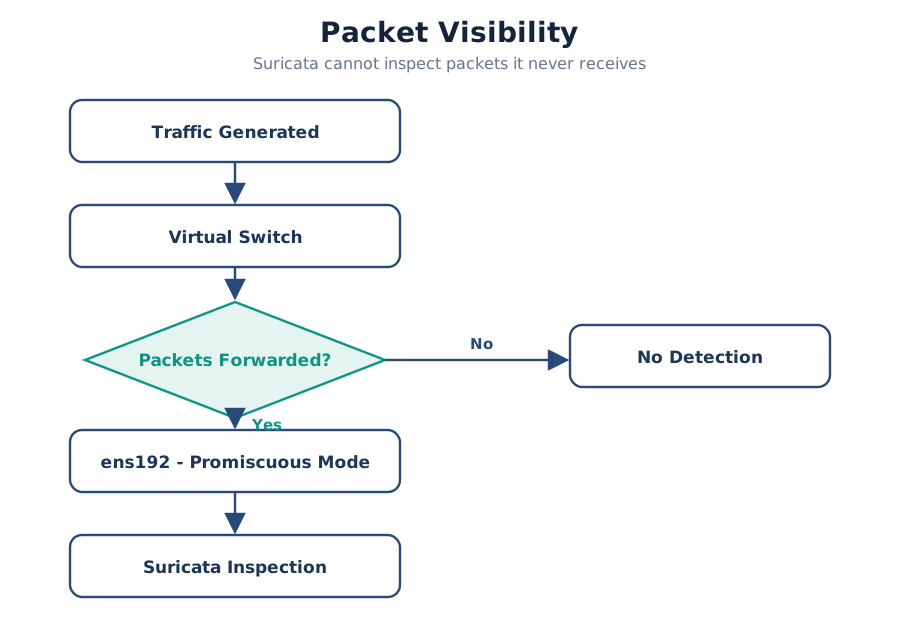
Note. The figure summarizes packet Visibility and highlights the relationships among its principal elements, evidence sources, and analytical outcomes.
Why We Use Two Interfaces
Earlier in the textbook you configured Ubuntu with two network adapters. This design is intentional.
| Interface | Responsibility |
|---|---|
| ens160 | System management, updates, Wazuh Agent communication |
| ens192 | Dedicated packet monitoring for Suricata |
Separating management traffic from monitoring traffic provides several advantages:
Easier troubleshooting
Improved security
Better performance
More realistic enterprise architecture
Simplified packet capture
This mirrors how many production network sensors are deployed.
Common Student Mistake
Students often configure Suricata to monitor the wrong interface.
Symptoms include:
No alerts in eve.json
Empty packet counters
Wazuh receives no Suricata alerts
tcpdump shows no traffic
Before modifying rules or reinstalling software, always verify:
The correct interface is selected.
The interface is up.
The interface is receiving traffic.
The expected packets actually traverse that network.
Many hours of troubleshooting can be avoided by validating these fundamentals first.
Analyst Tradecraft Tip
When Suricata appears broken, work backward through the packet path: generated traffic → VMware network → virtual switch → monitoring interface → tcpdump → Suricata → eve.json → Wazuh Agent → Manager → Dashboard. Stop at the first missing handoff.
Validate Visibility Before Detection
Before installing Suricata, verify your virtual networking. A correctly configured IDS with poor network visibility is ineffective. Conversely, a modest IDS with excellent visibility often provides outstanding detection capability (Scarfone & Mell, 2007). Visibility always precedes detection.
Looking Ahead
With the virtual network architecture complete, the next section begins preparing the Wazuh Server itself. Students will learn how to validate the server, verify required services, understand the Wazuh directory structure, identify critical configuration files, and establish the baseline operational checks that will be performed before every future laboratory exercise. From this point forward, the textbook transitions fully into hands-on system construction using the exact SOC environment developed throughout this project.
3.4 Understanding the Wazuh Server
Learning Objectives
After completing this section, you should be able to:
Describe the role of the Wazuh Server within the SOC.
Identify the major Wazuh services.
Locate critical Wazuh directories.
Understand where configuration files are stored.
Perform baseline operational health checks.
Recognize common service failures before beginning an investigation.
Introduction
Every Security Operations Center has a central nervous system. In our laboratory, that system is the Wazuh Server. This section assumes the Wazuh Server has already been built and is reachable on the network. If you have not yet installed the Wazuh central components (Manager, Indexer, and Dashboard), complete Appendix A — Building the Complete Enterprise Cybersecurity Lab before continuing. Appendix A walks through the official Wazuh installation assistant end to end; this chapter picks up from that point to validate, operate, and integrate the server into the SOC (Wazuh, Inc., n.d.-b). Although students often focus on the Dashboard because it is visually appealing, the Dashboard is only one small part of the overall platform.
The Wazuh Server performs the critical operational work:
Receiving telemetry
Decoding logs
Applying detection rules
Managing agents
Coordinating active response
Storing indexed data
Presenting information through the Dashboard
If the server is unhealthy, every downstream component suffers. For this reason, experienced analysts begin each day by validating the health of the Wazuh Server before reviewing alerts.
The Wazuh Server Is More Than One Service
Many beginning students think of Wazuh as a single application. In reality, several services work together to provide a complete SIEM platform.
In our laboratory, the primary services are:
| Service | Purpose |
|---|---|
| wazuh-manager | Processes telemetry, decodes events, evaluates rules |
| wazuh-indexer | Stores and indexes security data |
| wazuh-dashboard | Provides the web interface |
| Filebeat (if deployed) | Forwards data between components |
Each service has a unique responsibility. If one service fails, the symptoms observed by the analyst will differ. Understanding these responsibilities greatly simplifies troubleshooting.
Figure 3-12
Wazuh Service Architecture
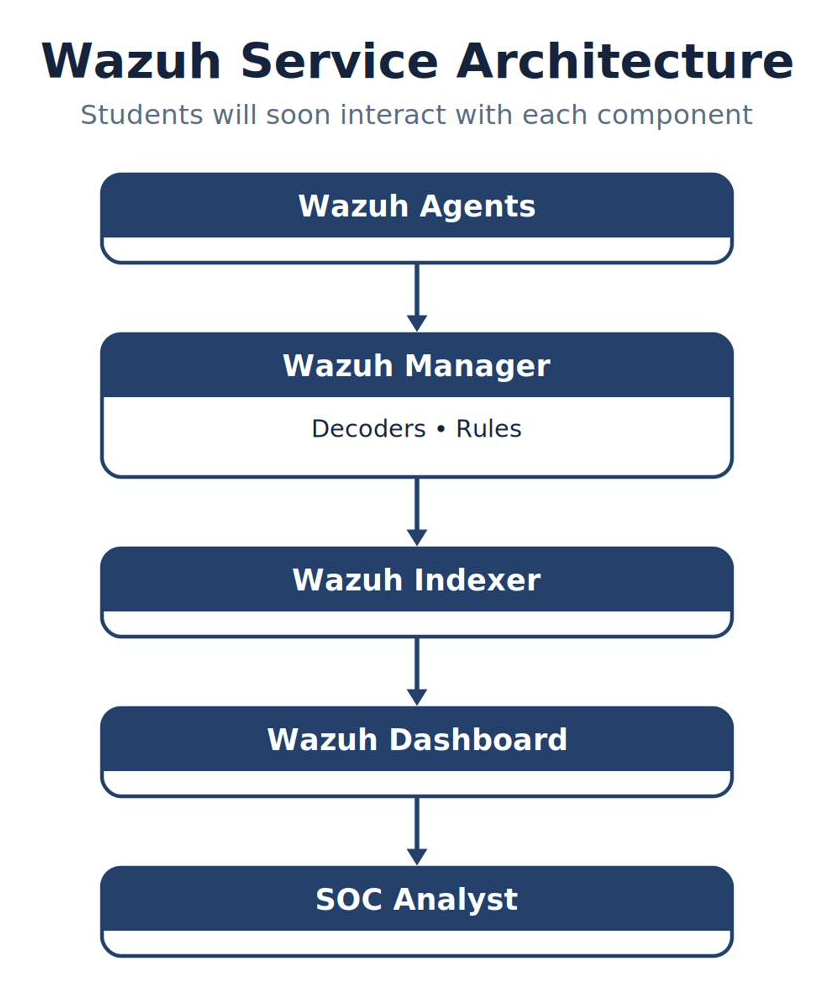
Note. The diagram identifies the primary components of wazuh Service Architecture and shows how they connect, exchange data, and support security operations.
This architecture should now be familiar. The difference is that students will soon begin interacting directly with each component.
Logging Into the Server
Most administrative work occurs from the Linux command line. Throughout this textbook, commands are shown exactly as they should be entered. Students should become comfortable using SSH or the VMware console to access the server.
A typical session begins with:
ssh student@WAZUH-SRV or, if working locally through VMware:
login:
Once authenticated, verify your identity:
whoami hostname pwd
These simple commands confirm:
Current user
Current system
Current working directory
Professional administrators perform these checks almost automatically.
Verifying the Wazuh Services
Before investigating alerts, confirm that the major services are running.
For modern Wazuh installations using systemd:
WAZUH-SRV · Terminal
sudo systemctl status wazuh-manager
sudo systemctl status wazuh-indexer
sudo systemctl status wazuh-dashboard
Alternatively, check all three at once:
WAZUH-SRV · Terminal
sudo systemctl status wazuh-manager wazuh-indexer wazuh-dashboardA healthy service should report:
Loaded: loaded
Active: active (running)
Anything else deserves investigation before proceeding.
Analyst Tradecraft Tip
Do not memorize the color of the output. Read the text. Terminal color schemes vary between Linux distributions, SSH clients, and terminal emulators. The words active (running) matter—not whether they appear in green, blue, or white.
Essential Operational Commands
These are commands every SOC analyst should know.
| Command | Purpose |
|---|---|
| hostname | Display the server hostname |
| hostname -I | Display assigned IP addresses |
| ip addr | Show all network interfaces |
| systemctl status wazuh-manager | Check Manager service |
| systemctl status wazuh-indexer | Check Indexer service |
| systemctl status wazuh-dashboard | Check Dashboard service |
| df -h | Check disk utilization |
| free -h | Check memory utilization |
| uptime | Display system uptime and load |
| journalctl -xe | Review recent system errors |
These commands form the foundation of operational health verification.
The Wazuh Directory Structure
One of the first skills every administrator should develop is understanding where things live. Although Linux provides thousands of directories, only a few are used routinely during Wazuh administration.
The primary installation directory is:
/var/ossec
Think of this directory as Wazuh’s home. Nearly everything you will configure during this textbook resides somewhere beneath it.
Figure 3-13
Simplified Directory Tree
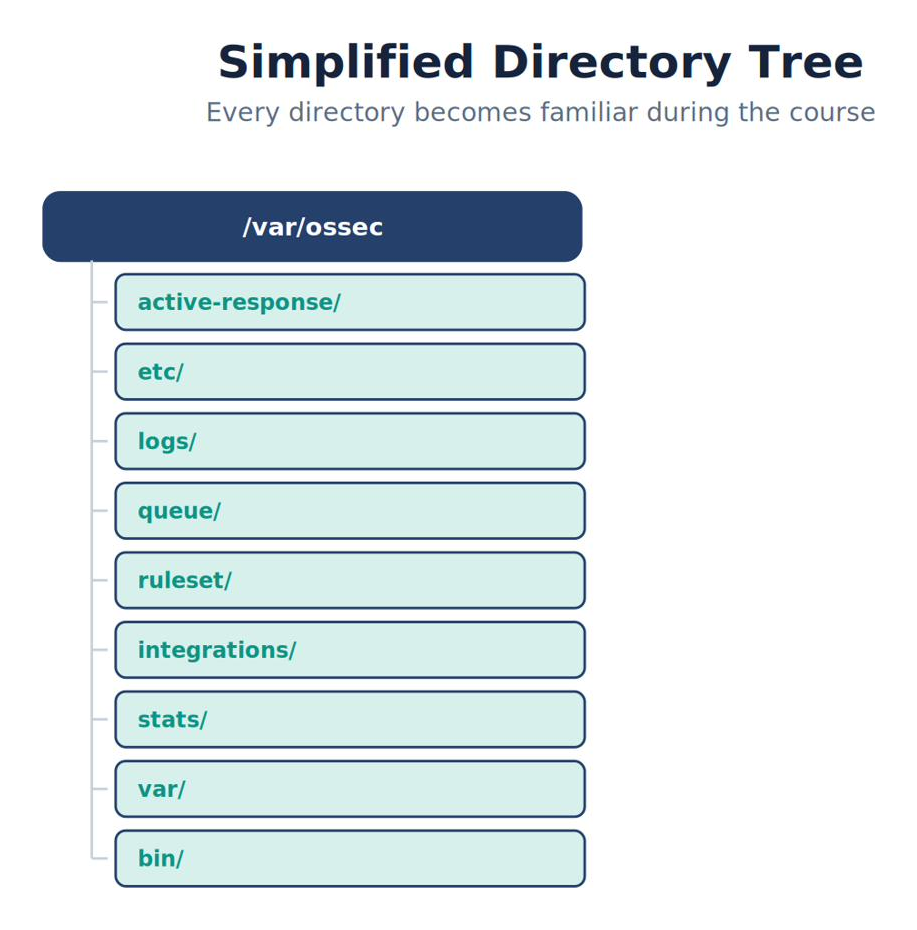
Note. The figure organizes the major elements of simplified Directory Tree to clarify their roles, relationships, and escalation or inheritance paths.
As the semester progresses, every one of these directories will become familiar.
Critical Directories
Only a few directories beneath /var/ossec are used routinely. Each is described below.
/var/ossec/etc
Contains the primary configuration files.
Most importantly:
/var/ossec/etc/ossec.conf
This is the heart of the Wazuh configuration. Later chapters will modify this file many times.
/var/ossec/logs
Contains operational logs.
Examples include:
Manager logs
Alert logs
Archive logs
One of the most important files is:
/var/ossec/logs/ossec.log
When troubleshooting, this is often the first place administrators look.
/var/ossec/ruleset
Contains the default:
Decoders
Rules
Students should avoid modifying vendor-supplied rules directly. Instead, later chapters will demonstrate how to create local custom rules that survive upgrades.
/var/ossec/queue
Contains information exchanged between agents and the Manager. Although students rarely interact directly with this directory, understanding its purpose helps explain how agent communication occurs.
/var/ossec/bin
Contains many administrative utilities.
Examples include:
WAZUH-SRV · Terminal
/var/ossec/bin/manage_agents
/var/ossec/bin/agent_control
/var/ossec/bin/wazuh-control
Several of these utilities will be used throughout the remainder of the course. The manage_agents and agent_control utilities manage agent enrollment and status; their full syntax is documented in Appendix B — Command Reference.
Operational Health Checklist
Before beginning any investigation, verify the following:
| Check | Expected Result |
|---|---|
| Server reachable | Yes |
| Correct hostname | Yes |
| Correct IP address | Yes |
| Manager running | Yes |
| Indexer running | Yes |
| Dashboard running | Yes |
| Disk utilization | < 80% preferred |
| Memory available | Sufficient |
| System time | Correct |
| No major errors in ossec.log | Yes |
This checklist takes less than two minutes to complete but prevents countless hours of troubleshooting later.
Analyst Tradecraft Tip
Trust verified telemetry—not an open Dashboard.
Platform health must be demonstrated from source to search.
Common Student Mistake
Students often restart services immediately after seeing an error. Experienced administrators investigate first.
Before restarting anything, ask:
What changed?
When did the problem begin?
Which service failed?
What do the logs report?
Is the failure reproducible?
Restarting services without understanding the underlying problem may temporarily hide important evidence.
Best Practice
Develop the habit of checking the Wazuh Server before opening the Dashboard. A professional SOC analyst trusts verified telemetry—not assumptions based on a web interface. Operational discipline begins at the server.
Think Like a Cybersecurity Analyst
Imagine arriving Monday morning. The Dashboard loads normally. However, students report no new alerts since Friday afternoon.
Instead of restarting everything, your investigation begins methodically:
Verify Manager status.
Verify Indexer status.
Verify Dashboard status.
Check ossec.log.
Confirm agents are connected.
Generate a known test event.
Trace the telemetry through the pipeline.
This systematic approach reflects the engineering mindset developed throughout the first three chapters.
Looking Ahead
With the Wazuh Server understood, the next section introduces the Wazuh Dashboard from an administrator’s perspective. Rather than focusing on investigations, students will learn how to verify platform health, interpret Dashboard metrics, identify disconnected agents, monitor service status, and establish the operational awareness required before conducting threat investigations. This completes the foundational operational knowledge before students begin installing and validating Ubuntu, Suricata, Windows 11, and Sysmon.
Analyst Checkpoint
AC-03.1 — Ask the Platform if It Is Ready. On WAZUH-SRV, run
systemctl is-active wazuh-manager wazuh-indexer wazuh-dashboard. A healthy all-in-one lab should return three lines readingactive. Any other value is not merely an error message—it identifies which layer of the platform needs attention before an investigation can be trusted.
3.5 The Wazuh Dashboard as an Operational Console
Learning Objectives
After completing this section, you should be able to:
Log into the Wazuh Dashboard.
Describe the major Dashboard components.
Verify overall platform health.
Confirm agent connectivity.
Identify common operational problems.
Establish daily operational awareness before investigating alerts.
Introduction
For most analysts, the Wazuh Dashboard is the first application opened each morning. Although many people think of the Dashboard simply as a place to view alerts, experienced analysts know it serves a much broader purpose. The Dashboard is the operational console of the Security Operations Center.
It answers questions such as:
Are my agents connected?
Is telemetry arriving?
Have alert volumes changed?
Which systems require attention?
Are any sensors offline?
Are security events being processed?
Only after answering these questions does the analyst begin reviewing alerts.
Logging into the Dashboard
After opening your web browser, navigate to the Wazuh Dashboard.
Example:
https://192.168.1.30 or https://WAZUH-SRV
(Use the hostname or IP address assigned to your Wazuh server.)
After authentication, the Dashboard opens to the main landing page. Do not immediately begin clicking alerts. Instead, spend a few moments understanding the operational picture.
The Dashboard Is an Instrument Panel
Imagine entering an aircraft cockpit. A pilot does not immediately take off; the pilot first verifies fuel, instruments, controls, navigation, weather, and communications.
SOC analysts perform a similar preflight check. Before investigating, verify services, agents, telemetry, alerts, and infrastructure health. This routine exposes operational failures before they complicate an investigation.
Figure 3-14
The Dashboard as the SOC Instrument Panel
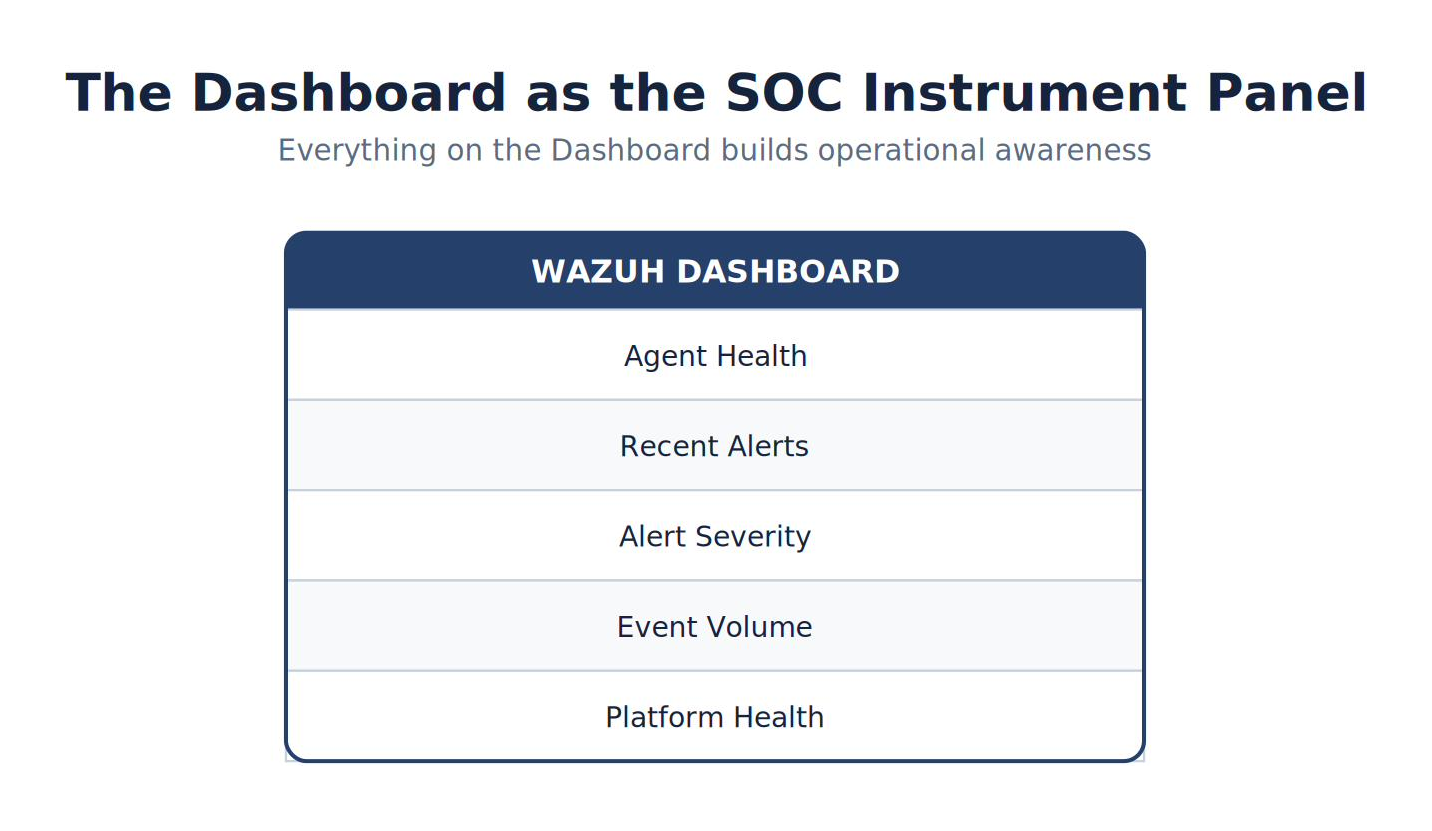
Note. The figure summarizes the Dashboard as the SOC Instrument Panel and highlights the relationships among its principal elements, evidence sources, and analytical outcomes.
Everything on the Dashboard contributes to operational awareness.
First Look: What Should You Check?
Every analyst develops a routine. Throughout this textbook, we will use the following sequence.
Step 1 — Verify Connected Agents
Navigate to → Wazuh Dashboard → Agents management → Summary
Verify:
Every expected endpoint is connected.
Status is Active.
Recent keepalive timestamps are current.
Expected laboratory agents include:
| Host | Agent Name | Expected Status |
|---|---|---|
| WAZUH-SRV | — | Active |
| UB2604 | u2604 | Active |
| WIN11 | win11 | Active |
Disconnected agents should always be investigated before continuing.
Step 2 — Verify Recent Activity
Navigate to → Wazuh Dashboard → Threat hunting
Set the time range to → Last 24 hours
Confirm that events continue arriving.
Questions to ask:
Are new events appearing?
Did events suddenly stop?
Does activity appear normal?
A complete absence of new events is usually more concerning than a high volume of alerts.
Step 3 — Review Alert Severity
Most dashboards display alerts grouped by severity.
Example:
| Severity | Meaning |
|---|---|
| Critical | Immediate attention required |
| High | Significant risk |
| Medium | Suspicious activity |
| Low | Minor concern |
| Informational | Routine activity |
These generic categories map onto Wazuh’s numeric 0–15 rule levels, described in Section 2.5. Students often investigate every alert.
Professional analysts prioritize based on:
Severity
Business impact
Critical assets
Current incidents
Step 4 — Review Agent Health
Questions to ask include:
Which agent disconnected most recently?
Has an agent stopped reporting?
Are multiple agents affected?
Is one operating system reporting fewer events?
Operational changes frequently reveal infrastructure problems before users notice them.
Analyst Tradecraft Tip
Ask what changed.
Good analysts notice change; great analysts investigate it.
Searching the Dashboard
Searching is the single most important Dashboard skill. In Security Events or Threat Hunting, enter a DQL filter such as one of the following:
| Search target | Example | DQL filter |
|---|---|---|
| Windows hostname | WIN11 | data.win.system.computer:"WIN11" |
| Wazuh agent name | UB2604 | agent.name:"UB2604" |
| Wazuh rule ID | 5710 | rule.id:5710 |
| Windows Event ID | 22 | data.win.system.eventID:22 |
| Process image | powershell.exe | data.win.eventdata.image:*powershell.exe |
| Windows event IP address | 192.168.1.40 | data.win.eventdata.ipAddress:"192.168.1.40" |
Field availability depends on the event source and decoder. Open an alert's document details to confirm the populated field before refining a query.
Nearly every investigation begins with one of these searches.
Time Selection
Students often overlook the time selector. This is one of the most important controls in the Dashboard.
Typical selections include:
| Time Range | Usage |
|---|---|
| Last 15 Minutes | Immediate troubleshooting |
| Last Hour | Recent testing |
| Last 24 Hours | Daily review |
| Last 7 Days | Trend analysis |
| Last 30 Days | Historical investigations |
| Custom | Incident response |
When alerts appear missing, the first thing to verify is often the selected time range.
Analyst Tradecraft Tip
Verify the time selector before assuming telemetry is missing.
Many “missing alerts” are outside the selected window.
Common Student Mistake
Students frequently focus only on the left side of the Dashboard.
Professional analysts continuously monitor:
Agent count
Event rate
Alert trends
Time window
Search filters
Active queries
Understanding the entire workspace leads to faster investigations.
Daily Operational Checklist
Before beginning any investigation:
✓ Dashboard loads successfully
✓ All expected agents connected
✓ Recent telemetry visible
✓ Suricata alerts present
✓ Sysmon events present
✓ Windows Defender operational
✓ Event timestamps current
✓ Time selector correct
✓ No unexpected service interruptions
This checklist should become routine.
Figure 3-15
Daily SOC Startup Workflow
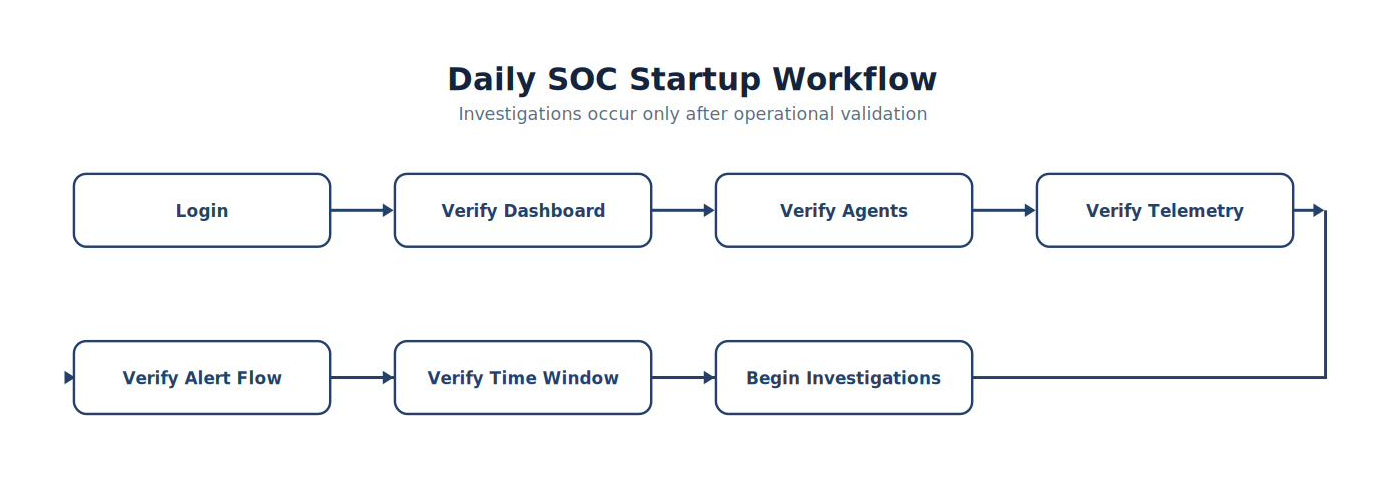
Note. The workflow presents the ordered stages of daily SOC Startup Workflow and highlights the validation and feedback steps that make the process repeatable.
Notice that investigations occur only after operational validation.
Analyst Tradecraft Tip
Zero alerts is not proof of zero threats.
Verify the telemetry path before declaring the environment quiet.
The First-Five-Minute Dashboard Check
The Dashboard should answer three operational questions within the first five minutes of your shift:
Is my SOC healthy?
Is telemetry flowing?
What requires my attention first?
If you cannot answer those questions quickly, either the Dashboard or the workflow needs improvement.
Looking Ahead
The next section begins the first major implementation phase of the textbook: deploying and validating the Ubuntu 26.04 network sensor. Students will configure the operating system, verify networking, install the Wazuh Agent, prepare the dual-interface architecture, and establish the Linux foundation required for Suricata and Emerging Threats Open. From this point forward, each system will be built incrementally, validated thoroughly, and integrated into the complete Security Operations Center.
3.6 Preparing the Ubuntu 26.04 Network Sensor
Learning Objectives
After completing this section, you should be able to:
Explain the role of the Ubuntu sensor within the SOC.
Validate the operating system before installing security software.
Verify hardware resources and network connectivity.
Confirm Linux services required for later chapters.
Document the baseline state of the Ubuntu system.
Introduction
The Ubuntu system occupies a unique position within our Security Operations Center. Unlike the Windows workstation, which primarily generates endpoint telemetry, the Ubuntu system performs two independent roles. First, it operates as a monitored Linux endpoint by running the Wazuh Agent. Second, it serves as a dedicated network intrusion detection sensor running Suricata and the Emerging Threats Open rule set. Because this system becomes responsible for inspecting network traffic, it must be validated carefully before any security software is installed. Professional SOC engineers always establish a known-good operating system baseline before adding monitoring tools.
The Ubuntu Sensor Architecture
Throughout the remainder of this textbook, the Ubuntu virtual machine will serve multiple purposes.
| Function | Description |
|---|---|
| Linux Endpoint | Generates Linux telemetry for Wazuh |
| Suricata Sensor | Inspects network traffic |
| Packet Capture Platform | Used with tcpdump and Wireshark |
| Rule Development Host | Tests custom Suricata signatures |
| Telemetry Forwarder | Sends Suricata alerts to Wazuh |
Unlike many enterprise environments where these functions are distributed across multiple servers, our laboratory intentionally combines them into one system to simplify learning.
Figure 3-16
Ubuntu Sensor Responsibilities
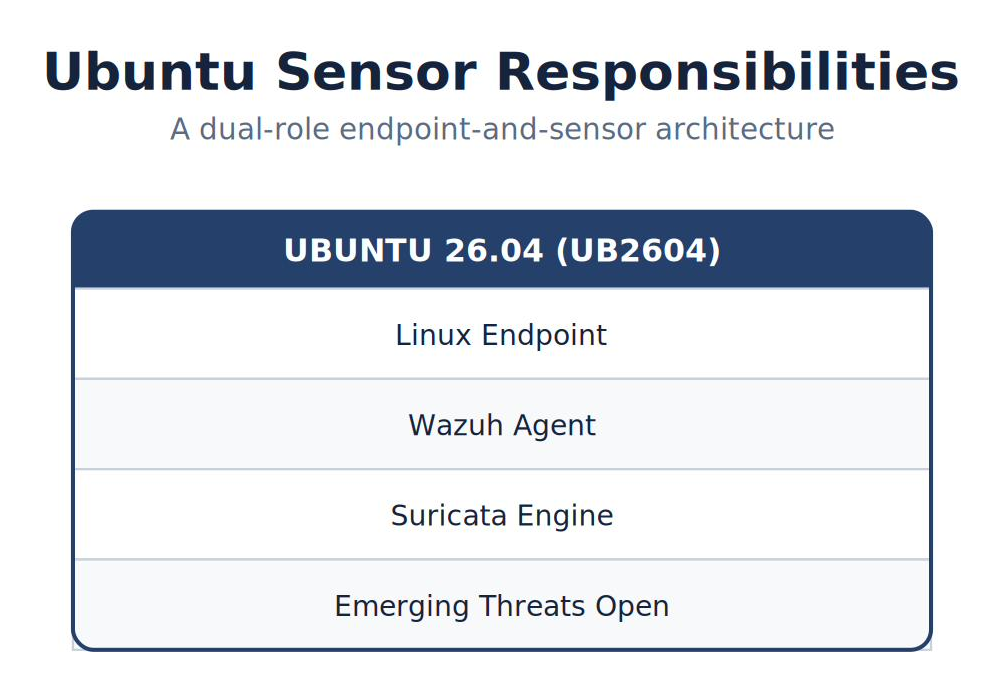
Note. The figure summarizes ubuntu Sensor Responsibilities and highlights the relationships among its principal elements, evidence sources, and analytical outcomes.
This dual-role architecture is one of the defining characteristics of our laboratory.
Before Installing Anything
Students are often eager to install software immediately. Resist that temptation. First, validate the operating system.
Professional engineers verify:
Operating system version
Kernel version
Network interfaces
Hostname
IP addresses
Internet connectivity
Available disk space
Available memory
Time synchronization
Package repositories
Only after these checks succeed should software installation begin.
Verify the Operating System
Confirm the Ubuntu release.
UB2604 · Terminal
cat /etc/os-releaseExpected output should identify Ubuntu 26.04 LTS.
Verify Platform Compatibility
At the time this textbook was written, Wazuh’s officially validated Ubuntu compatibility list topped out at 24.04 LTS. Ubuntu 26.04 is new enough that it may not yet appear on Wazuh’s published compatibility matrix, even though the Wazuh Agent .deb package installs and runs correctly on it in practice because Ubuntu LTS releases are ABI-compatible with the packages Wazuh builds for Debian-based systems.
Before installing, check the current supported operating systems list at the Wazuh installation guide. If your release is not yet listed, that is not necessarily a blocker — it simply means you are ahead of the official validation cycle and should test carefully rather than assume compatibility. This is a useful lesson in itself: production environments are frequently a version or two ahead of a vendor’s formal support matrix, and analysts need to know how to verify compatibility themselves rather than relying solely on a checklist. Next, verify the kernel.
UB2604 · Terminal
uname -rRecord both values in your SOC Engineering Notebook. Version information becomes invaluable during troubleshooting and future upgrades.
Verify Host Identity
Every server should know its own identity. Display the hostname.
hostname
Display the fully qualified hostname if configured.
UB2604 · Terminal
hostnamectlConfirm that the hostname matches your documentation.
Example:
UB2604
Consistency between documentation and configuration prevents confusion later when multiple Linux systems are added.
Verify Network Interfaces
List all network interfaces.
UB2604 · Terminal
ip addror, for a compact one-line-per-interface view:
UB2604 · Terminal
ip -br addrExpected output should identify both interfaces.
Example:
| Interface | Purpose |
|---|---|
| ens160 | Management |
| ens192 | Suricata Monitoring |
Confirm:
Interface names
IPv4 addresses
Interface state
MAC addresses
Document each value.
Verify Routing
Display the routing table.
UB2604 · Terminal
ip routeQuestions to answer:
Which interface provides Internet access?
Which network is the default route?
Is the gateway reachable?
A correct routing table prevents many future troubleshooting problems.
Verify Connectivity
Before installing packages, verify connectivity. Ping the default gateway.
UB2604 · Terminal
ping -c 4 192.168.1.1Ping the Wazuh Server.
UB2604 · Terminal
ping -c 4 192.168.1.30Ping a public IP address.
UB2604 · Terminal
ping -c 4 8.8.8.8Finally, verify DNS.
UB2604 · Terminal
ping -c 4 google.comEach test validates a different part of the network stack.
Analyst Tradecraft Tip
Notice the progression:
Local gateway
Local server
Public IP
DNS hostname
This sequence helps isolate problems.
For example:
If the gateway fails, investigate local networking.
If public IP fails but the gateway succeeds, investigate routing.
If public IP works but DNS fails, investigate name resolution.
Professional troubleshooting isolates one layer at a time.
Verify System Resources
Display memory usage.
UB2604 · Terminal
free -hDisplay processor information.
lscpu
Display filesystem usage.
UB2604 · Terminal
df -hRecord:
Available memory
Number of CPUs
Available disk space
Later chapters compare these values after installing additional software.
Verify Time Synchronization
Time accuracy is essential in a SOC. Display current status.
UB2604 · Terminal
timedatectlVerify:
Correct timezone
NTP synchronized
System clock synchronized
Even small time differences complicate event correlation across systems.
Update the Operating System
Before installing Wazuh or Suricata, ensure the operating system is current.
UB2604 · Terminal
sudo apt update
sudo apt upgrade
After upgrades requiring a reboot:
UB2604 · Terminal
sudo rebootThen repeat the validation checks. Never assume updates completed successfully.
Create the Baseline Snapshot
At this point, the system should contain:
Ubuntu installed
Updates applied
Networking verified
Documentation completed
Create a VMware snapshot.
Suggested name:
Ubuntu 26.04 Clean Baseline
This snapshot becomes your recovery point before installing security software.
Common Student Mistake
Students often install multiple applications before taking a snapshot. If a later installation fails, they must rebuild the entire operating system.
Instead:
Install Ubuntu.
Validate Ubuntu.
Snapshot Ubuntu.
Install Wazuh Agent.
Snapshot again.
Install Suricata.
Snapshot again.
This incremental approach dramatically reduces recovery time.
Analyst Tradecraft Tip
Treat every major installation as a milestone. Create snapshots that correspond to those milestones. Later chapters will reference these snapshots when experimenting with custom rules, Active Response, and advanced Suricata configurations.
Ubuntu Baseline Validation Checklist
Complete the following before continuing.
| Validation | Expected Result |
|---|---|
| Ubuntu 26.04 installed | ✓ |
| Hostname configured | ✓ |
| ens160 operational | ✓ |
| ens192 operational | ✓ |
| Internet connectivity verified | ✓ |
| Wazuh Server reachable | ✓ |
| DNS functioning | ✓ |
| System updated | ✓ |
| Time synchronized | ✓ |
| Baseline snapshot created | ✓ |
Do not proceed until every item is complete.
Think Like a Cybersecurity Analyst
Imagine installing Suricata before verifying the operating system. Later, Suricata fails to download rule updates.
Is the problem:
Suricata?
DNS?
Routing?
Internet connectivity?
Package repositories?
Because the baseline was never validated, every possibility remains open. Professional engineers eliminate uncertainty before introducing complexity.
Looking Ahead
The next section begins the installation of the Wazuh Agent on Ubuntu. Students will learn how the agent communicates with the Wazuh Manager, how to register and validate the agent, interpret agent status, troubleshoot connectivity issues, and verify that Linux telemetry successfully reaches the Wazuh Dashboard. This establishes the first operational telemetry pipeline in the laboratory before Suricata is introduced (Open Information Security Foundation, n.d.).
3.7 Installing and Validating the Wazuh Agent on Ubuntu 26.04
Learning Objectives
After completing this section, you should be able to:
Explain the purpose of the Wazuh Agent.
Install the Wazuh Agent on Ubuntu 26.04.
Register the agent with the Wazuh Manager.
Verify secure communication between the agent and the Manager.
Confirm Linux telemetry is visible within the Wazuh Dashboard.
Troubleshoot common agent connectivity problems.
Introduction
The Wazuh Agent is the primary mechanism through which Linux systems communicate with the Wazuh Manager (Wazuh, Inc., n.d.-a). Think of the Agent as the Ubuntu system’s ambassador to the Security Operations Center.
Its responsibilities include:
Collecting Linux telemetry
Monitoring log files
Reporting security events
Performing file integrity monitoring
Executing active response actions (when configured)
Maintaining secure communication with the Manager
Without the Wazuh Agent, Ubuntu becomes invisible to the SOC.
How the Agent Fits into the SOC
Before installing anything, understand the communication flow.
Figure 3-17
Ubuntu Agent Communication
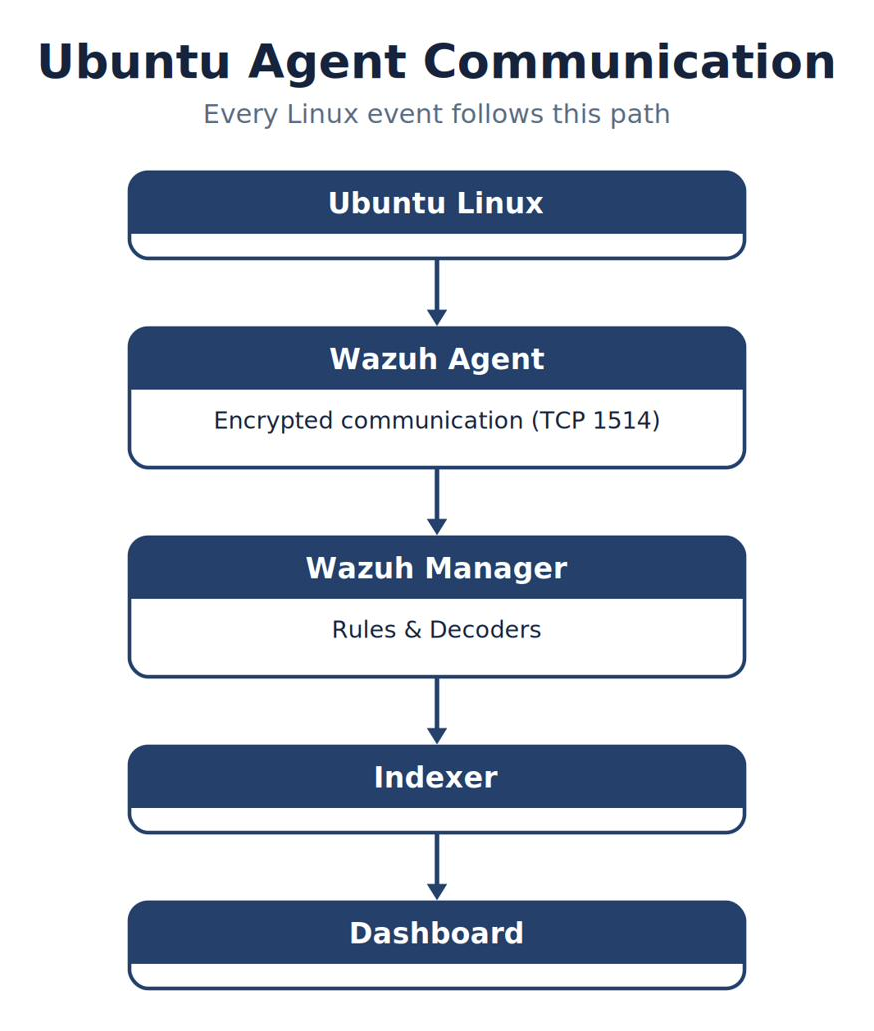
Note. The figure summarizes ubuntu Agent Communication and highlights the relationships among its principal elements, evidence sources, and analytical outcomes.
Every Linux event follows this path.
Installation Philosophy
Throughout this textbook we follow a disciplined workflow. Each installation consists of five stages.
Figure 3-18
From Install to Document
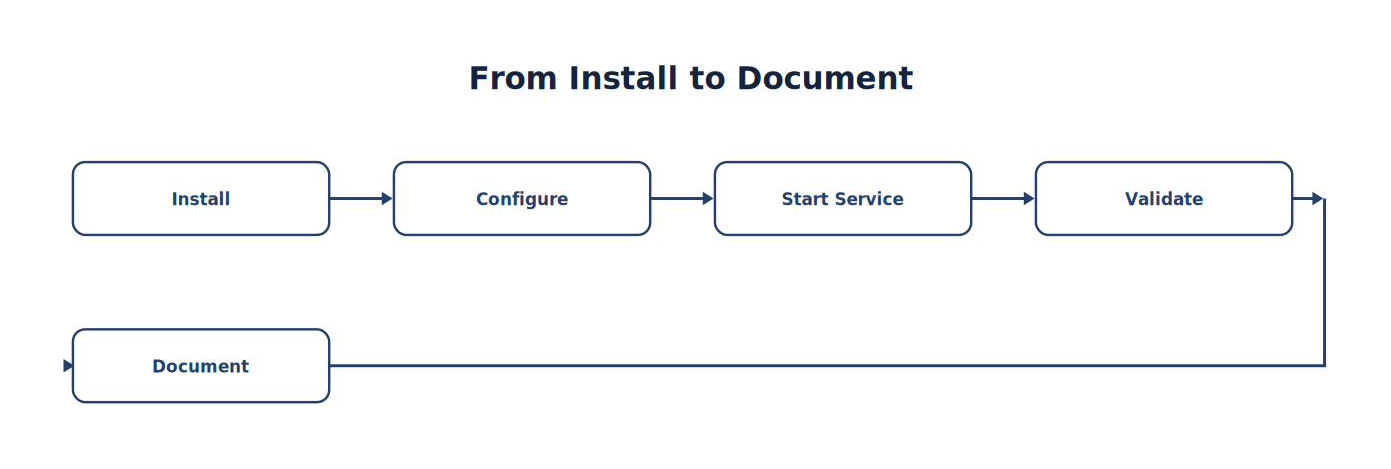
Note. The sequence traces how Install progresses to Document, emphasizing the intermediate evidence and processing steps.
Notice that installation represents only one step. Validation is equally important.
Installing the Agent
Install the Wazuh Agent using the official repository.
(The exact commands are provided in Lab Exercise 3.1 and should always follow the current Wazuh documentation for your installed version.)
After installation completes, verify the package.
UB2604 · Terminal
dpkg -l | grep wazuhExpected output should identify:
wazuh-agent
Record the installed version in your SOC Engineering Notebook.
Verify the Service
Confirm the service exists.
UB2604 · Terminal
sudo systemctl status wazuh-agentExpected:
Active: active (running)
If the service is inactive, do not continue. Investigate the problem first.
Enable Automatic Startup
The agent should start automatically after every reboot.
Verify:
UB2604 · Terminal
sudo systemctl is-enabled wazuh-agentExpected output:
UB2604 · Expected output
enabledIf necessary:
UB2604 · Terminal
sudo systemctl enable wazuh-agentVerify Network Connectivity
Before assuming the agent has failed, verify communication with the Wazuh Manager.
Example:
UB2604 · Terminal
ping WAZUH-SRVNext, verify that the Manager port is reachable.
nc -vz 192.168.1.30 1514
Expected:
Connection succeeded
This confirms basic network communication.
Analyst Tradecraft Tip
Many students immediately reinstall the Wazuh Agent when it fails to connect. Experienced administrators verify the network first.
Ask yourself:
Can I reach the Manager?
Is the Manager running?
Is TCP 1514 open?
Is DNS working?
Is the correct Manager IP configured?
Software is often blamed for networking problems. In reality, networking problems are usually the cause.
Verify Agent Registration
Log into the Wazuh Dashboard.
Navigate to → Wazuh Dashboard → Agents management → Summary
The Ubuntu system should appear.
Example:
| Host (Agent Name) | Status |
|---|---|
| UB2604 (u2604) | Active |
Agent Names vs. Hostnames. The hostname (UB2604) identifies the machine; the agent name (u2604) is the identity assigned to the Wazuh Agent at enrollment. In this laboratory, agent names are lowercase by convention (u2604, win11). Because Dashboard queries are case-sensitive, agent.name:“u2604” returns events while agent.name:“U2604” returns nothing. Record both values in your SOC Engineering Notebook. If the agent does not appear, do not continue. Investigate before installing Suricata.
Validate Telemetry
Simply appearing in the Dashboard is not sufficient. Generate Linux activity.
Example:
logger “Ubuntu agent validation test”
This creates a message in the Linux system log. Within a few moments, search the Dashboard.
Example search:
u2604
Locate the generated event.
This confirms:
Linux generated telemetry.
Agent collected telemetry.
Manager received telemetry.
Indexer stored telemetry.
Dashboard displayed telemetry.
Congratulations. Your first telemetry pipeline is operational.
Figure 3-19
Telemetry Validation
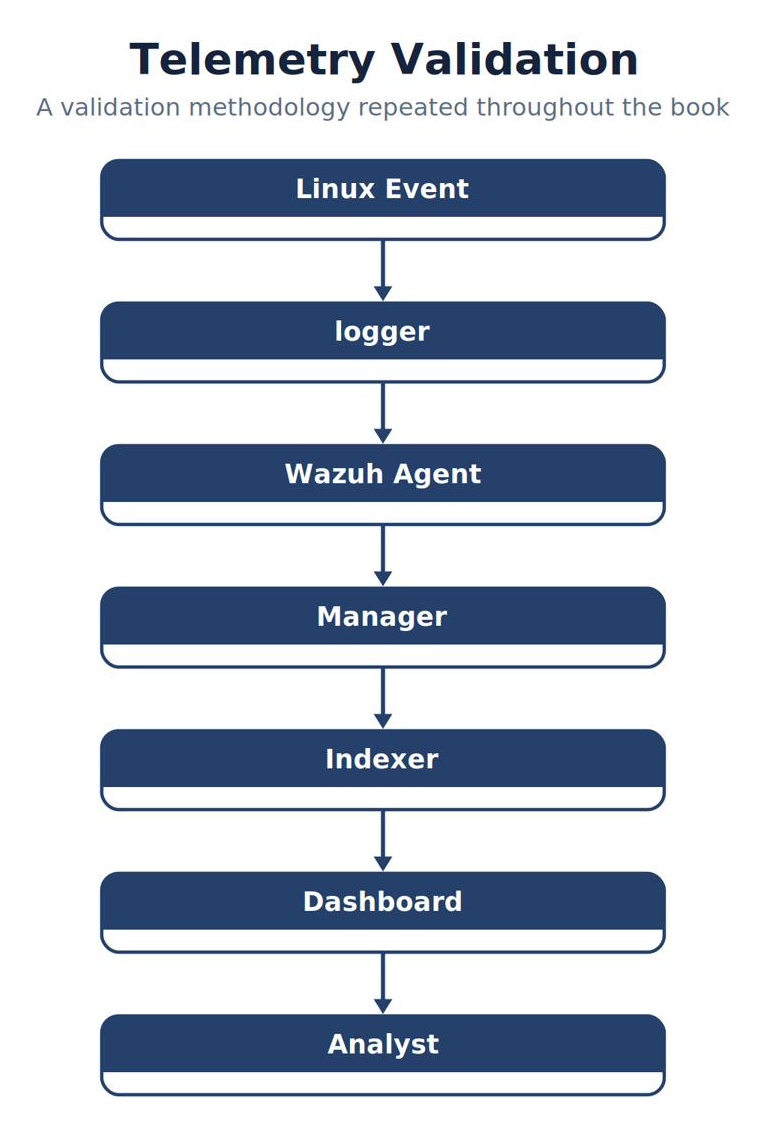
Note. The figure summarizes telemetry Validation and highlights the relationships among its principal elements, evidence sources, and analytical outcomes.
This validation methodology will be repeated throughout the textbook.
Verify Log Collection
Linux system logs are stored in several locations depending on the distribution.
Common examples include:
/var/log/syslog /var/log/auth.log /var/log/kern.log /var/log/dpkg.log
Students should become familiar with these files because later chapters will monitor them using the Wazuh Agent.
Common Agent Commands
| Command | Purpose |
|---|---|
sudo systemctl status wazuh-agent |
Show detailed runtime status and recent service messages. |
sudo systemctl is-active wazuh-agent |
Return only the current runtime state, such as active or inactive. |
sudo systemctl restart wazuh-agent |
Stop and immediately start the agent so configuration changes load. |
sudo systemctl enable wazuh-agent |
Configure the agent to start automatically at boot; it does not start the service immediately. |
sudo systemctl disable wazuh-agent |
Remove automatic startup at boot; it does not stop a currently running service. |
sudo journalctl -u wazuh-agent |
Review systemd journal entries for the agent service. |
hostname |
Verify the hostname. |
hostname -I |
Display the host's assigned IP addresses. |
These commands will become part of your routine operational toolkit.
Reading the Agent Log
The agent maintains its own operational log.
Example:
/var/ossec/logs/ossec.log
When troubleshooting, look for:
Connection failures
Authentication problems
Registration errors
Communication timeouts
Configuration issues
Develop the habit of reading logs before changing configurations.
Common Student Mistake
Students often stop troubleshooting once the agent appears in the Dashboard. However, an agent may be connected without forwarding meaningful telemetry.
Always verify:
Events are arriving.
Current timestamps are visible.
Searches return expected results.
Generated test events appear.
Connectivity alone does not prove functionality.
Analyst Tradecraft Tip
Every time you install a new agent, generate a known test event immediately. Never wait until weeks later to discover the telemetry pipeline was incomplete. Testing immediately after installation saves enormous amounts of troubleshooting time.
Baseline Validation Checklist
Before proceeding, confirm:
| Validation | Expected |
|---|---|
| Wazuh Agent installed | ✓ |
| Service running | ✓ |
| Starts automatically | ✓ |
| Manager reachable | ✓ |
| Agent registered | ✓ |
| Dashboard displays agent | ✓ |
| Test event generated | ✓ |
| Test event visible | ✓ |
| Documentation updated | ✓ |
Do not continue until every validation succeeds.
Analyst Tradecraft Tip
Imagine arriving Monday morning. The Ubuntu Agent appears Active. However, new Linux events stopped arriving six hours ago.
Would you conclude:
“The Agent is healthy.”
Or would you investigate:
Agent logs
Network connectivity
Queue status
Service restarts
Disk space
System time
Log collection configuration
Professional analysts recognize that an active agent is only the beginning. Healthy telemetry—not merely connectivity—is the true indicator of a functioning monitoring system.
Looking Ahead
With Ubuntu successfully reporting telemetry to the Wazuh Manager, the next section introduces Suricata, the network intrusion detection system that transforms the Ubuntu host from a monitored endpoint into a dedicated network sensor. Students will install Suricata, understand its packet-processing architecture, configure the monitoring interface, integrate the Emerging Threats Open rule set, and validate the first network-based detections flowing into the Wazuh Dashboard. This marks the transition from endpoint monitoring to full network security monitoring within the SOC laboratory.
3.8 Understanding Suricata — The Network Detection Engine
Learning Objectives
After completing this section, you should be able to:
Explain the purpose of a Network Intrusion Detection System (NIDS).
Describe how Suricata processes network traffic.
Understand the Suricata packet-processing pipeline.
Differentiate between packet capture, protocol decoding, and rule evaluation.
Identify the major Suricata components.
Explain how Suricata integrates with Wazuh.
Introduction
Until now, every security event in our laboratory has originated from an endpoint.
For example:
Windows generated Sysmon events.
Ubuntu generated Linux logs.
Windows Defender generated malware alerts.
These events describe what occurred on individual computers.
But what about the network itself?
Attackers do not interact directly with operating systems. They communicate across networks.
Every:
DNS query
HTTP request
TLS session
SSH connection
Port scan
File download
must traverse the network before reaching its destination. If we can observe that traffic, we gain another powerful source of evidence. This is precisely the role of Suricata.
What Is Suricata?
Suricata is an open-source Network Intrusion Detection System (NIDS) and Network Intrusion Prevention System (NIPS) developed by the Open Information Security Foundation (OISF) (Open Information Security Foundation, n.d.). Unlike endpoint software that observes activity occurring on a single computer, Suricata examines packets moving across the network. Think of Sysmon as observing inside the computer. Think of Suricata as observing between computers. Together they provide complementary visibility.
Figure 3-20
Endpoint vs. Network Visibility
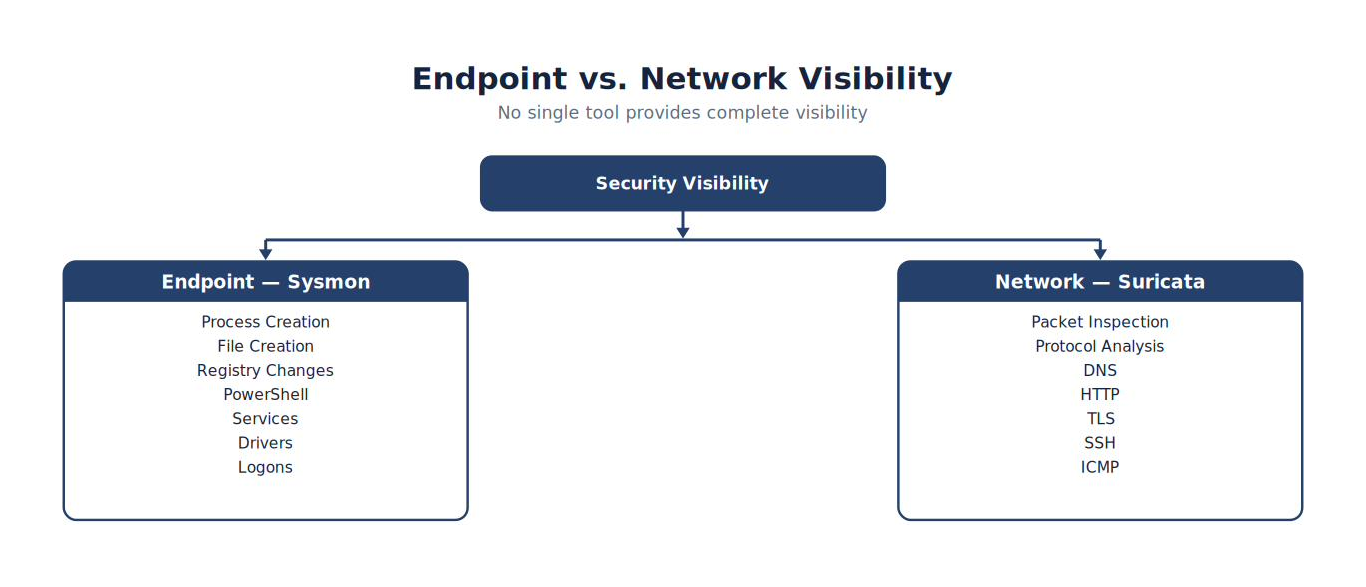
Note. The comparison highlights the operational differences represented by endpoint vs. Network Visibility and shows why the distinction matters during analysis.
No single tool provides complete visibility. SOC analysts combine endpoint and network telemetry to develop a comprehensive understanding of events.
Why Monitor the Network?
Imagine malware successfully deletes itself after execution. Endpoint evidence may disappear. However, the network communication that occurred during the attack may still exist.
Suricata can observe:
Command-and-control traffic
Malware downloads
Data exfiltration
DNS tunneling
Port scanning
Protocol abuse
Exploit attempts
Web attacks
The network often preserves evidence that endpoints cannot.
The Packet Journey
Every packet follows a predictable path through Suricata. Understanding this pipeline is essential.
Figure 3-21
Suricata Processing Pipeline
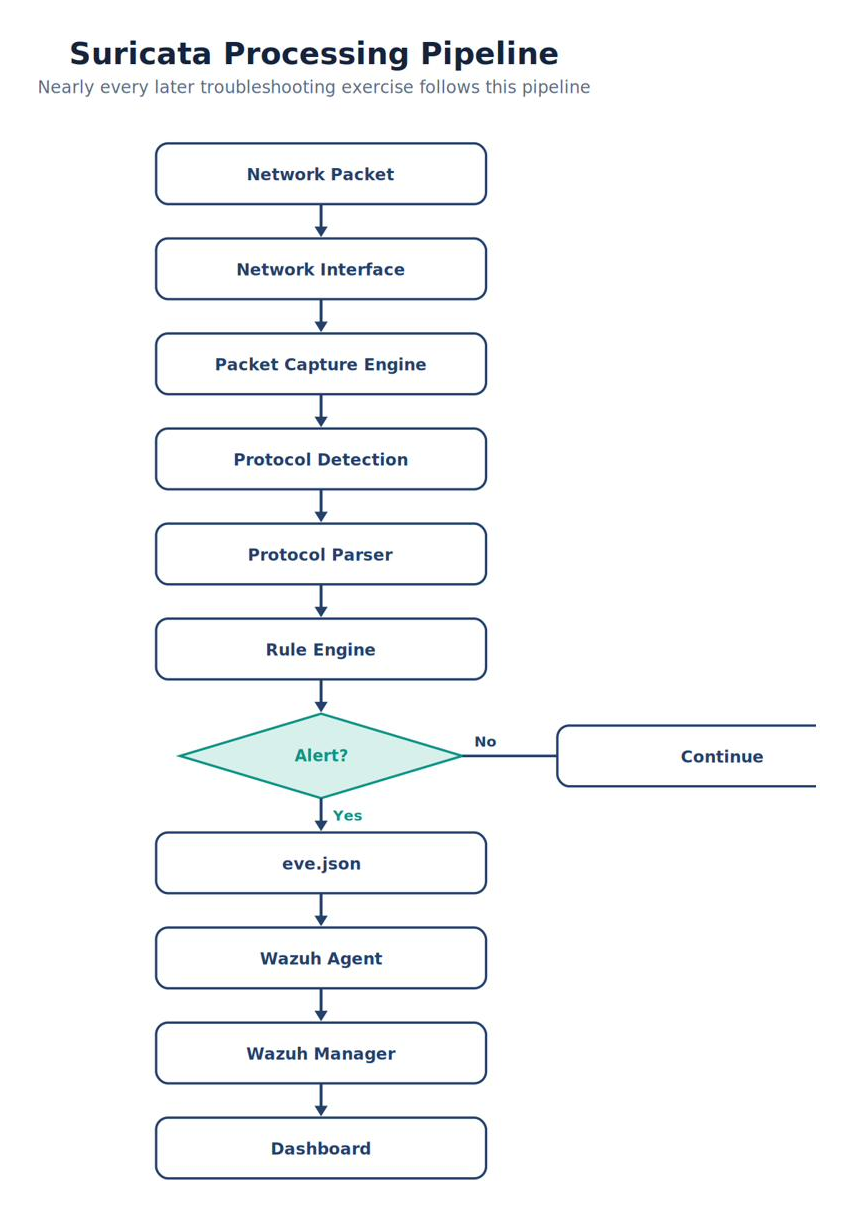
Note. The pipeline shows how information moves through suricata Processing Pipeline, from its source through processing to the analyst-visible result.
Nearly every troubleshooting exercise later in this textbook follows this exact pipeline.
Step 1 — Packet Capture
Suricata begins by capturing packets from a network interface.
Examples include:
ens160 ens192
In our laboratory, Suricata monitors:
ens192
This interface has been dedicated to network monitoring. If packets never reach this interface, Suricata cannot detect anything.
Step 2 — Flow Tracking
Individual packets rarely tell the complete story. Suricata groups related packets into flows.
Example:
Figure 3-22
From Client to HTTP Response
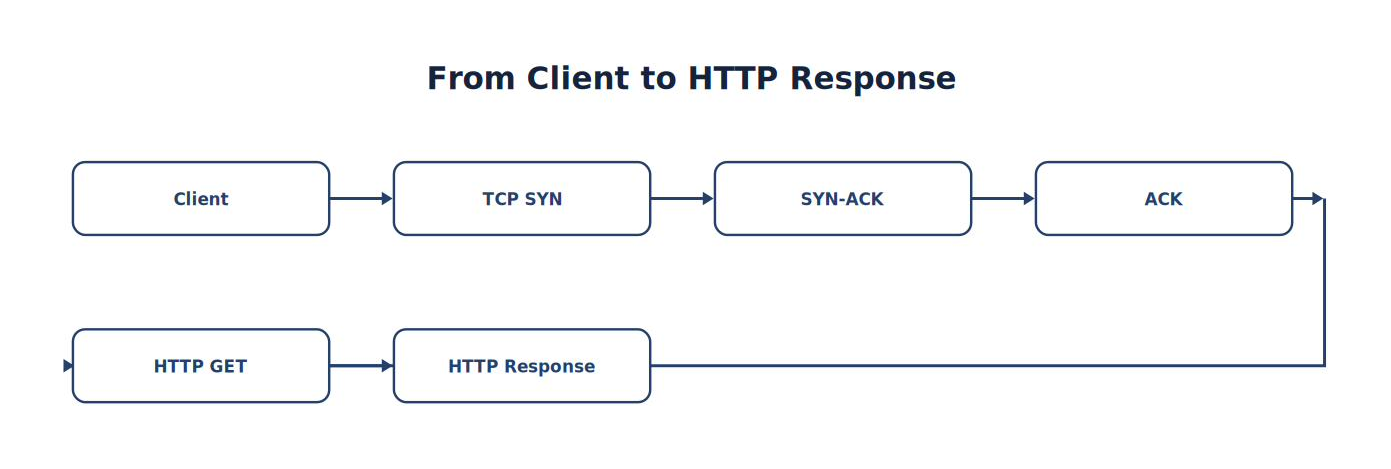
Note. The sequence traces how Client progresses to HTTP Response, emphasizing the intermediate evidence and processing steps.
Instead of evaluating isolated packets, Suricata evaluates complete conversations.
Step 3 — Protocol Identification
Once packets are grouped into flows, Suricata determines the protocol.
Examples include:
HTTP
HTTPS
DNS
SSH
FTP
SMTP
SMB
TLS
ICMP
Suricata identifies protocols using protocol detection rather than relying exclusively on port numbers. This improves detection accuracy.
Step 4 — Protocol Parsing
After identifying the protocol, Suricata extracts useful information.
For example:
HTTP: URI, User-Agent, Method, Host header
DNS: Query name, Record type, Response code
TLS: Server name, JA3 fingerprint, Certificate information
This metadata becomes extremely valuable during investigations.
Step 5 — Rule Evaluation
Finally, Suricata compares packet contents against thousands of detection signatures.
Examples include:
Malware traffic
Port scans
Exploit kits
Web attacks
Command-and-control
Policy violations
Suspicious downloads
If a rule matches, Suricata generates an alert.
Analyst Tradecraft Tip
Suricata evaluates packets; rules define what deserves attention.
Better detection often begins with better rules.
The Suricata Output
Most important information is written to a single file.
/var/log/suricata/eve.jsonThroughout this textbook, this file becomes one of our most important data sources. Unlike traditional log files, eve.json contains structured JSON records.
Each record describes the timestamp, source IP, destination IP, ports, protocol, signature, severity, and metadata.
The Wazuh Agent monitors this file continuously.
Figure 3-23
Suricata to Wazuh
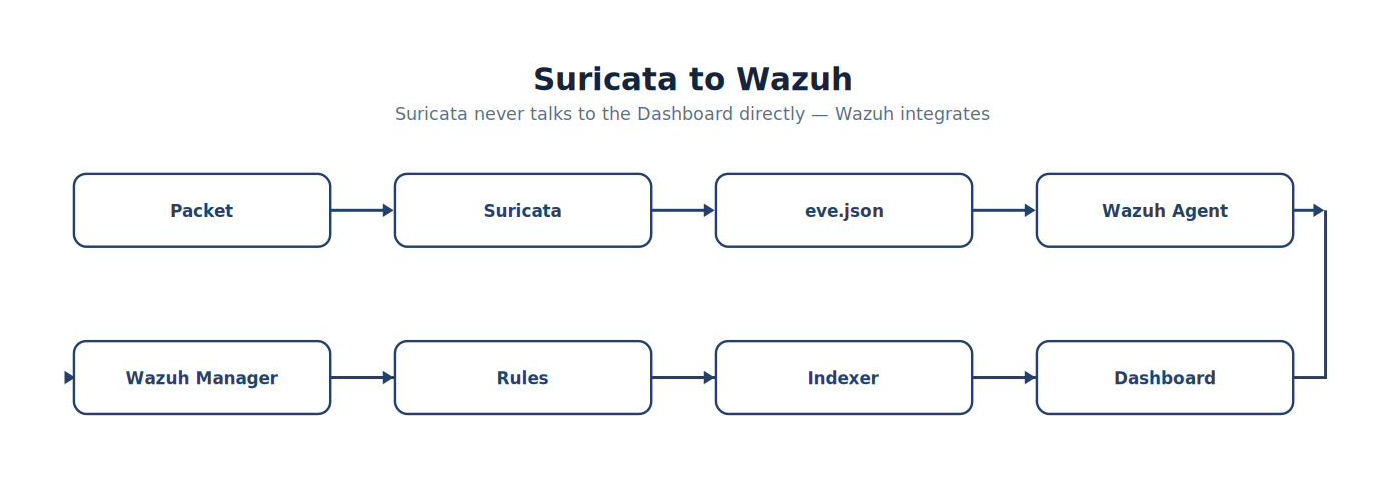
Note. The figure summarizes suricata to Wazuh and highlights the relationships among its principal elements, evidence sources, and analytical outcomes.
Notice that Suricata never communicates directly with the Dashboard. Wazuh serves as the integration platform (Wazuh, Inc., n.d.-a).
Detection Versus Prevention
Suricata can operate in different modes.
| Mode | Description |
|---|---|
| IDS (Intrusion Detection System) | Detects and logs suspicious activity without modifying traffic. |
| IPS (Intrusion Prevention System) | Detects and actively blocks or drops malicious traffic when deployed inline. |
Throughout this textbook we operate Suricata in IDS mode.
Why?
Because students should first learn to observe, validate, and investigate traffic before introducing automated blocking. Understanding what is happening on the network is a prerequisite to deciding what should be blocked.
Common Student Mistake
Students often assume that:
“Suricata is running, therefore it must be inspecting packets.” Not necessarily.
Verify:
Correct interface selected?
Interface is up?
Traffic reaches the interface?
Packet counters increasing?
Rules loaded successfully?
eve.json updating?
A running process is not proof of a functioning sensor.
Best Practice
When troubleshooting Suricata, validate one stage at a time:
Packet reaches the interface.
Interface captures the packet.
Suricata processes the packet.
Rules evaluate the packet.
Alert is written to eve.json.
Wazuh Agent forwards the alert.
Wazuh Dashboard displays the alert.
Breaking the pipeline into stages isolates problems quickly and prevents unnecessary configuration changes.
Analyst Tradecraft Tip
Suppose a student reports: “Suricata didn’t detect my Nmap scan.”
Before changing rules, ask:
Did the scan actually generate packets?
Were the packets visible on ens192?
Did tcpdump observe them?
Were the appropriate ET Open rules loaded?
Was an alert written to eve.json?
Did Wazuh receive the alert?
The objective is not to guess—it is to trace the packet through the entire detection pipeline.
Looking Ahead
With the Suricata architecture understood, the next section begins the actual deployment. Students will install Suricata on Ubuntu 26.04, verify package integrity, understand the directory structure, examine the default configuration, identify critical files, and prepare the sensor for integration with the Emerging Threats Open rule set. This installation will build directly upon the validation methodology established throughout the previous chapters, ensuring that every configuration step is immediately tested before moving forward.
3.9 Installing Suricata on Ubuntu 26.04
Learning Objectives
After completing this section, you should be able to:
Install Suricata on Ubuntu 26.04.
Verify the installed version.
Understand the Suricata directory structure.
Locate critical configuration files.
Validate that Suricata is operational.
Troubleshoot common installation problems.
Introduction
Suricata is one of the world’s most widely deployed open-source Network Intrusion Detection Systems (NIDS). Unlike endpoint monitoring tools such as Sysmon, which observe activity occurring inside a computer, Suricata analyzes packets traveling between computers. Once integrated with Wazuh, Suricata becomes the laboratory’s primary source of network-based security telemetry. The goal of this section is not simply to install software—it is to establish a validated network sensor capable of reliably inspecting traffic.
Installation Workflow
Throughout this textbook, every software installation follows the same engineering process.
Figure 3-24
Software Deployment Lifecycle

Note. The workflow presents the ordered stages of software Deployment Lifecycle and highlights the validation and feedback steps that make the process repeatable.
Never skip the validation stage. A successful installation command does not guarantee a functional sensor.
Installing Suricata
Install Suricata using the official Ubuntu repositories or the approved package source for the version used in this course. After installation completes, verify the package.
UB2604 · Terminal
dpkg -l | grep suricataExpected output:
suricata
Next, verify the version.
UB2604 · Terminal
suricata --build-infoRecord the following information in your SOC Engineering Notebook:
Suricata version
Build date
Enabled features
Capture methods
Rule engine version
This information becomes important during troubleshooting and future upgrades.
Verify the Service
Check that the service exists.
UB2604 · Terminal
sudo systemctl status suricataExpected:
Active: active (running)
If the service is inactive, do not proceed. Investigate before continuing.
Enable Automatic Startup
Confirm Suricata starts after every reboot.
UB2604 · Terminal
sudo systemctl is-enabled suricataExpected:
enabled
If necessary:
UB2604 · Terminal
sudo systemctl enable suricataUnderstanding the Directory Structure
Suricata stores configuration, rules, logs, and runtime files in several locations. Students should become familiar with these directories immediately.
| Directory | Purpose |
|---|---|
| /etc/suricata/ | Primary configuration directory |
| /etc/suricata/suricata.yaml | Main configuration file |
| /etc/suricata/rules/ | Detection rules |
| /var/log/suricata/ | Log files |
| /var/log/suricata/eve.json | JSON event log |
| /var/lib/suricata/ | Runtime data |
| /usr/bin/suricata | Executable program |
Nearly every configuration change performed throughout this textbook will involve one of these locations.
Figure 3-25
Suricata Directory Tree
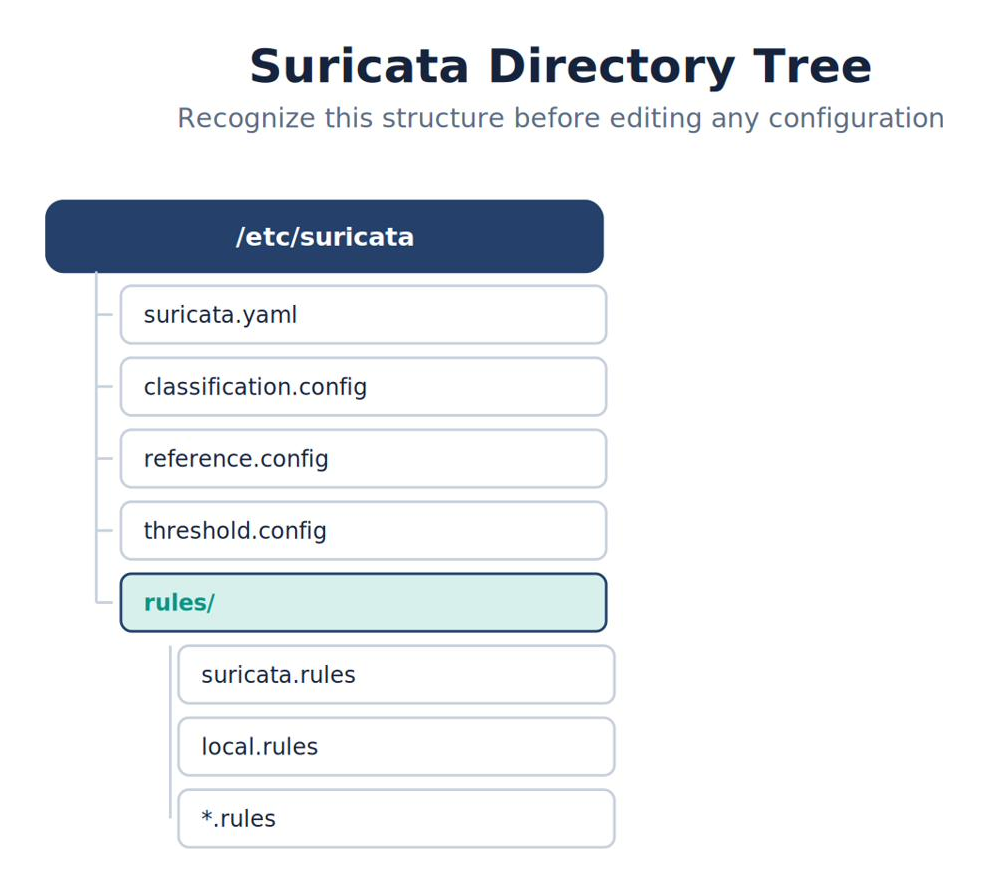
Note. The figure organizes the major elements of suricata Directory Tree to clarify their roles, relationships, and escalation or inheritance paths.
Students should recognize this structure before editing any configuration files.
The Main Configuration File
The heart of Suricata is:
/etc/suricata/suricata.yaml
This file controls nearly every aspect of the IDS.
Examples include:
Network interfaces
HOME_NET
EXTERNAL_NET
Logging
Rule paths
Packet capture
Output configuration
Performance tuning
Two variables in this file deserve special attention. HOME_NET defines the IP ranges Suricata treats as your protected internal network (in this laboratory, 192.168.1.0/24), while EXTERNAL_NET defines everything else. Many detection rules only fire when traffic crosses between these two — for example, a scan is only interesting if it targets HOME_NET. A misconfigured HOME_NET is one of the most common reasons a correctly installed sensor generates no alerts. Throughout the semester this file will be modified repeatedly. Professional administrators always create backups before editing it.
Analyst Tradecraft Tip
Never make a major configuration change without a recovery path. Back up the known-good file first, change one variable, validate it, and preserve the evidence needed to reverse the change.
Back Up the Suricata Configuration
UB2604 · Terminal
sudo cp /etc/suricata/suricata.yaml /etc/suricata/suricata.yaml.bakIf a configuration mistake occurs, the .bak file provides a known-good recovery point.
Validating the Configuration
Before starting Suricata, validate the configuration syntax.
UB2604 · Terminal
sudo suricata -T -c /etc/suricata/suricata.yamlExpected output ends with something similar to:
Configuration provided was successfully loaded.
or
Suricata configuration test passed. If errors appear, correct them before continuing. Never ignore configuration test failures.
Starting the Sensor
Restart the service after validation.
UB2604 · Terminal
sudo systemctl restart suricataConfirm:
UB2604 · Terminal
sudo systemctl status suricataThe service should remain active. If it exits immediately, review the logs.
Reviewing the Logs
Primary log location:
/var/log/suricata/
Common files include:
| File | Purpose |
|---|---|
| suricata.log | Operational log |
| eve.json | Alerts and events |
| fast.log | Simplified alert output (if enabled) |
| stats.log | Runtime statistics |
During troubleshooting, suricata.log is usually the first file to examine.
Validate Packet Processing
At this point, the service is running.
But is it actually inspecting packets?
Generate simple network activity.
Generate traffic with one of the following commands:
ping 8.8.8.8
curl https://example.com
Then query Suricata's performance counters:
sudo suricatasc -c dump-countersCommand breakdown:
| Part | Purpose |
|---|---|
sudo |
Runs the socket-control request with the privileges required to access Suricata's command socket. |
suricatasc |
Opens the Suricata socket-control client. |
-c |
Sends one command non-interactively and returns its result. |
dump-counters |
Returns the running engine's performance counters so you can confirm packet activity. |
Run the query before and after generating traffic. Increasing packet counters confirm that traffic is flowing through the engine.
Validate the Output File
Confirm that the primary event file exists.
UB2604 · Terminal
ls -lh /var/log/suricata/eve.jsonWatch the file update in real time.
UB2604 · Terminal
sudo tail -f /var/log/suricata/eve.jsonGenerate additional network traffic. If new JSON records appear, Suricata is successfully processing events.
Figure 3-26
Initial Validation
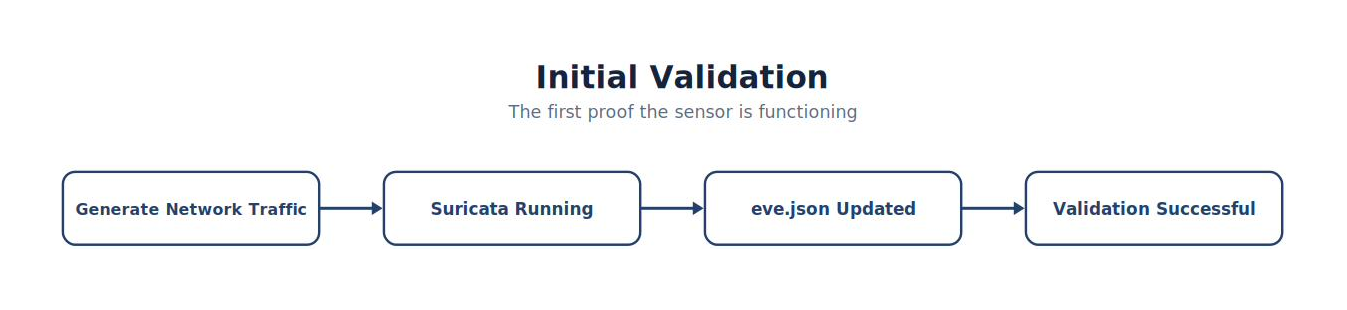
Note. The figure summarizes initial Validation and highlights the relationships among its principal elements, evidence sources, and analytical outcomes.
This is the first proof that the sensor is functioning correctly.
Common Student Mistake
Students often verify only that:
UB2604 · Terminal
systemctl status suricataExpected result: The service status includes active (running).
They never confirm:
Packets are captured.
Rules loaded.
eve.json exists.
Events are written.
A running process without telemetry provides no security value.
Best Practice
After every configuration change, follow this sequence:
Test the configuration: sudo suricata -T -c /etc/suricata/suricata.yaml
Restart the service: sudo systemctl restart suricata
Check service status: sudo systemctl status suricata
Review suricata.log for errors.
Generate test traffic.
Confirm eve.json updates.
Following this sequence prevents many configuration errors.
Baseline Validation Checklist
Before continuing, verify:
| Validation | Expected |
|---|---|
| Suricata installed | ✓ |
| Correct version verified | ✓ |
| Configuration tested | ✓ |
| Service running | ✓ |
| Starts automatically | ✓ |
| eve.json exists | ✓ |
| suricata.log present | ✓ |
| Network traffic generated | ✓ |
| New events written | ✓ |
| Snapshot created | ✓ |
Do not proceed until every item has been verified.
Think Like a Cybersecurity Analyst
Suppose a student reports: “Suricata installed successfully.”
Ask:
How do you know?
Did the configuration pass validation?
Did packets reach the monitoring interface?
Did eve.json update?
Did you inspect suricata.log?
Can you prove the sensor processed live traffic?
In professional SOC operations, evidence is the definition of success.
Looking Ahead
With Suricata operational, the next section introduces the Emerging Threats Open (ET Open) rule set. Students will learn how Suricata’s detection engine relies on signatures, how ET Open is organized, how to update and manage rules safely, how to distinguish vendor rules from local custom rules, and how to validate that newly installed signatures generate alerts during controlled laboratory exercises. This completes the network detection foundation before integrating Suricata telemetry into the Wazuh Dashboard.
3.10 Emerging Threats Open — The Intelligence Behind Suricata
Learning Objectives
After completing this section, you should be able to:
Explain the purpose of intrusion detection signatures.
Describe the Emerging Threats Open (ET Open) project.
Understand how Suricata uses detection rules.
Identify the ET Open rule directory.
Update and validate ET Open signatures.
Differentiate vendor rules from locally developed rules.
Introduction
Installing Suricata provides a powerful packet inspection engine (Open Information Security Foundation, n.d.). However, an inspection engine without detection rules is much like a spell checker without a dictionary. It can process information. It cannot determine what is important. The intelligence behind Suricata comes from its rule sets. Throughout this textbook we use Emerging Threats Open (ET Open), one of the most widely deployed community-maintained intrusion detection rule sets in the cybersecurity industry. Every time Suricata generates an alert in our laboratory, one of these signatures made the detection possible (Proofpoint, n.d.).
What Is Emerging Threats Open?
Emerging Threats Open (ET Open) is a continuously updated collection of Suricata-compatible detection signatures maintained by the cybersecurity community and supported by Proofpoint (Proofpoint, n.d.).
The project provides thousands of rules designed to identify:
Malware communication
Command-and-control traffic
Port scanning
Web attacks
DNS abuse
Policy violations
Exploit attempts
Botnet activity
Protocol anomalies
Reconnaissance
Unlike commercial rule subscriptions, ET Open is freely available and ideally suited for education, research, and many production environments.
Figure 3-27
Detection Pipeline
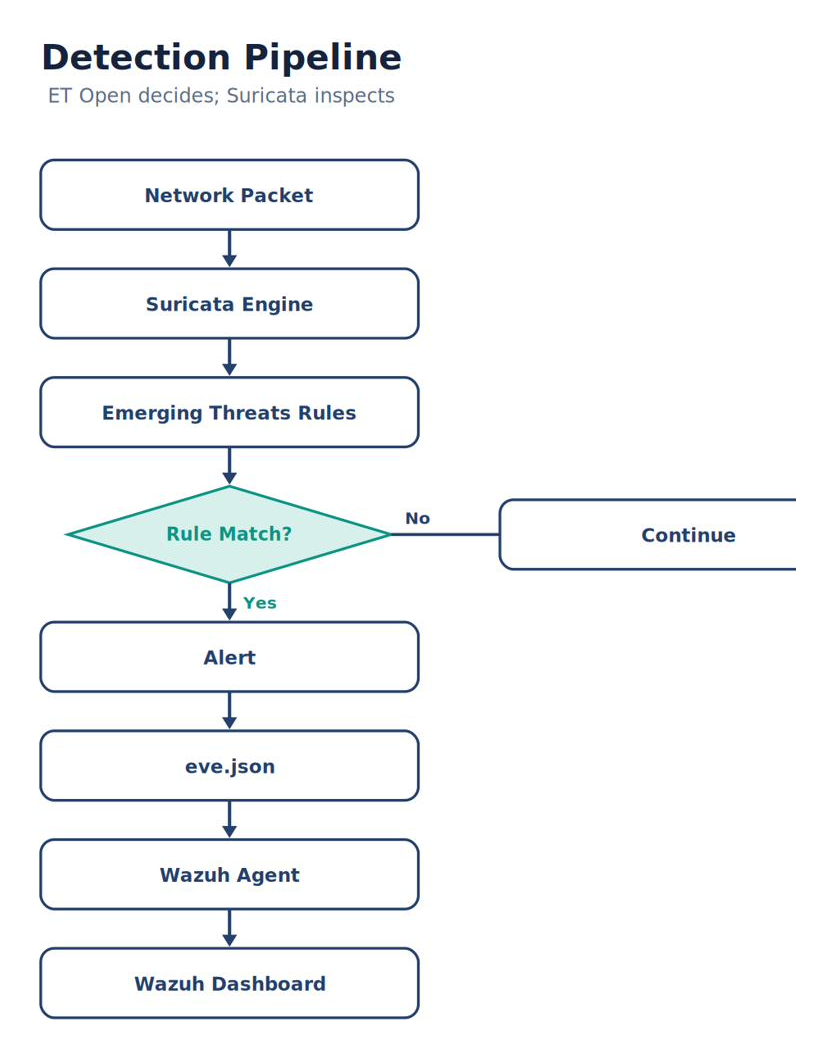
Note. The pipeline shows how information moves through detection Pipeline, from its source through processing to the analyst-visible result.
Notice that ET Open performs the decision-making while Suricata performs the packet inspection.
Anatomy of a Detection Rule
Although Suricata rules may appear intimidating initially, they follow a predictable structure.
Consider the simplified example below:
alert tcp any any -> $HOME_NET 80 (msg:“Example HTTP Alert”; sid:1000001; rev:1;)
Every rule consists of several logical components.
| Component | Purpose |
|---|---|
| alert | Action to perform |
| tcp | Protocol |
| any any | Source address and port |
| -> | Traffic direction |
| $HOME_NET 80 | Destination network and port |
| msg | Alert description |
| sid | Signature Identifier |
| rev | Rule revision |
Later chapters will explore rule writing in detail. For now, it is enough to understand that every alert originates from one of these signatures.
Signature IDs (SID)
Every rule contains a unique Signature ID (SID). The following representative ET Open rule uses SID 2003927; vendor rules and revisions change, so compare it with the rule installed in your current ruleset.
alert http $HOME_NET any -> $EXTERNAL_NET any (msg:"ET USER_AGENTS Suspicious User-Agent (HTTPTEST) - Seen used by downloaders"; flow:to_server,established; content:"HTTPTEST"; nocase; http_user_agent; depth:8; content:!"PlayStation"; http_header; threshold:type limit,count 2,track by_src,seconds 300; classtype:trojan-activity; sid:2003927; rev:12; metadata:affected_product Any, attack_target Client_Endpoint, deployment Perimeter, tag User_Agent, signature_severity Major;)| Rule part | Example | What it does |
|---|---|---|
| Action and protocol | alert http |
Generates an alert when an HTTP transaction matches. |
| Source and direction | $HOME_NET any -> |
Examines traffic leaving any port in the protected network. |
| Destination | $EXTERNAL_NET any |
Matches any port in the external network. |
| Message | msg:"..." |
Supplies the alert name shown to the analyst. |
| Flow | flow:to_server,established |
Limits evaluation to established client-to-server traffic. |
| Positive content | content:"HTTPTEST" |
Looks for the HTTPTEST string. |
| Modifiers | nocase; http_user_agent; depth:8 |
Ignores case, searches the User-Agent field, and limits the search depth. |
| Negative content | content:!"PlayStation"; http_header |
Excludes a known benign header string. |
| Threshold | threshold:... |
Limits repeated alerts from one source. |
| Classification | classtype:trojan-activity |
Assigns the rule's activity category. |
| SID | sid:2003927 |
Uniquely identifies the signature for research and tuning. |
| Revision | rev:12 |
Identifies the rule version. |
| Metadata | metadata:... |
Adds product, target, deployment, tag, and severity context. |
During an investigation, use the SID, revision, message, classification, and metadata to determine why the rule fired and whether tuning is appropriate.
Rule Categories
ET Open organizes rules into logical categories.
Examples include:
| Category | Purpose |
|---|---|
| emerging-malware.rules | Malware communication |
| emerging-scan.rules | Network reconnaissance |
| emerging-dns.rules | DNS activity |
| emerging-web_server.rules | Web server attacks |
| emerging-trojan.rules | Trojan activity |
| emerging-policy.rules | Policy violations |
| emerging-shellcode.rules | Shellcode detection |
| emerging-attack_response.rules | Attack responses |
Grouping signatures makes rule management significantly easier.
Analyst Tradecraft Tip
Detection is layered because attacker behavior is varied.
No single signature detects every attack.
Where the Rules Are Stored
The active compiled ET Open ruleset is normally stored at /var/lib/suricata/rules/suricata.rules; locally developed signatures are stored separately at /etc/suricata/rules/local.rules. Verify both locations in your installation:
ls -lh /var/lib/suricata/rules
ls -lh /etc/suricata/rules
Document the confirmed locations in your SOC Engineering Notebook.
Updating the Rule Set
Threat intelligence changes continuously. New malware families, vulnerabilities, and attack techniques appear every day. For this reason, ET Open must be updated regularly. Suricata provides suricata-update to manage rule downloads.
A typical update process is:
UB2604 · Terminal
sudo suricata-updateAfter updating, review the output for errors and validate the configuration:
sudo suricata -T -c /etc/suricata/suricata.yamlIf validation succeeds, restart Suricata and confirm the service is active:
sudo systemctl restart suricata
sudo systemctl is-active suricata
Updating signatures without validating the configuration risks disabling the sensor.
Vendor Rules vs. Local Rules
A common mistake is editing vendor-supplied ET Open rules directly. This approach causes problems because updates overwrite vendor files. Instead, keep custom signatures separate.
| Rule Type | Purpose | Active path |
|---|---|---|
| ET Open | Community-maintained detection rules | /var/lib/suricata/rules/suricata.rules |
| Local Rules | Organization-specific signatures | /etc/suricata/rules/local.rules |
The local rule file is reserved for custom detections developed by your organization. Throughout this textbook, every custom rule you create will be stored there.
Figure 3-28
Rule Management
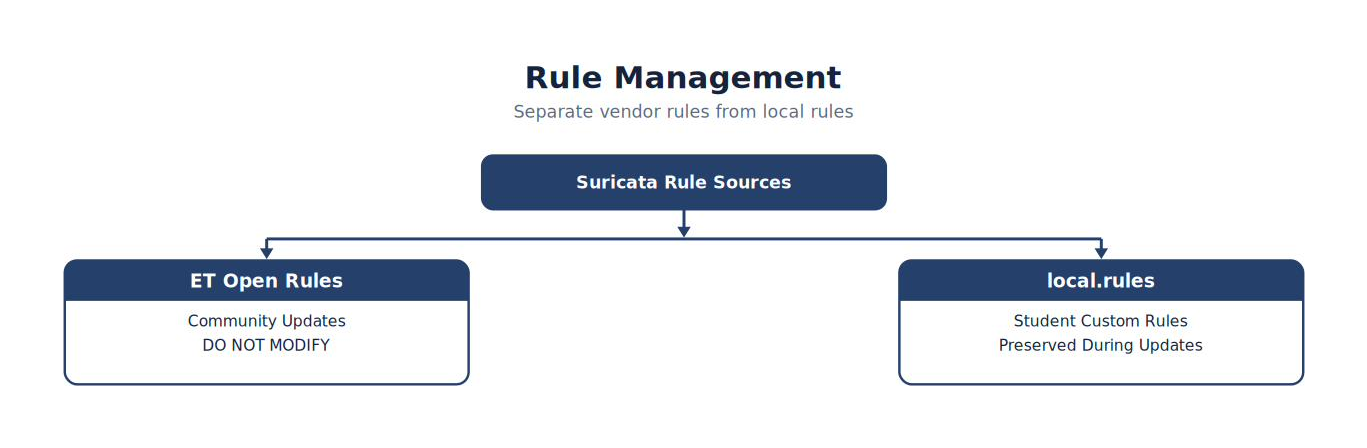
Note. The figure summarizes rule Management and highlights the relationships among its principal elements, evidence sources, and analytical outcomes.
Separating vendor and local rules is a fundamental best practice.
Validating Rule Loading
Installing rules is not enough. Confirm they loaded successfully.
Review the systemd journal entries for the Suricata service:
sudo journalctl -u suricataCommand breakdown:
| Part | Purpose |
|---|---|
sudo |
Runs the query with access to protected system journal entries. |
journalctl |
Reads logs collected by the systemd journal. |
-u suricata |
Filters the output to the suricata service unit. |
You can also inspect Suricata's application log:
/var/log/suricata/suricata.logLook for messages indicating:
Rules loaded
Configuration successful
No syntax errors
No duplicate SIDs
No missing files
Successful rule loading is a prerequisite for detection.
Generating a Test Alert
The simplest way to verify ET Open is operational is to generate known network activity.
Examples used later in the book include:
Nmap port scans
EICAR antivirus download
HTTP requests
DNS lookups
ICMP traffic
After generating traffic:
Confirm Suricata processed packets.
Verify an alert appears in eve.json.
Confirm the Wazuh Agent forwards the event.
Verify the alert appears in the Dashboard.
The complete telemetry path should always be validated after major changes.
Common Student Mistake
Students often run:
sudo suricata-update and assume the new rules are active. Not necessarily.
Always verify:
Rules downloaded successfully.
Configuration passed validation.
Suricata restarted successfully.
New rules loaded.
Test traffic generated alerts.
A successful update command alone does not prove successful detection.
Analyst Tradecraft Tip
Maintain a simple update checklist whenever you modify ET Open:
Update signatures.
Validate configuration.
Restart Suricata.
Check logs.
Generate known test traffic.
Confirm alerts in eve.json.
Confirm alerts in Wazuh.
Following this workflow ensures confidence in your detection capability.
Baseline Validation Checklist
Before continuing, verify:
| Validation | Expected |
|---|---|
| ET Open installed | ✓ |
| Rules downloaded | ✓ |
| Configuration validated | ✓ |
| Suricata restarted | ✓ |
| Rules loaded without errors | ✓ |
| Test traffic generated | ✓ |
| Alert written to eve.json | ✓ |
| Alert visible in Wazuh | ✓ |
| Snapshot created | ✓ |
Think Like a Detection Engineer
Imagine your organization experiences a newly disclosed vulnerability.
Your first question should not be:
“Does Suricata detect it?”
Instead ask:
Does ET Open include signatures?
Are our rules current?
Do we need temporary custom rules?
Should we tune existing signatures?
How will we validate detection?
The quality of an IDS depends on the quality, maintenance, and validation of its signatures.
Looking Ahead
With Suricata and Emerging Threats Open fully operational, the next section integrates the network sensor with Wazuh. Students will configure the Ubuntu Wazuh Agent to monitor eve.json, validate JSON decoding, trace Suricata alerts through the Wazuh Manager, and confirm end-to-end visibility in the Dashboard. This completes the network telemetry pipeline and prepares the laboratory for the first realistic attack simulations and incident investigations.
3.11 Integrating Suricata with Wazuh
Learning Objectives
After completing this section, you should be able to:
Explain how Suricata communicates with Wazuh.
Configure the Wazuh Agent to monitor eve.json.
Validate JSON log collection.
Trace a network alert from packet capture to the Dashboard.
Troubleshoot the complete telemetry pipeline.
Verify end-to-end network visibility.
Introduction
By itself, Suricata is an excellent Network Intrusion Detection System. However, it has one limitation. Suricata only knows what it detects.
It has no knowledge of:
Windows processes
Sysmon events
Windows Defender
Linux authentication
File Integrity Monitoring
Wazuh Active Response
Likewise, Wazuh has no knowledge of network activity unless Suricata shares it. This section connects both systems into a single Security Operations Center.
The Complete Telemetry Pipeline
Throughout this textbook we have discussed telemetry as a series of independent components. Now we connect them together.
Figure 3-29
Complete Network Detection Pipeline
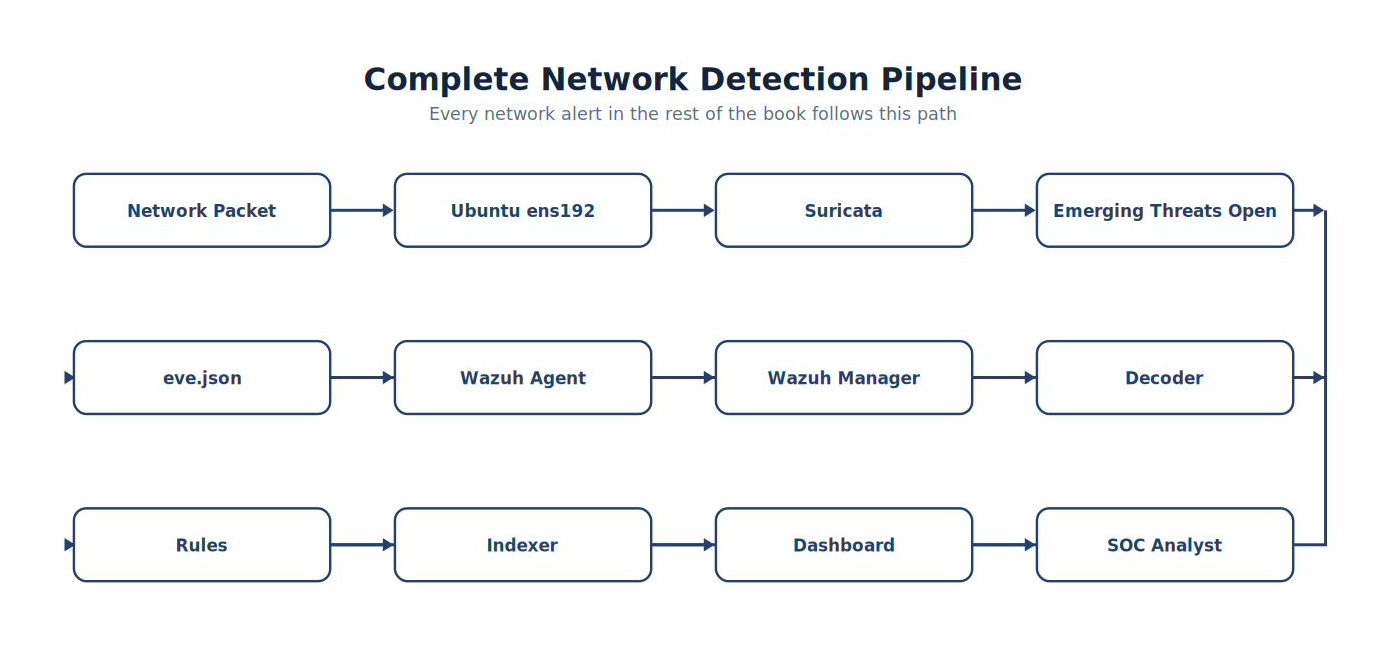
Note. The pipeline shows how information moves through complete Network Detection Pipeline, from its source through processing to the analyst-visible result.
Every alert generated throughout the remainder of this textbook follows this path.
The Role of eve.json
Suricata writes structured alerts and protocol records to:
/var/log/suricata/eve.jsonAn alert record may contain the timestamp, flow ID, event type, source and destination IP addresses and ports, protocol, application protocol, signature ID, revision, alert message, category, severity, and flow information. Because JSON is structured, Wazuh can decode these fields automatically.
The following is an actual HTTP alert example from the Suricata 8 EVE JSON documentation, formatted across lines for readability. In the file, each EVE record is stored as one JSON object.
{
  "timestamp": "2017-04-07T22:24:37.251547+0100",
  "flow_id": 586497171462735,
  "pcap_cnt": 53381,
  "event_type": "alert",
  "src_ip": "192.168.2.14",
  "src_port": 50096,
  "dest_ip": "209.53.113.5",
  "dest_port": 80,
  "proto": "TCP",
  "tx_id": 4,
  "alert": {
    "action": "allowed",
    "gid": 1,
    "signature_id": 2018358,
    "rev": 10,
    "signature": "ET HUNTING GENERIC SUSPICIOUS POST to Dotted Quad with Fake Browser 1",
    "category": "Potentially Bad Traffic",
    "severity": 2
  },
  "app_proto": "http"
}| Structure | Analyst use |
|---|---|
timestamp |
Places the event on the investigation timeline. |
flow_id |
Correlates alert, protocol, file, and flow records from the same session. |
event_type |
Identifies this object as an alert rather than DNS, HTTP, TLS, flow, or another EVE type. |
src_ip, src_port |
Identify the initiating endpoint and source port. |
dest_ip, dest_port |
Identify the destination endpoint and service port. |
proto, app_proto |
Identify the transport and application protocols. |
alert.signature_id |
Maps directly to the rule's sid for research and tuning. |
alert.rev |
Identifies the revision of the matching rule. |
alert.signature |
Carries the rule's analyst-facing message. |
alert.category, alert.severity |
Supply classification and priority context. |
Why JSON Matters
Traditional log files require extensive parsing.
Example:
Jun 15 14:35:12 IDS ALERT TCP 192.168.1.40 …
JSON stores information as individual fields.
Example:
{ “src_ip”:“192.168.1.40”, “dest_ip”:“192.168.1.10”, “proto”:“TCP”, “signature”:“ET SCAN Potential SSH Scan” }
Structured data dramatically improves searching and correlation.
Analyst Tradecraft Tip
One reason modern SIEM platforms prefer JSON is that analysts search fields, not text.
Instead of searching an entire line, you can search only:
Source IP
Destination Port
Protocol
Alert Category
Signature
Structured telemetry makes investigations much faster.
Configuring the Wazuh Agent
The Ubuntu Wazuh Agent must monitor:
/var/log/suricata/eve.json
Within the Wazuh Agent configuration (ossec.conf), a log collection entry should specify:
Log format: json
Location: /var/log/suricata/eve.json
This instructs the agent to monitor the file continuously and forward newly written events to the Wazuh Manager. Note: Throughout this textbook we focus on understanding the configuration rather than memorizing XML syntax. The complete configuration examples are provided in Appendix B and the accompanying laboratory files.
Restarting the Agent
After modifying the configuration, restart the Wazuh Agent and verify its runtime state.
UB2604 · Terminal
sudo systemctl restart wazuh-agentConfirm that the service is active:
UB2604 · Terminal
sudo systemctl is-active wazuh-agentExpected output:
activeUse sudo systemctl status wazuh-agent when you need detailed status and recent service messages.
Manage automatic startup with these commands:
sudo systemctl enable wazuh-agent
sudo systemctl disable wazuh-agent
Command breakdown:
| Part | Purpose |
|---|---|
sudo |
Runs the service-control request with administrative privileges. |
systemctl |
Controls and queries systemd services. |
restart |
Reloads the current configuration by stopping and starting the service. |
is-active |
Reports the current runtime state without the longer status display. |
enable |
Configures startup at boot without starting the service now. |
disable |
Removes startup at boot without stopping the service now. |
wazuh-agent |
Identifies the service unit being controlled. |
Never assume the restart succeeded. Always verify.
Validate the Agent Log
Review the agent log.
WAZUH-SRV · Terminal
sudo tail -f /var/ossec/logs/ossec.logCommand breakdown:
| Part | Purpose |
|---|---|
sudo |
Reads a protected operational log with administrative privileges. |
tail |
Displays entries from the end of the file. |
-f |
Follows the file and prints new entries as they are written. |
/var/ossec/logs/ossec.log |
Identifies the Wazuh Agent operational log. |
After the agent loads the Suricata collection configuration, a successful entry follows this Wazuh log format; the timestamp will differ in your lab:
2026/08/31 14:22:17 wazuh-logcollector: INFO: (1950): Analyzing file: '/var/log/suricata/eve.json'.| Log field | Example | Meaning |
|---|---|---|
| Timestamp | 2026/08/31 14:22:17 |
When the agent wrote the operational message. |
| Component | wazuh-logcollector |
The Wazuh process responsible for reading configured log sources. |
| Severity | INFO |
An informational status message rather than a warning or error. |
| Message code | (1950) |
The Wazuh internal message identifier for the logcollector action. |
| Action | Analyzing file |
Confirms that logcollector accepted the file as a monitored source. |
| Source path | /var/log/suricata/eve.json |
The exact file the agent is monitoring. |
This entry confirms that the source file opened successfully. Continue watching for warnings, errors, connection failures, or parsing problems and correct them before proceeding.
Generate a Test Alert
Now generate known network activity.
Examples include:
Nmap scan
DNS lookup
HTTP request
EICAR download
For example:
curl http://example.com or, from Windows:
UB2604 · Terminal
nslookup example.comThe objective is to generate traffic that traverses the monitored interface.
Validate eve.json
Immediately verify that Suricata recorded the event.
UB2604 · Terminal
sudo tail -f /var/log/suricata/eve.jsonYou should observe new JSON records appearing. If no new events appear, the problem exists before Wazuh. Do not troubleshoot Wazuh until Suricata is generating telemetry.
Figure 3-30
Validation Stage 1
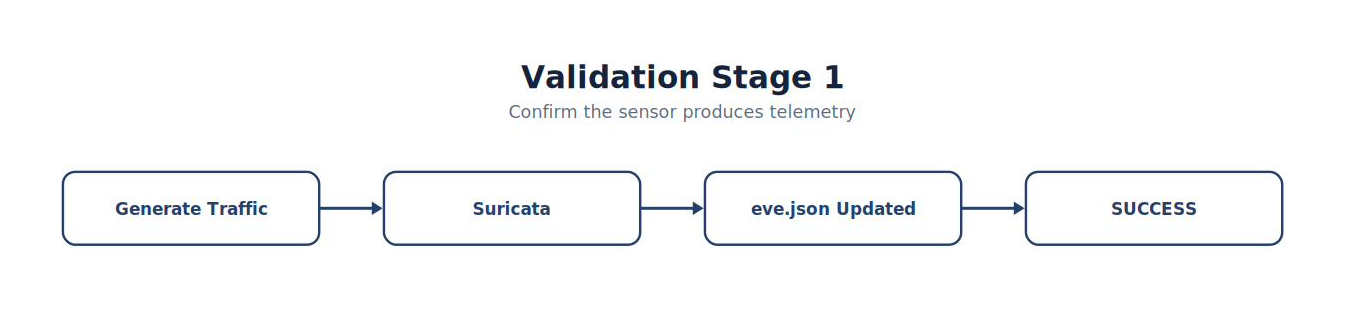
Note. The figure summarizes validation Stage 1 and highlights the relationships among its principal elements, evidence sources, and analytical outcomes.
Only after this succeeds should you continue.
Validate the Wazuh Dashboard
Log into the Dashboard.
Navigate to → Wazuh Dashboard → Threat hunting
Set the time range to → Last 15 minutes
Search for:
Suricata
The Ubuntu hostname
Source IP
Destination IP
Signature
Locate the generated alert. This confirms the complete telemetry pipeline is functioning.
Figure 3-31
Validation Stage 2

Note. The figure summarizes validation Stage 2 and highlights the relationships among its principal elements, evidence sources, and analytical outcomes.
This is the first complete proof that the network detection pipeline is operational.
Correlating Network and Endpoint Telemetry
The real strength of Wazuh becomes apparent when multiple telemetry sources describe the same activity.
Example:
| Time | Source | Event |
|---|---|---|
| 10:15:02 | Sysmon | PowerShell Started |
| 10:15:04 | Sysmon | DNS Query |
| 10:15:05 | Suricata | HTTP Request |
| 10:15:06 | Suricata | Executable Download |
| 10:15:08 | Windows Defender | Malware Quarantined |
| 10:15:09 | Wazuh | Correlated Alert |
Notice that no single technology tells the complete story. Together, they reconstruct the attack. This principle—telemetry correlation—is the defining capability of a modern SIEM.
Common Student Mistake
Students often search only for the alert title. Professional analysts also examine the source IP, destination IP, flow ID, signature ID (SID), alert category, timestamp, hostname, and related endpoint events. The objective is not simply to locate an alert; it is to understand the activity that generated it.
Troubleshooting the Pipeline
When alerts fail to appear, work through the pipeline sequentially.
| Stage | Validation |
|---|---|
| Traffic generated | Confirm test traffic occurred |
| Interface receives packets | Verify with tcpdump |
| Suricata running | Check systemctl status suricata |
| Rules loaded | Review suricata.log |
| eve.json updating | Monitor with tail -f |
| Wazuh Agent running | Check systemctl status wazuh-agent |
| Agent monitoring eve.json | Review ossec.conf |
| Manager receiving events | Check ossec.log |
| Dashboard displays alerts | Search recent events |
This systematic approach isolates the failure without unnecessary changes.
Analyst Tradecraft Tip
Troubleshoot from the packet forward.
Follow the direction of the data flow.
Baseline Validation Checklist
Before continuing, verify:
| Validation | Expected |
|---|---|
| Suricata writing eve.json | ✓ |
| Wazuh Agent monitoring JSON | ✓ |
| Agent restarted successfully | ✓ |
| Agent log free of errors | ✓ |
| Test traffic generated | ✓ |
| Alert visible in eve.json | ✓ |
| Alert visible in Dashboard | ✓ |
| Timeline correlation successful | ✓ |
| Snapshot created | ✓ |
Do not proceed until every item has been validated.
Analyst Tradecraft Tip
Imagine a student says: “Suricata isn’t working.”
Your first response should not be:
“Reinstall Suricata.”
Instead, ask:
Is traffic reaching the sensor?
Does tcpdump see packets?
Does eve.json update?
Is the Wazuh Agent monitoring the file?
Is the Manager receiving telemetry?
Can the Dashboard retrieve indexed events?
By asking these questions, you are no longer acting as a software installer—you are thinking like a Security Operations Center analyst.
Looking Ahead
With endpoint telemetry from Sysmon, network telemetry from Suricata, and centralized visibility through Wazuh, the laboratory now possesses a complete security monitoring capability. The next section introduces end-to-end validation testing, where students intentionally generate known events—including Nmap scans, EICAR antivirus detections, PowerShell execution, DNS queries, and web requests—to verify that every component of the SOC functions correctly. This operational validation becomes the standard health check performed before every future lab exercise and investigation (EICAR, n.d.).
3.12 End-to-End SOC Validation
Learning Objectives
After completing this section, you should be able to:
Validate the complete SOC telemetry pipeline.
Generate known-good test events.
Confirm endpoint and network visibility.
Verify Wazuh correlation across multiple telemetry sources.
Troubleshoot failures using a structured methodology.
Establish a repeatable daily operational validation routine.
Introduction
One of the most dangerous assumptions in cybersecurity is believing that a monitoring system is working simply because it is powered on. Professional Security Operations Centers validate their monitoring infrastructure continuously.
Why?
Because sensors fail. Agents disconnect. Disk space fills. Rules stop loading. Interfaces change. Updates introduce unexpected behavior. A monitoring system that silently stops collecting telemetry is often more dangerous than one that fails loudly. Throughout the remainder of this textbook, every laboratory exercise begins with a complete operational validation.
Why We Validate
Consider the statement “No alerts appeared today.” Is that good news? Maybe—or Suricata stopped, Sysmon is no longer logging (Russinovich & Garnier, n.d.), the Wazuh Agent disconnected, eve.json stopped updating, the Dashboard is showing old data, the Indexer failed, or the time filter is wrong.
Professional analysts never assume silence means security. They first prove that the monitoring system can detect activity.
Figure 3-32
Operational Validation
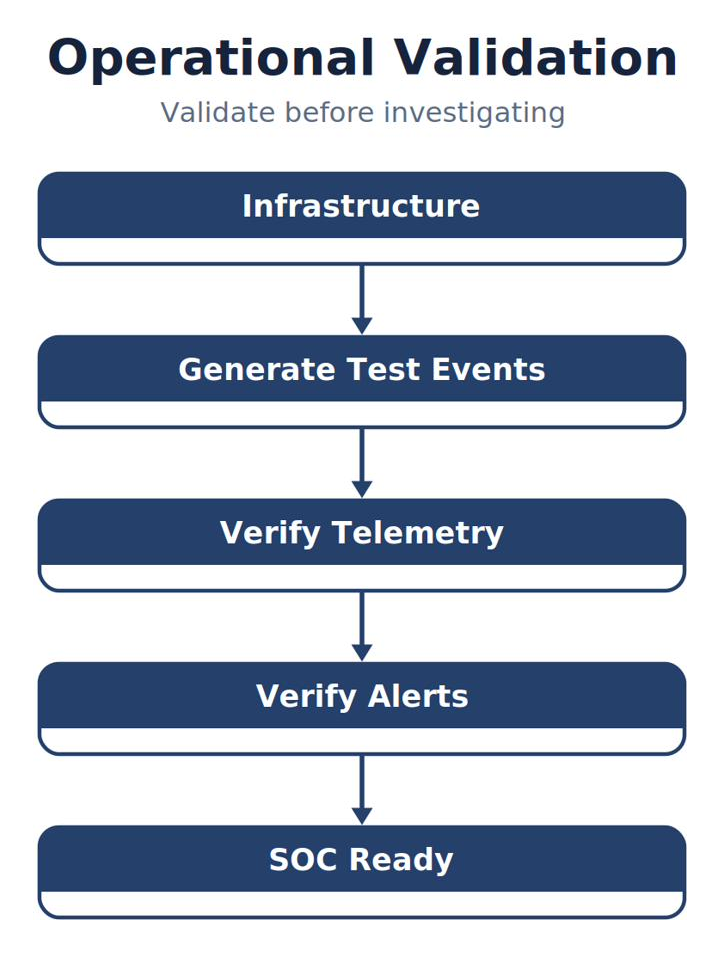
Note. The figure summarizes operational Validation and highlights the relationships among its principal elements, evidence sources, and analytical outcomes.
Daily SOC Startup Checklist
Before investigating alerts, verify the following:
Wazuh Server
| Validation | Expected |
|---|---|
| Manager running | ✓ |
| Indexer running | ✓ |
| Dashboard running | ✓ |
| Disk space healthy | ✓ |
| System time correct | ✓ |
Ubuntu Sensor
| Validation | Expected |
|---|---|
| Ubuntu running | ✓ |
| Wazuh Agent active | ✓ |
| Suricata active | ✓ |
| eve.json updating | ✓ |
| ET Open loaded | ✓ |
Windows Endpoint
| Validation | Expected |
|---|---|
| Windows running | ✓ |
| Wazuh Agent active | ✓ |
| Sysmon service running | ✓ |
| Defender operational | ✓ |
| Current Event Logs updating | ✓ |
Only after all systems pass validation should investigations begin.
Validation Test 1 — Linux Telemetry
Generate a Linux log entry:
logger "SOC Validation Test"The logger command writes the quoted message to the Linux system log. The Wazuh Agent should collect and forward the new entry, and the event should appear in the Dashboard, validating Ubuntu endpoint telemetry.
Validation Test 2 — Windows Sysmon
From Command Prompt on WIN11, start a clean PowerShell process:
powershell.exe -NoProfile -Command "Write-Output 'SOC Validation Test'"powershell.exe starts the process, -NoProfile prevents profile scripts from changing the test, and -Command runs the quoted command and exits. Sysmon should record process creation as Event ID 1; then verify that Wazuh receives the event and the Dashboard displays it.
Validation Test 3 — DNS Activity
Generate a DNS lookup:
WIN11 · PowerShell
nslookup www.example.comExpected result:
WIN11 · PowerShell
Sysmon Event ID 22Verify the event in Event Viewer and the Wazuh Dashboard. Students have already practiced this workflow in previous laboratories.
Validation Test 4 — Suricata
Generate simple network traffic with either command:
curl https://example.com
ping example.com
Verify that the monitored interface observes the traffic, eve.json receives a new record, and the Dashboard receives the telemetry.
Validation Test 5 — Nmap Scan
Perform a controlled scan against the Ubuntu sensor.
Example:
UB2604 · Terminal
nmap -sS 192.168.1.10Expected Result:
UB2604 · Expected output
ET Open generates:Port Scan alerts
Network reconnaissance detections
Students should locate these alerts inside Wazuh.
Validation Test 6 — EICAR (Lab 0A)
This validation test is expanded in Lab 0A — EICAR, YARA, Microsoft Defender, and Wazuh Validation. Generate an antivirus detection by using the controlled EICAR test file.
Expected:
Windows Defender:
Detects EICAR
Quarantines file
Wazuh:
- Receives Defender telemetry
Students should correlate:
Defender
Sysmon
Wazuh
Analyst Tradecraft Tip
Notice something interesting. None of these tests attempts to simulate an advanced attacker.
Why?
Because the purpose of operational validation is not to test sophisticated detection.
The objective is much simpler:
Prove that every component of the monitoring pipeline still works. Advanced attack simulations come later.
Correlation Exercise
Students should now correlate events from multiple technologies.
Example timeline:
| Time | Source | Event |
|---|---|---|
| 10:15:01 | Sysmon | PowerShell Started |
| 10:15:03 | Sysmon | DNS Query |
| 10:15:05 | Suricata | HTTP Request |
| 10:15:08 | Windows Defender | EICAR Detected |
| 10:15:09 | Wazuh | Alert Generated |
Question:
Could any individual technology explain the entire sequence?
No. Only correlation provides the complete picture.
Figure 3-33
Multi-Source Correlation
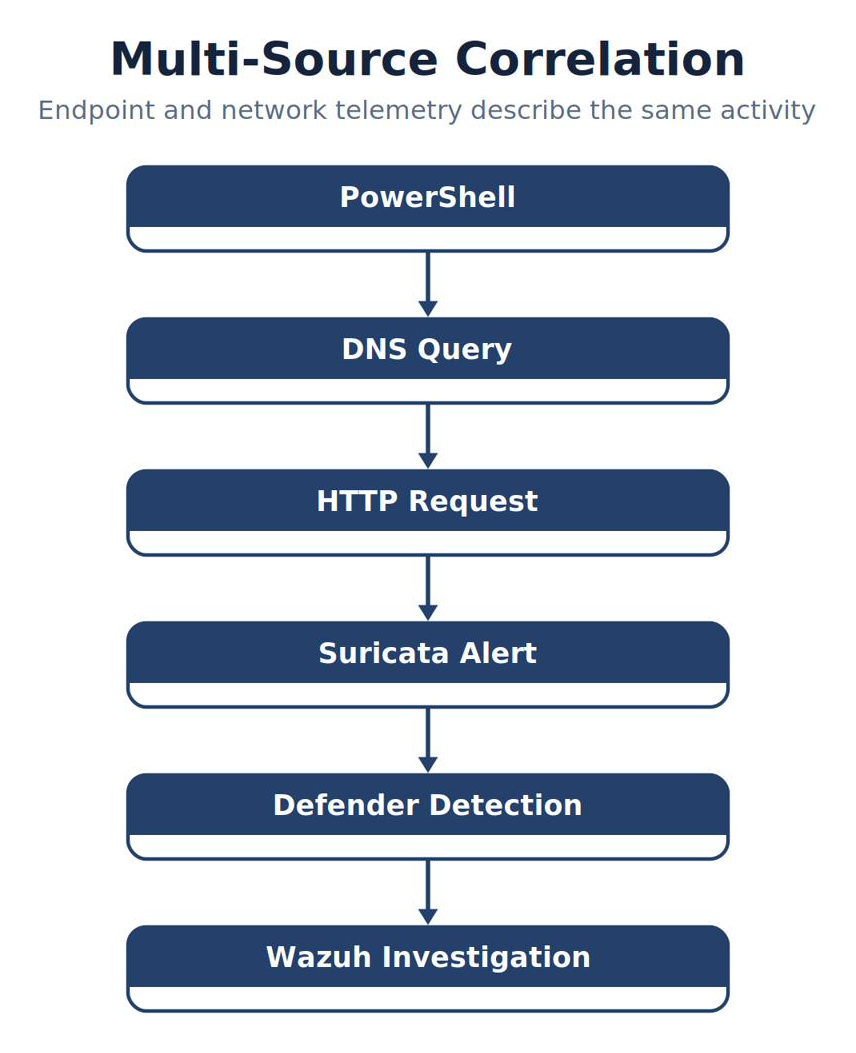
Note. The figure summarizes multi-Source Correlation and highlights the relationships among its principal elements, evidence sources, and analytical outcomes.
Measuring Success
At this stage of the laboratory, students should be capable of proving that:
Windows generates telemetry.
Ubuntu generates telemetry.
Suricata detects network traffic.
ET Open generates signatures.
Wazuh receives endpoint logs.
Wazuh receives network logs.
Wazuh correlates events.
Dashboard displays searchable alerts.
This represents a fully operational introductory Security Operations Center.
Common Student Mistake
Students often stop after seeing one successful alert.
Professional engineers verify:
Multiple telemetry sources
Multiple event types
Multiple hosts
Multiple timestamps
A single successful alert demonstrates functionality. A complete validation demonstrates reliability.
Analyst Tradecraft Tip
Develop a personal habit:
Never trust yesterday’s validation. Validate your SOC today.
Monitoring systems change constantly due to:
Reboots
Updates
Configuration changes
Network changes
Rule updates
Human error
Operational confidence comes from current validation—not historical success.
End-to-End Troubleshooting Matrix
| Symptom | Likely Area to Investigate |
|---|---|
| No Windows events | Sysmon, Wazuh Agent |
| No Suricata alerts | Interface, eve.json, ET Open |
| No Dashboard alerts | Manager, Indexer, Dashboard |
| Agent disconnected | Networking, Agent service |
| DNS events missing | Sysmon configuration |
| EICAR missing | Defender status, Wazuh log collection |
| Port scan missing | Suricata interface, HOME_NET, rules |
This table becomes one of the most frequently referenced troubleshooting resources throughout the course.
Baseline Validation Checklist
Before proceeding to the next chapter:
| Validation | Status |
|---|---|
| Wazuh Server healthy | □ |
| Ubuntu Agent healthy | □ |
| Suricata operational | □ |
| ET Open operational | □ |
| Windows Agent healthy | □ |
| Sysmon generating events | □ |
| Defender generating events | □ |
| Suricata alerts visible | □ |
| Endpoint alerts visible | □ |
| Dashboard operational | □ |
| Complete telemetry pipeline verified | □ |
| VMware snapshot created | □ |
Students should complete and initial this checklist at the beginning of every major lab exercise.
Think Like a Cybersecurity Analyst
Imagine arriving at work and discovering no alerts overnight.
Rather than celebrating, ask yourself:
Did the network become perfectly secure overnight?
Or did my monitoring infrastructure stop working?
The only way to answer that question is through systematic validation. Professional SOC engineers earn confidence through evidence, not assumptions.
Chapter Connection
At this point, the Security Operations Center laboratory is fully operational. Students have:
Built the infrastructure.
Validated the Wazuh Server.
Configured Ubuntu 26.04.
Installed the Wazuh Agent.
Deployed Suricata.
Integrated Emerging Threats Open.
Connected Suricata to Wazuh.
Verified endpoint telemetry.
Verified network telemetry.
Performed end-to-end operational validation.
Beginning in Chapter 4, students shift from building the SOC to using it. The focus changes from installation and validation to investigation, introducing the Wazuh Dashboard in depth, advanced searching, saved queries, timeline analysis, and the first structured incident investigations using the laboratory they have just engineered.
3.13 Chapter Summary
This chapter marked the transition from cybersecurity theory to hands-on engineering. Rather than installing software immediately, you first learned to plan a laboratory the way a professional SOC engineer would: choosing a consistent naming convention, documenting an IP addressing scheme, and understanding VMware’s virtual networking modes before touching a single configuration file.
You learned why the Ubuntu sensor in this lab carries two network interfaces — one for management traffic and one dedicated to promiscuous-mode packet capture — and why that separation mirrors how production network sensors are deployed. You validated the Wazuh Server, installed and validated the Wazuh Agent on Ubuntu, and installed Suricata along with the Emerging Threats Open rule set. Finally, you connected Suricata’s network telemetry to Wazuh and performed a complete end-to-end validation of the SOC laboratory, generating known test events and tracing them through every stage of the pipeline.
The methodology introduced in this chapter — install, configure, validate, document, snapshot — will repeat throughout the remainder of this textbook. So will the central principle first introduced in Chapter 1: never trust a monitoring system you have not personally validated.
Chapter 3 Key Terms
| Term | Definition |
|---|---|
| Bridged Networking | A VMware network mode in which a virtual machine appears as an independent device on the physical network. |
| eve.json | Suricata's structured JSON output file — the authoritative record of the events and alerts (flow, alert, DNS, HTTP, TLS, and other record types) the sensor observed. |
| Hypervisor | Software responsible for creating and managing virtual machines (e.g., VMware Workstation). |
| Host-Only Networking | A VMware network mode that isolates virtual machines from the physical network. |
| NAT Networking | A VMware network mode in which the host acts as a router between virtual machines and the outside network. |
| Promiscuous Mode | A network-interface mode that accepts packets not specifically addressed to the interface, subject to what the virtual switch forwards, so a sensor can inspect traffic destined for other hosts. |
| Signature ID (SID) | The unique numeric identifier assigned to every Suricata rule (e.g., 2100498); how analysts research why an alert fired. |
| Snapshot | A saved state of a virtual machine’s disk and configuration, used for rapid recovery. |
| Suricata | The open-source Network Intrusion Detection System (NIDS) used throughout this book; it inspects packets against signatures and writes events and alerts to eve.json. |
| Emerging Threats Open (ET Open) | A community-maintained, freely available Suricata rule set, updated daily and supported by Proofpoint. |
| VMnet | A VMware virtual network to which virtual machines’ network adapters connect. |
| wazuh-install.sh | The official Wazuh installation assistant script used to deploy the central components. |
Knowledge Check
Select the best answer for each question.
1. Why does the Ubuntu sensor in this laboratory use two network interfaces?
A. To separate management traffic from dedicated packet-capture traffic
B. To increase Internet download speed
C. Because Wazuh requires two interfaces to install
D. To allow dual-booting
2. Which VMware network mode is most commonly used for cybersecurity laboratories that need realistic network visibility?
A. NAT
B. Host-Only
C. Bridged
D. Airplane mode
3. What is the primary purpose of a VMware snapshot?
A. To increase virtual machine performance
B. To provide a recovery point before making changes
C. To back up files to the cloud
D. To install new software automatically
4. Where does Suricata write its structured alert and event data by default?
A. /var/log/wazuh.json
B. /etc/suricata/suricata.yaml
C. /var/ossec/logs/ossec.log
D. /var/log/suricata/eve.json
5. What must be true before Suricata can detect a given packet?
A. The packet must be encrypted
B. The Wazuh Manager must request it
C. The packet must actually reach the monitored interface
D. The packet must originate from the Internet
6. What is the purpose of the Emerging Threats Open rule set?
A. It provides community-maintained detection signatures for Suricata
B. It replaces the Wazuh Manager
C. It encrypts agent-to-manager communication
D. It is a replacement for VMware networking
7. Where should custom, locally developed Suricata signatures be stored?
A. Inside the ET Open rule files directly
B. In suricata.yaml
C. In the Wazuh Manager configuration
D. In a separate local.rules file
8. Which command validates Suricata’s configuration file syntax before restarting the service?
A. suricata-update
B. suricata -T -c /etc/suricata/suricata.yaml
C. systemctl enable suricata
D. tail -f eve.json
9. If no Suricata alerts appear in the Wazuh Dashboard after a scan, what should be verified first?
A. Whether the Wazuh Dashboard theme is set correctly
B. Whether the scan was run twice
C. Whether the complete telemetry pipeline — packet, interface, Suricata, eve.json, Agent, Manager, Indexer, Dashboard — is intact
D. Whether Windows Defender is enabled
10. What is the recommended workflow before performing a major software installation in this lab?
A. Take a snapshot, then install, configure, and validate
B. Install first, document later
C. Disable all logging to improve performance
D. Skip validation to save time
Chapter Discussion Questions
Why is planning (naming conventions, IP addressing, network design) important before installing any software?
Explain why the Ubuntu sensor uses two separate network interfaces rather than one.
Describe the difference between Bridged, NAT, and Host-Only VMware networking, and explain when each is appropriate.
Why is a “successful” installation command insufficient proof that a service is functioning correctly?
Walk through the complete telemetry path from a network packet to a visible alert in the Wazuh Dashboard.
Why should vendor-supplied Suricata rules never be edited directly?
Explain why snapshots are considered one of the most valuable tools available to a SOC engineer.
Why does this chapter recommend validating one configuration change at a time rather than making several changes at once?
Further Resources
Wazuh — Installation Guide (https://documentation.wazuh.com/current/installation-guide/index.html) — Authoritative install steps if your build diverges from this chapter.
Suricata — Quickstart (https://docs.suricata.io/en/latest/quickstart.html) — Official install and first-run guidance.
Emerging Threats Open Ruleset (https://rules.emergingthreats.net/) — The community signature set your sensor downloads.
Sysmon (Microsoft Learn) (https://learn.microsoft.com/en-us/sysinternals/downloads/sysmon) — Download and command-line reference.
Security Onion Documentation (https://docs.securityonion.net/) — Reference for the second NSM platform in the lab topology.