

Chapter Overview
Course Progression
This chapter prepares for and reinforces Progressive Labs PL-01 through PL-04, moving from dashboard orientation through structured investigation and ransomware analysis. Complete the embedded Chapter Exercises for focused practice, then use the Progressive Labs for cumulative investigations. See Course Progression and Progressive Lab Alignment in the front matter.
Field Guide: Initial SOC Triage: First 15 Minutes — document early findings and prepare the analyst handoff.
A Security Information and Event Management (SIEM) platform is valuable only if analysts can efficiently extract meaningful information from the enormous quantity of telemetry it collects.
During the previous chapters, you constructed a fully operational Security Operations Center capable of monitoring endpoint activity, Linux systems, and network traffic. Your Wazuh platform now receives telemetry from:
Windows 11
Ubuntu Linux
Sysmon
Suricata
Emerging Threats Open
Windows Defender
Thousands of events may now arrive every hour. The challenge is no longer collecting data. The challenge is understanding it. This chapter introduces the investigative workflow used by professional Security Operations Centers to transform raw telemetry into actionable intelligence. Students will learn how to search efficiently, filter events, build timelines, correlate evidence, and distinguish between routine activity and true security incidents.
Learning Objectives
After completing this chapter, you should be able to:
Navigate the Wazuh Dashboard efficiently.
Understand the Dashboard layout.
Use filters and search queries effectively.
Investigate alerts using timelines.
Correlate endpoint and network telemetry.
Build evidence-based conclusions.
Document professional investigations.
Introduction
One misconception about Security Operations Centers is that analysts spend their day watching alerts scroll across giant display screens. Reality is considerably different. Most analysts spend the majority of their time searching.
Searching for:
Evidence
Context
Previous activity
Related alerts
Historical behavior
Similar incidents
Knowing where to search is valuable. Knowing how to search is essential.
The Dashboard Is an Investigation Platform
During Chapter 3, the Dashboard functioned primarily as an operational console.
You verified:
Agent health
Service status
Alert flow
Telemetry
Now the Dashboard becomes something different. It becomes an investigative workspace.
Instead of asking:
Is everything working?
You now ask:
What happened?
Figure 4-1
The Investigation Lifecycle
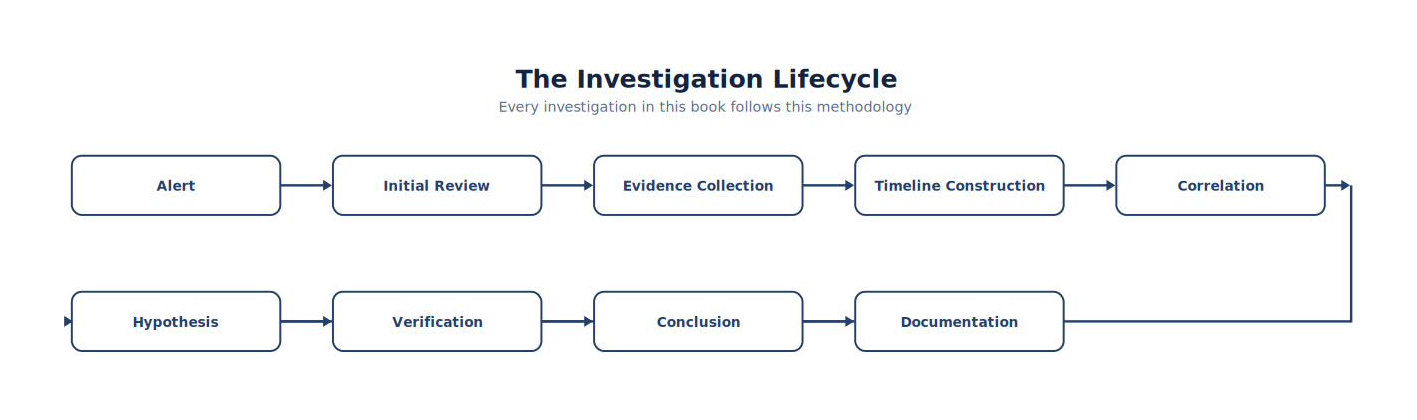
Note. The workflow presents the ordered stages of the Investigation Lifecycle and highlights the validation and feedback steps that make the process repeatable.
Every investigation throughout this textbook follows this methodology.
The Five Questions Every Analyst Should Ask
When an alert appears, avoid immediately asking, “Was I hacked?” Start with five evidence-focused questions:
| Question | Verify | Compact example or artifact |
|---|---|---|
| 1. What happened? | State observable facts—not a conclusion. | rule.description; data.win.system.eventID; process image such as C:\Windows\System32\WindowsPowerShell\v1.0\powershell.exe |
| 2. When did it happen? | Establish timestamp, time zone, duration, and surrounding activity. | @timestamp; dashboard time range; Windows eventRecordID |
| 3. Where did it happen? | Identify host, user, address, process, and interface. | agent.name; data.win.system.computer; data.win.eventdata.targetUserName; data.win.eventdata.ipAddress |
| 4. What supports the alert? | Corroborate with an independent source whenever possible. | Sysmon Operational log; /var/log/suricata/eve.json; Defender Operational log; /var/log/auth.log |
| 5. What happens next? | Record a justified disposition and action. | Close as expected administration, continue scoping, escalate, acquire evidence, or isolate the endpoint |
For example, an analyst can begin scoping a PowerShell alert on WIN11 with this filter:
Wazuh Dashboard · DQL filter
agent.name:"win11" AND data.win.eventdata.image:*powershell.exeThen inspect @timestamp, the user and IP fields populated in the alert, and an independent telemetry source before choosing an action. Professional analysts conclude investigations with a documented, evidence-based disposition.
Thinking Like an Investigator
Suppose Wazuh displays:
Suspicious PowerShell
Many beginners immediately think:
Malware. Professionals think differently.
Possible explanations include:
Administrator maintenance
Student laboratory exercise
Software installer
Automation script
Malware
Red team activity
Notice something. Only one possibility involved malware. Professional analysts evaluate evidence before choosing among competing explanations.
Analyst Tradecraft Tip
One habit separates excellent investigators from average investigators:
Excellent investigators become comfortable saying:
“I don’t know yet.” There is nothing unprofessional about uncertainty. There is something unprofessional about unsupported certainty. Collect evidence. Then decide.
Security Events
Security Events is the primary alert-investigation interface. Analysts use it to review, filter, search, sort, and expand alert records while building a timeline. Students will spend substantial time in this screen during the semester, so learn it thoroughly.
Understanding Time
One of the most common investigative mistakes is using the wrong time range. If you search Last 15 minutes for an event that occurred yesterday, an empty result does not prove the event does not exist; it proves only that the event is outside the selected window.
Best practice: Whenever an event appears missing, verify the time selector before changing anything else. This simple habit resolves many apparent data problems.
Dashboard Time Ranges
| Range | Typical Use |
|---|---|
| Last 15 Minutes | Live testing |
| Last Hour | Recent validation |
| Last 24 Hours | Daily investigations |
| Last 7 Days | Trend analysis |
| Last 30 Days | Historical review |
| Custom | Incident response |
Understanding Filters
Filters turn a large alert set into a defensible evidence set. Start with fields that are actually populated in the alert:
| Filter target | Alert field | Example value |
|---|---|---|
| Windows Wazuh agent | agent.name |
win11 |
| Ubuntu Wazuh agent | agent.name |
u2604 |
| Rule | rule.id / rule.level |
5710 / level 10 or higher |
| Windows user | data.win.eventdata.targetUserName |
Administrator |
| Source address | data.srcip or data.win.eventdata.ipAddress |
192.168.1.40 |
| Detection category | rule.groups |
authentication_failures |
| Process | data.win.eventdata.image |
powershell.exe |
For example, this DQL filter scopes higher-severity PowerShell alerts to WIN11:
Wazuh Dashboard · DQL filter
agent.name:"win11" AND data.win.eventdata.image:*powershell.exe AND rule.level >= 10Open a matching alert and confirm its document fields; decoder and event-source differences can change which field contains a value. Filtering is most valuable when each condition has an evidentiary purpose.
To scope results to the Ubuntu sensor, use:
Wazuh Dashboard · DQL filter
agent.name:"u2604"Figure 4-2
Investigation Funnel
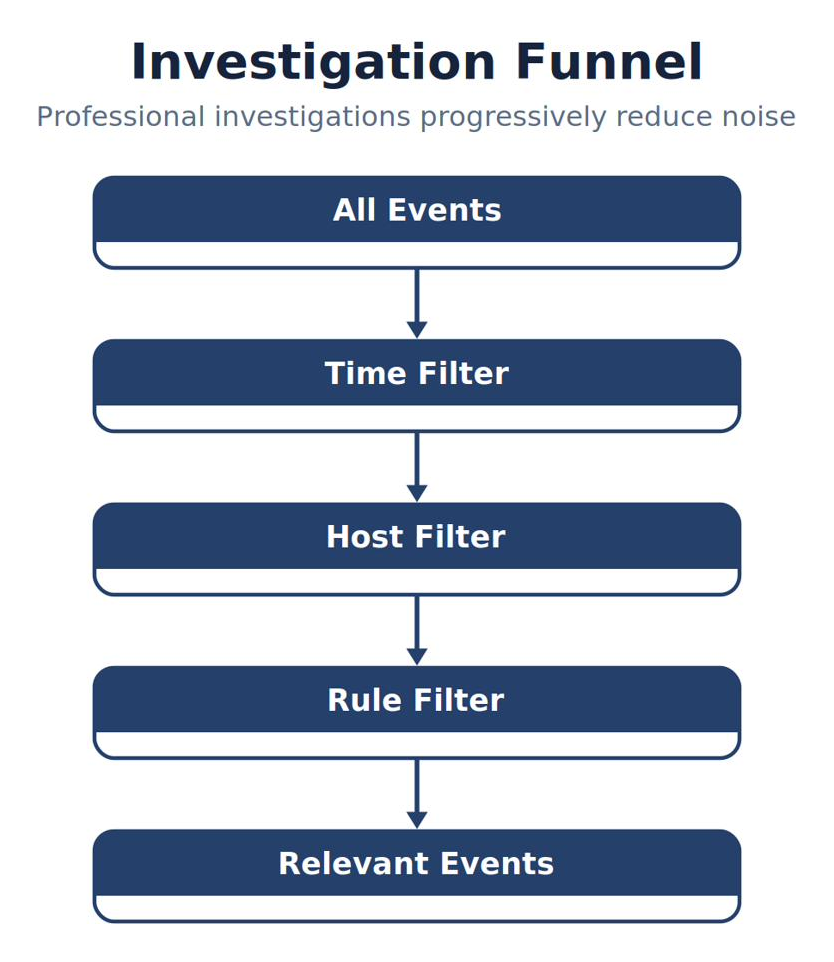
Note. The figure shows how investigation Funnel narrows broad observations into prioritized evidence and increasingly confident analytical judgments.
Professional investigations progressively reduce noise.
Searching Versus Filtering
Searching looks broadly for a value; filtering restricts results using a specific field. A broad search for powershell.exe may find the value in several fields, while agent.name:"win11" deliberately limits the dataset to one Wazuh agent. Analysts commonly search to discover the relevant field, then filter to make the result repeatable and precise.
The Importance of Context
Analyst mantra: An alert is a clue, not a conclusion.
An alert reports that a detection condition matched. It does not, by itself, prove malicious intent, establish impact, or explain the surrounding activity. Context supplies that meaning by connecting the event to its time, user, host, parent process, network activity, historical baseline, and independent evidence.
Consider the statement “PowerShell executed.” During an approved maintenance window, launched by an administrator from a management tool, that activity may be expected. The same executable launched by a document reader, using an encoded command, contacting a newly observed external address, and writing a file into a user profile deserves immediate investigation. The executable did not change; the context changed the analyst's judgment.
Use the AECD habit whenever an alert appears:
| Habit | Analyst action | Pragmatic reminder |
|---|---|---|
| Anchor | Record who, what, when, and where. | Start with populated fields—not assumptions. |
| Expand | Examine activity before and after the alert. | Begin with ±5 minutes; widen only as evidence requires. |
| Corroborate | Seek an independent telemetry source. | Endpoint plus network evidence is stronger than either alone. |
| Decide | Document the supported disposition and next action. | State what is known, unknown, and still being tested. |
Analyst Tradecraft Tip
Preserve the alert. Record the time zone. Document every query.
Repeatable investigations produce defensible conclusions.
Figure 4-3
From PowerShell to Suricata HTTP Detection
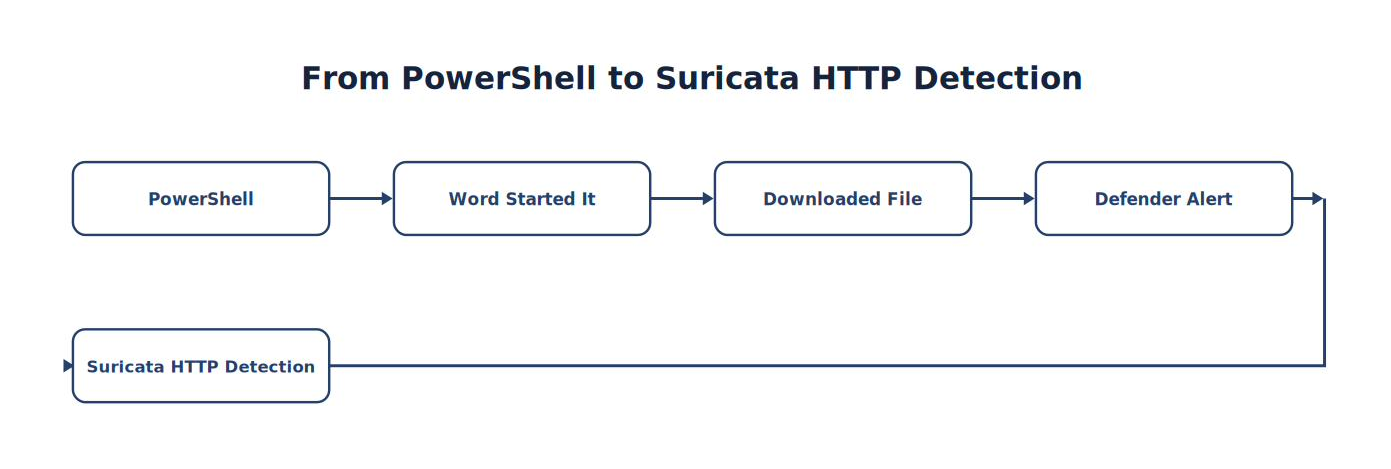
Note. The sequence traces how PowerShell progresses to Suricata HTTP Detection, emphasizing the intermediate evidence and processing steps.
Context transforms an isolated signal into meaningful evidence. Anchor it. Expand it. Corroborate it. Then decide.
Investigation Pivots
Do not stop at “What alert fired?” Use the alert as a pivot into surrounding evidence:
| Investigation question | Where to look | Concrete example |
|---|---|---|
| What happened before and afterward? | @timestamp, adjacent records, and Windows eventRecordID |
Expand the time range five minutes on each side of the PowerShell alert. |
| Has this occurred previously? | Same agent, user, process, or rule over a longer range | Search WIN11 for the same process during the last 30 days. |
| Which user was involved? | data.win.eventdata.targetUserName or subjectUserName |
Confirm whether the account was Administrator, a service account, or a student account. |
| Which systems communicated? | data.srcip, data.dstip, Windows network fields, or Suricata flow records |
Correlate the endpoint event with /var/log/suricata/eve.json. |
| Was a file created or downloaded? | Sysmon Event ID 11, browser/PowerShell telemetry, hashes, and destination paths | Look for a new file in C:\Users\<user>\Downloads and record its SHA-256 hash. |
| Did another control detect it? | Defender Operational log, Sysmon, Suricata, or proxy/DNS telemetry | Compare the Wazuh alert with Microsoft-Windows-Windows Defender/Operational. |
Begin a WIN11 PowerShell timeline with this DQL filter, then adjust the dashboard time selector around the alert's @timestamp:
Wazuh Dashboard · DQL filter
agent.name:"win11" AND data.win.eventdata.image:*powershell.exeThese pivots turn a single alert into an evidence-based investigation. Field availability depends on the source and decoder, so confirm the populated fields in the alert document.
Looking Ahead
The next section introduces the Discover interface, the most powerful investigative tool in Wazuh. Students will learn structured searches, field-based filtering, saved queries, search syntax, and investigative workflows that dramatically reduce the time required to analyze large volumes of telemetry. By mastering Discover, students will move beyond simply viewing alerts and begin conducting efficient, evidence-driven investigations worthy of a professional Security Operations Center analyst.
4.1 Mastering Discover — The Analyst’s Primary Investigation Tool
Learning Objectives
After completing this section, you should be able to:
Explain the purpose of the Discover interface.
Perform structured searches.
Use filters effectively.
Build complex search expressions.
Save frequently used searches.
Investigate alerts using field-based analysis.
Introduction
Imagine someone handed you a library containing ten million books.
Could you find one paragraph discussing a specific historical event?
Probably not.
Now imagine that same library had:
An index
A catalog
Subject headings
Keywords
Cross-references
Finding information becomes much easier. The Wazuh Discover interface serves exactly this purpose. It is the analyst’s search engine for security telemetry. Rather than browsing millions of events manually, Discover allows analysts to locate specific evidence within seconds.
What Is Discover?
Discover is the primary investigative workspace used to search indexed security telemetry (Wazuh, Inc., n.d.-a). Unlike the Security Events module, which emphasizes alerts, Discover provides direct access to the underlying event data.
Analysts use Discover to answer questions such as:
Which host generated this event?
Which user executed PowerShell?
Which process contacted this IP address?
When did the activity begin?
How many similar events occurred?
Has this behavior occurred before?
These questions cannot usually be answered by looking at a single alert.
Figure 4-4
The Discover Workflow
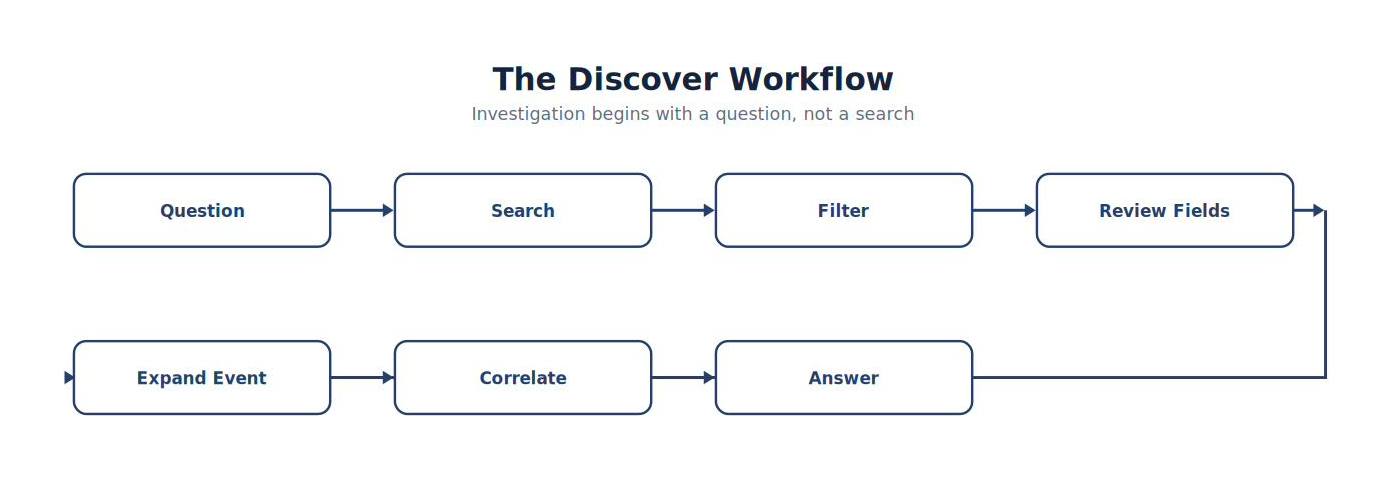
Note. The workflow presents the ordered stages of the Discover Workflow and highlights the validation and feedback steps that make the process repeatable.
Notice that the investigation begins with a question, not with a search.
Opening Discover
UI ACTION · WAZUH DASHBOARD
Path: ☰ Menu → Explore → Discover
Expected: The Discover workspace opens and displays recent indexed events.
The screen displays recent indexed events. Initially, this can appear overwhelming. Thousands—or even millions—of events may be visible. Do not attempt to read everything. Instead, begin reducing the data.
Understanding the Discover Layout
The interface is organized into several logical areas.
| Area | Purpose | Example use / DQL |
|---|---|---|
| Search Bar | Runs a DQL expression across the selected data view. | agent.name:"win11" AND rule.level >= 7 |
| Time Selector | Defines the investigation window before the query runs. | Select Last 24 hours before reviewing the day's alerts. |
| Available Fields | Shows fields present in the matching documents. | Inspect rule.id, then query rule.id:5710. |
| Event List | Displays records matching the query and time range. | Sort by @timestamp descending to see the newest evidence first. |
| Expanded Document | Shows the complete field structure and original event. | Confirm whether the user is stored in data.win.eventdata.targetUserName before filtering. |
| Filter Controls | Adds or excludes a selected field value without retyping the query. | Include agent.name:win11, then exclude a known test account if justified. |
Each area contributes to the investigative process.
Figure 4-5
Discover Layout
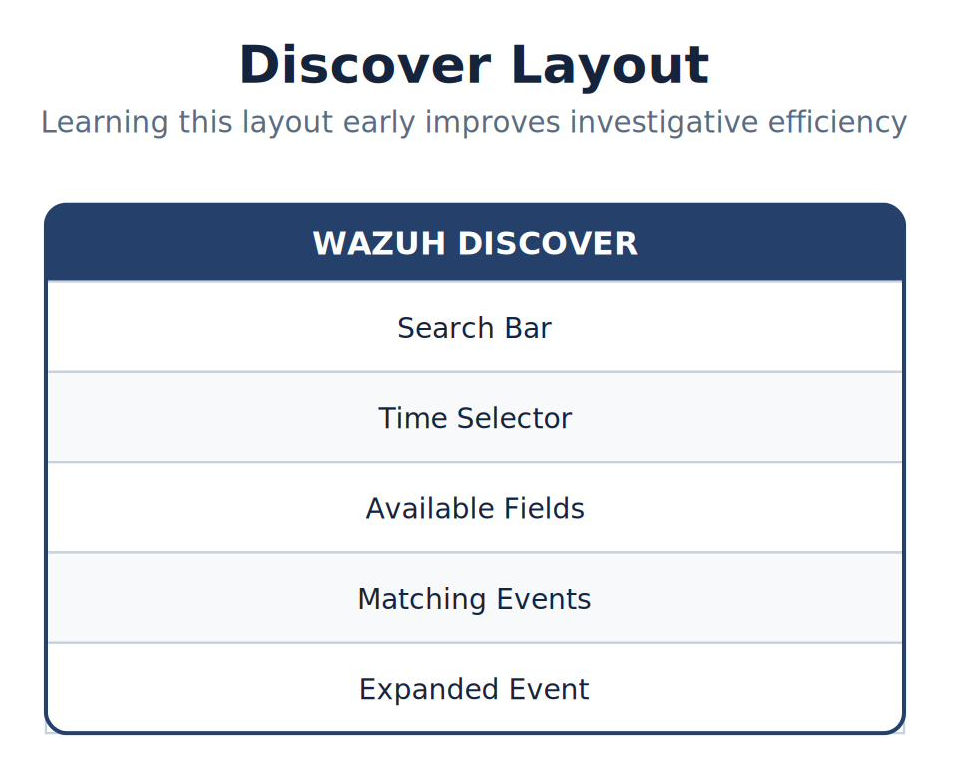
Note. The figure summarizes discover Layout and highlights the relationships among its principal elements, evidence sources, and analytical outcomes.
Learning this layout early significantly improves investigative efficiency.
Step One — Limit the Time Range
Before searching, reduce the investigation window. A 30-day range may return hundreds of thousands of events, while the last 15 minutes may contain only a few dozen.
UI ACTION · WAZUH DASHBOARD
Select: Time selector → Last 15 minutes
Expected: The event list refreshes and the displayed event count decreases.
Analyst Tradecraft Tip
Reduce the time range first. Then search. Not the other way around.
Step Two — Search for a Host
Suppose we investigate the Windows workstation. Apply a field-specific filter:
Wazuh Dashboard · DQL filter
agent.name:"win11"Immediately, all unrelated systems disappear. The investigation now focuses only on the endpoint of interest.
Step Three — Narrow Further
Add the process condition to the existing host filter:
Wazuh Dashboard · DQL filter
agent.name:"win11" AND data.win.eventdata.image:*powershell.exeThe result set becomes even smaller. Good investigations progressively reduce noise.
Figure 4-6
Progressive Filtering
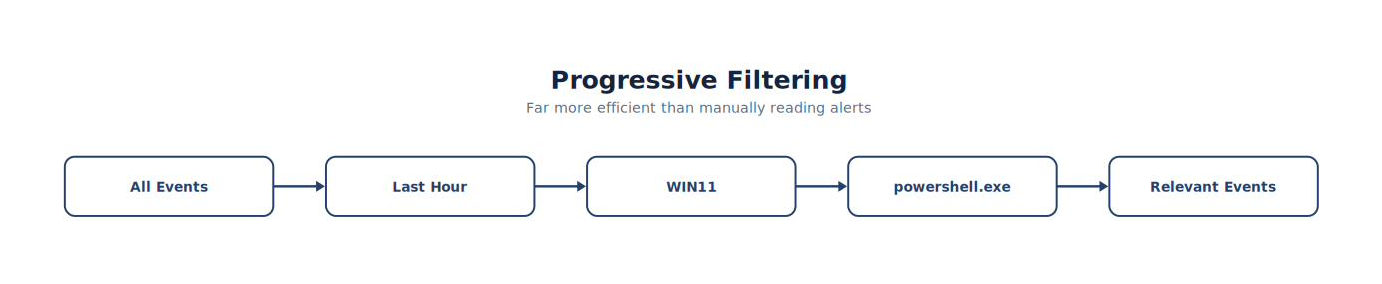
Note. The figure summarizes progressive Filtering and highlights the relationships among its principal elements, evidence sources, and analytical outcomes.
This approach is dramatically more efficient than manually reading alerts.
Searching Common Fields
During investigations, analysts repeatedly search the same types of information.
Examples include:
| Search | Example value | Example DQL |
|---|---|---|
| Hostname | WIN11 | data.win.system.computer:"WIN11" |
| Wazuh agent | win11 | agent.name:"win11" |
| Username | Student | data.win.eventdata.targetUserName:"Student" |
| Process | powershell.exe | data.win.eventdata.image:*powershell.exe |
| IP address | 192.168.1.40 | data.win.eventdata.ipAddress:"192.168.1.40" |
| Rule ID | 5710 | rule.id:5710 |
| Event ID | 22 | data.win.system.eventID:22 |
| SHA-256 hash | 275a021bbfb6489e54d471899f7db9d1663fc695ec2fe2a2c4538aabf651fd0f | data.win.eventdata.hashes:*275a021bbfb6489e54d471899f7db9d1663fc695ec2fe2a2c4538aabf651fd0f* |
| File name | invoice.docm | data.win.eventdata.targetFilename:*invoice.docm |
These searches form the foundation of nearly every investigation.
Combining DQL Conditions
DQL Boolean operators are case-insensitive, so AND and and are equivalent. This textbook capitalizes the operators to make query logic easier to distinguish from field names and values.
| Operator | Purpose | Example DQL |
|---|---|---|
AND |
Returns events that satisfy every condition. | agent.name:"win11" AND rule.level >= 7 |
OR |
Returns events that satisfy either condition. | agent.name:"win11" OR agent.name:"u2604" |
NOT |
Excludes events that satisfy the following condition. | agent.name:"win11" AND NOT rule.groups:"authentication_failures" |
| Parentheses | Groups conditions and controls their evaluation order. | (agent.name:"win11" OR agent.name:"u2604") AND rule.level >= 7 |
DQL evaluates NOT before AND, and AND before OR. Use parentheses whenever the intended grouping might be unclear.
Understanding Fields
Every event contains numerous individual fields.
Examples include:
| Field | Description |
|---|---|
| agent.name | Reporting system |
| rule.level | Alert severity (0–15 scale; see Section 2.5) |
| rule.id | Detection rule |
| event.module | Event source |
| data.win.eventdata.image | Executable path |
| data.srcip | Source address (Suricata) |
| data.dstip | Destination address (Suricata) |
Think of fields as columns in a database. Note that the field names shown in Discover are Wazuh’s indexed paths (for example, data.srcip), which differ from the raw field names inside Suricata’s eve.json (src_ip). Section 2.9 introduced these indexed paths; always search using the indexed name shown when you expand an event. Searching fields is far more precise than searching raw text.
Analyst Tradecraft Tip
Beginning analysts often search entire log messages. Experienced analysts search fields.
Why?
Because fields are structured.
Searching:
src_ip = 192.168.1.40 is much more reliable than searching every line for:
192.168.1.40
Structured searching produces cleaner investigations.
Expanding an Event
Every event can be expanded. When expanded, additional information becomes available.
Examples include:
Full JSON record
Event timestamp
Agent metadata
Rule information
Network information
Process details
Parent process
Command line
User information
Always expand important alerts. The summary rarely tells the entire story.
Example Investigation
Suppose the following alert appears.
Suspicious PowerShell
Expand the event.
Now ask:
Which executable started PowerShell?
Which user executed it?
What command line was used?
What process was the parent?
Was a network connection established?
Did Sysmon log additional activity?
Notice how one alert generates many investigative questions.
Searching by Rule ID
Every Wazuh alert contains rule.id. Pivoting on that field reveals similar alerts, previous occurrences, historical frequency, and other affected systems.
Wazuh Dashboard · DQL filter
rule.id:5710Expected: Results contain only alerts generated by rule 5710. Add agent.name or shorten the time range when the result remains too broad.
Field Pinning
Pin frequently used fields so evidence remains visible in the results table:
| Evidence | Useful field | Observable result |
|---|---|---|
| Endpoint | agent.name |
win11 |
| User | data.win.eventdata.targetUserName |
Administrator |
| Source address | data.srcip or data.win.eventdata.ipAddress |
192.168.1.40 |
| Process | data.win.eventdata.image |
powershell.exe |
| Detection | rule.id |
5710 |
UI ACTION · WAZUH DASHBOARD
Action: Expand a matching event → locate a populated field → select Add column.
Expected: The field appears as a column for every visible result, reducing repetitive event expansion.
Saving Searches
Professional analysts rarely perform identical searches repeatedly. Instead, they save commonly used searches.
Examples include:
| Saved search | Primary field or artifact | Purpose |
|---|---|---|
| Sysmon Process Creation | data.win.system.eventID = 1 |
Process, parent, command line, and user |
| Sysmon DNS Queries | data.win.system.eventID = 22 |
Domain lookups associated with a process |
| Suricata Alerts | rule.groups / /var/log/suricata/eve.json |
Network detections and flow context |
| PowerShell Activity | data.win.eventdata.image |
PowerShell execution on selected endpoints |
| Defender Events | Defender Operational channel | Malware detections and remediation status |
Saved searches improve consistency across investigations.
Common Student Mistake
Students often stop after a broad search returns thousands of results. Professional analysts reduce the time range, anchor the endpoint, and add one evidentiary condition at a time.
Wazuh Dashboard · DQL filter
agent.name:"win11" AND data.win.eventdata.image:*powershell.exeUse the time selector to limit this filter to the last 30 minutes. Expected: unrelated endpoints and non-PowerShell events disappear; if the result is empty, verify the time range and inspect a known event for the populated process field.
Chapter Exercise 4.1
UI ACTION · WAZUH DASHBOARD
Path: Discover → Time selector → Last hour
Expected: The event list refreshes to show only the previous hour.
Locate Sysmon process-creation events on WIN11:
Wazuh Dashboard · DQL filter
agent.name:"win11" AND data.win.system.eventID:1Expand one result and record the following in your SOC Engineering Notebook:
| Record | Field or artifact | What success looks like |
|---|---|---|
| Parent process | data.win.eventdata.parentImage |
A full executable path, not an assumption |
| Command line | data.win.eventdata.commandLine |
The executable plus available arguments |
| User | data.win.eventdata.user or populated user field |
Account associated with execution |
| Time | @timestamp |
Timestamp with its time-zone context |
| Follow-on DNS | Sysmon Event ID 22 | A query after process creation, if one occurred |
| Network corroboration | /var/log/suricata/eve.json or indexed Suricata alert |
Related flow/alert sharing a host, address, or time window |
Results will vary. A valid result records what was observed—including “no corroborating event found”—and the time range and filters used.
Analyst Tradecraft Tip
When using Discover, remember:
You are not searching for alerts. You are searching for evidence. Alerts are merely one form of evidence. The real objective is to reconstruct what happened, using structured telemetry collected from multiple sources.
Chapter Connection
By mastering Discover, students gain the ability to efficiently navigate millions of security events without becoming overwhelmed. In the next section, we build upon this skill by introducing timeline analysis—the process of arranging events chronologically to reconstruct attacker behavior. Students will learn that effective investigations depend not only on identifying individual events, but on understanding the sequence in which they occurred. This shift from isolated events to coherent timelines is one of the defining skills of a professional SOC analyst.
4.2 Timeline Analysis — Reconstructing Security Events
Learning Objectives
After completing this section, you should be able to:
Explain the importance of chronological analysis.
Build investigative timelines using Wazuh.
Correlate events from multiple telemetry sources.
Distinguish cause from effect.
Identify precursor, primary, and follow-on events.
Document investigative timelines suitable for incident reports.
Introduction
Imagine watching only five random frames from a two-hour movie.
Could you explain the plot?
Probably not. Cybersecurity investigations are no different. Individual alerts are like individual movie frames.
Useful?
Yes.
Sufficient?
No. Professional investigators reconstruct the entire sequence of events.
They ask:
What happened first?
What happened next?
What triggered the alert?
What happened afterward?
What evidence supports each step?
Only then do they determine whether an incident occurred.
Security Events Occur in Sequences
Attackers rarely perform only one action. Intrusions develop through connected stages: an initial foothold enables credential access; credentials enable movement; movement enables collection; and collection enables impact or exfiltration. Each stage changes the meaning of the events around it. A successful login may appear routine until it is connected to a new device, unusual discovery commands, remote execution, and access to sensitive systems.
Analyst mantra: One event is a clue. A sequence explains the intrusion.
The 2013 Target breach illustrates why analysts must reconstruct chains rather than judge events in isolation. A U.S. Senate staff analysis described a likely sequence beginning with phishing against a third-party HVAC vendor, followed by theft or misuse of vendor credentials, entry into Target's environment, movement toward payment systems, installation of point-of-sale malware, and collection and exfiltration of payment-card data. The report also identified opportunities to interrupt the intrusion at multiple stages, demonstrating that a breach is not one detection failure but a series of missed or unconnected signals (U.S. Senate Committee on Commerce, Science, and Transportation, 2014).
| Chain stage | Evidence an analyst might correlate | Why the connection matters |
|---|---|---|
| Vendor compromise | Phishing message, malicious attachment, endpoint detection, credential use | Establishes how trusted access may have been obtained. |
| Initial access | Vendor login, new source address, unusual time, first-seen device | Distinguishes routine vendor activity from anomalous access. |
| Discovery and movement | Authentication bursts, remote-service use, administrative commands, connections to new internal systems | Shows the actor expanding beyond the initial account or host. |
| Malware deployment | New services, file creation, process execution, persistence artifacts | Connects access to an operational capability on targeted systems. |
| Collection and exfiltration | Staging files, repeated outbound connections, unusual destinations, transfer volume | Connects compromise activity to business impact and data loss. |
The exact telemetry varies by environment, but the tradecraft does not: order events by time, preserve the identity and system involved at each step, and require evidence for every link. A gap in the chain is not permission to invent a step; it is a clearly stated investigative question.
The following course example applies the same reasoning to a phishing-to-exfiltration sequence:
Figure 4-7
From Phishing Email to Data Exfiltration
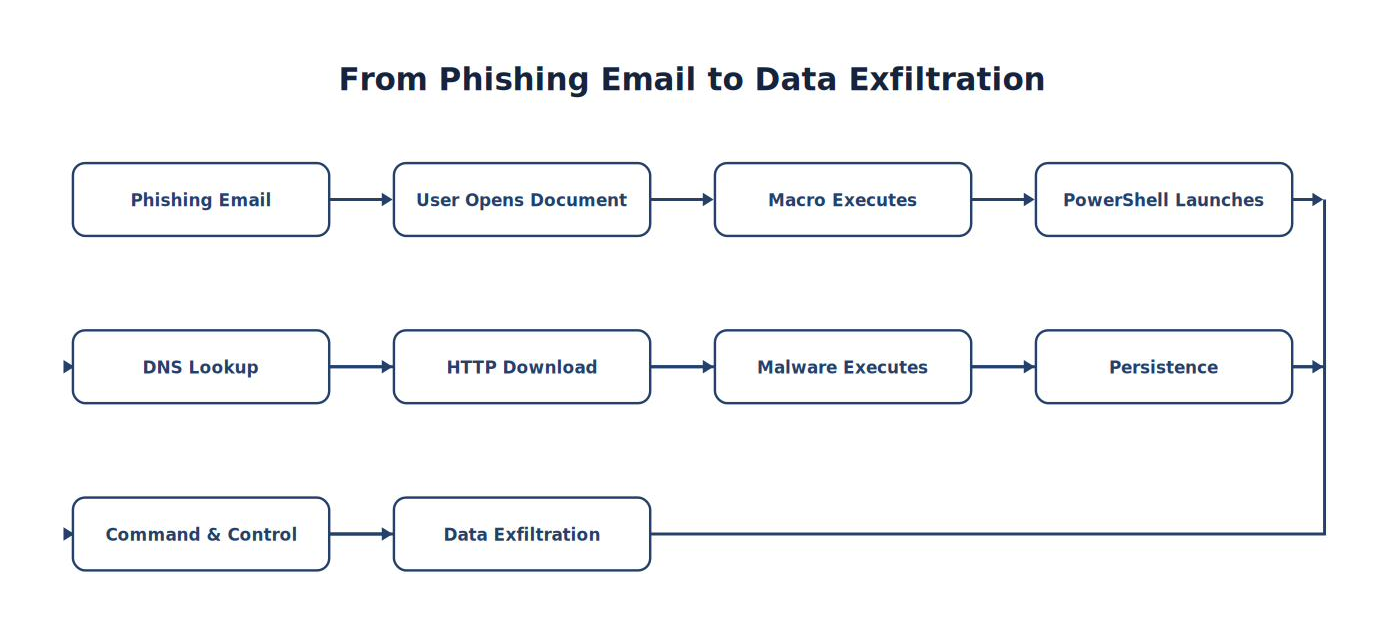
Note. The sequence traces how Phishing Email progresses to Data Exfiltration, emphasizing the intermediate evidence and processing steps.
Each step produces telemetry. Your job is to reconstruct that sequence.
Figure 4-8
Timeline Thinking
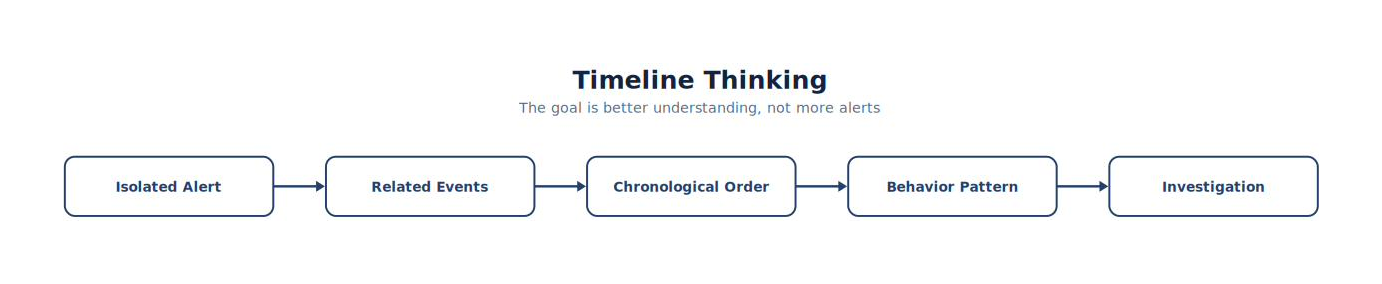
Note. The timeline places the events associated with timeline Thinking in chronological order to support reconstruction, correlation, and defensible conclusions.
Why Time Matters
Suppose you observe:
PowerShell
DNS Query
Defender Alert
Which happened first?
Without timestamps, you cannot know. Order changes meaning. Consider these two examples.
Timeline A
Figure 4-9
From PowerShell to Defender Detection
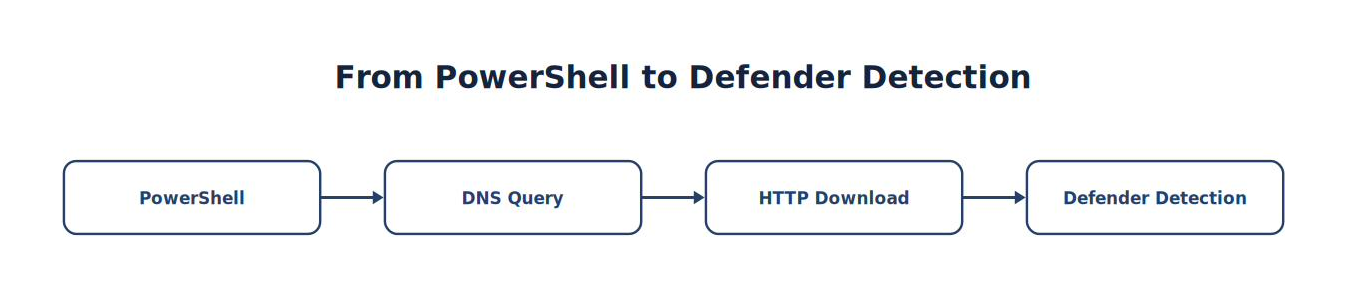
Note. The sequence traces how PowerShell progresses to Defender Detection, emphasizing the intermediate evidence and processing steps.
Possible interpretation:
PowerShell initiated suspicious network activity.
Timeline B
Figure 4-10
From Defender Detection to Update Service
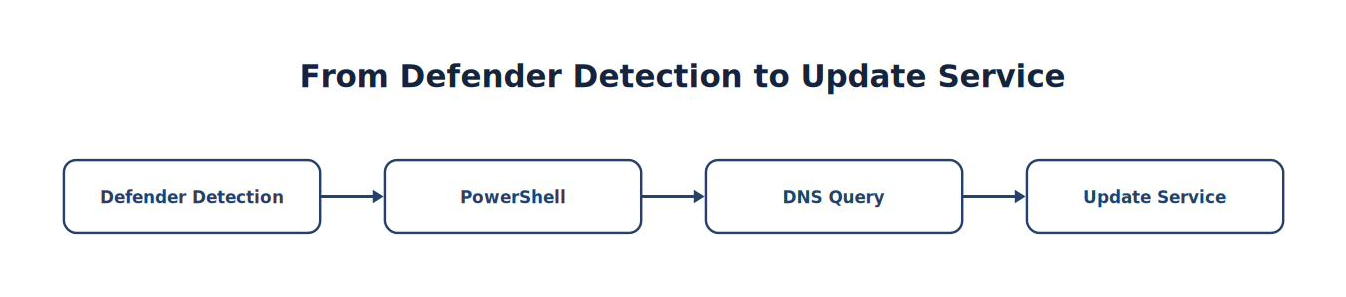
Note. The sequence traces how Defender Detection progresses to Update Service, emphasizing the intermediate evidence and processing steps.
Possible interpretation:
Administrator verified a Defender detection. Exactly the same events. Completely different conclusions.
Analyst Tradecraft Tip
Chronology constrains the story.
Record source timestamps, time zones, and collection delays before drawing conclusions.
Building a Timeline
Every investigation should answer five questions.
| Question | Purpose | PowerShell / Windows events | Bash / Linux logs | Dashboard DQL |
|---|---|---|---|---|
| What happened? | Describe the activity. | Get-WinEvent -FilterHashtable @{LogName='Microsoft-Windows-Sysmon/Operational'; Id=1} -MaxEvents 20 |
`sudo jq -c 'select(.event_type=="alert") | {timestamp,src_ip,dest_ip,alert}' /var/log/suricata/eve.json` |
| When? | Establish chronology. | `Get-WinEvent -LogName System -MaxEvents 50 | Sort-Object TimeCreated` | `sudo jq -r '[.timestamp,.event_type,.src_ip,.dest_ip] |
| Where? | Identify affected systems. | `Get-WinEvent -LogName System -MaxEvents 20 | Select-Object TimeCreated,MachineName,Id` | `sudo grep -E 'wazuh-agent |
| Who? | Identify users or processes. | Get-WinEvent -FilterHashtable @{LogName='Security'; Id=4688} -MaxEvents 20 |
`sudo jq -c 'select(.event_type=="flow") | {timestamp,src_ip,src_port,dest_ip,dest_port,proto}' /var/log/suricata/eve.json` |
| Why? | Develop an evidence-supported explanation. | `Get-WinEvent -FilterHashtable @{LogName='Microsoft-Windows-Sysmon/Operational'; Id=1,3,22} -MaxEvents 100 | Sort-Object TimeCreated` | `sudo grep -Ei 'error |
In PowerShell, Get-WinEvent reads Windows event logs, -FilterHashtable filters at the source, -LogName selects a channel, Id selects event IDs, and -MaxEvents limits output. In Bash, sudo supplies permission to read protected logs, jq -c selects and compacts JSON records, jq -r emits raw text, grep -E enables grouped alternatives, grep -i ignores letter case, and sort orders the extracted lines. Replace the example time window and field values with evidence from the initial alert.
Notice that “Why?” comes last. Evidence must precede explanation. Dashboard searching and timeline construction support examination and analysis; when an investigation requires formal acquisition or preservation, follow the evidence-handling process in Chapter 7.
Step One — Select the Initial Alert
Suppose Wazuh reports:
Suspicious PowerShell Execution
Record:
Timestamp
Host
User
Rule ID
Severity
This becomes the anchor point.
Step Two — Expand the Time Window
Never investigate only the alert itself. Expand the time window.
Example:
15 Minutes Before → Alert → 15 Minutes After
Now additional activity becomes visible.
Step Three — Identify Related Events
Search for activity involving:
Same hostname
Same user
Same process
Same IP address
Same timeframe
Avoid introducing unrelated systems too early.
Figure 4-11
Timeline Expansion
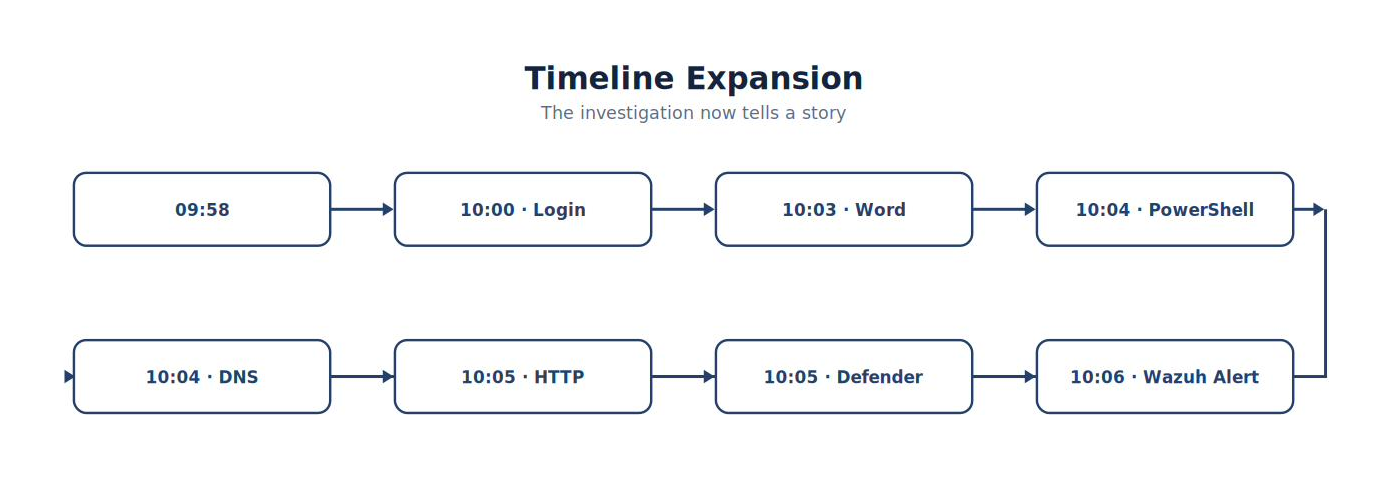
Note. The timeline places the events associated with timeline Expansion in chronological order to support reconstruction, correlation, and defensible conclusions.
The labels in the figure are hypotheses until the underlying records support them. The following examples show the artifact expected at each point and one way to locate it. Event availability depends on the laboratory configuration and enabled audit sources.
| Time / activity | Representative artifact | Evidence source | Command to locate it | Example DQL |
|---|---|---|---|---|
| 09:58 — File arrives | Sysmon Event ID 11 showing invoice.docm created on WIN11. |
Sysmon Operational log | Get-WinEvent -FilterHashtable @{LogName='Microsoft-Windows-Sysmon/Operational'; Id=11} -MaxEvents 50 |
agent.name:"win11" AND data.win.system.eventID:11 AND data.win.eventdata.targetFilename:*invoice.docm |
| 10:00 — Login | Security Event ID 4624 with the account, logon type, source address, and logon ID. | Windows Security log | Get-WinEvent -FilterHashtable @{LogName='Security'; Id=4624} -MaxEvents 50 |
agent.name:"win11" AND data.win.system.eventID:4624 |
| 10:03 — Word starts | Sysmon Event ID 1 with WINWORD.EXE, its parent process, user, and command line. |
Sysmon Operational log | Get-WinEvent -FilterHashtable @{LogName='Microsoft-Windows-Sysmon/Operational'; Id=1} -MaxEvents 100 |
agent.name:"win11" AND data.win.eventdata.image:*WINWORD.EXE |
| 10:04 — PowerShell starts | Sysmon Event ID 1 showing powershell.exe with WINWORD.EXE as the parent. |
Sysmon Operational log | Get-WinEvent -FilterHashtable @{LogName='Microsoft-Windows-Sysmon/Operational'; Id=1} -MaxEvents 100 |
agent.name:"win11" AND data.win.eventdata.image:*powershell.exe AND data.win.eventdata.parentImage:*WINWORD.EXE |
| 10:04 — DNS lookup | Sysmon Event ID 22 with the querying process and domain. | Sysmon Operational log | Get-WinEvent -FilterHashtable @{LogName='Microsoft-Windows-Sysmon/Operational'; Id=22} -MaxEvents 100 |
agent.name:"win11" AND data.win.system.eventID:22 |
| 10:05 — HTTP request | An event_type of http with source/destination addresses, hostname, URL, method, and user agent. |
Suricata eve.json |
`sudo jq -c 'select(.event_type=="http") | {timestamp,src_ip,dest_ip,http}' /var/log/suricata/eve.json` |
| 10:05 — Defender detection | Defender Event ID 1116 naming the detected threat, affected path, user, and process. | Defender Operational log | Get-WinEvent -FilterHashtable @{LogName='Microsoft-Windows-Windows Defender/Operational'; Id=1116} -MaxEvents 20 |
agent.name:"win11" AND data.win.system.eventID:1116 |
| 10:06 — Wazuh alert | Indexed alert containing the rule ID, rule level, agent, timestamp, and decoded source fields. | Wazuh index / dashboard | `sudo grep -E 'win11 | invoice.docm' /var/ossec/logs/alerts/alerts.json` |
Apply a narrow time selector around 09:58–10:06, open each matching record, and copy its actual timestamp and identifiers into the timeline. Do not treat the example values as evidence from the student’s system.
Event Categories
As timelines become larger, group similar events together. Windows sources use numeric Event IDs, including native Windows events and the separate Sysmon channel. Linux Audit uses named record types rather than Windows-style Event IDs.
| Category | Examples | Windows / Sysmon identifiers | Linux Audit or network artifact |
|---|---|---|---|
| Authentication | Login, logoff | Security 4624 (successful logon), 4625 (failed logon), 4634 (logoff) | USER_LOGIN, USER_AUTH, USER_END |
| Process | Process creation and termination | Security 4688 (process creation); Sysmon 1 (create), 5 (terminate) | SYSCALL plus EXECVE, correlated by the audit event serial number |
| Network | DNS, HTTP, TCP | Sysmon 3 (network connection), 22 (DNS query) | Linux Audit is not a full network sensor; use Suricata eve.json records such as dns, http, flow, and alert |
| File activity | Create, overwrite, delete | Sysmon 11 (create), 23 or 26 (delete); Security 4663 when object auditing is enabled | SYSCALL plus PATH, correlated by the audit event serial number |
| Security software | Defender, Suricata | Defender Operational 1116 (detection), 1117 (action) | Suricata eve.json; Audit DAEMON_START and DAEMON_END describe audit-daemon state, not threat detections |
| Administrative | Service installation or state change | System 7036 (state change), 7045 (service installed); Security 4697 when enabled | SERVICE_START, SERVICE_STOP, CONFIG_CHANGE |
For example, retrieve Sysmon DNS records with Get-WinEvent -FilterHashtable @{LogName='Microsoft-Windows-Sysmon/Operational'; Id=22} -MaxEvents 50. On Ubuntu, search process executions with sudo ausearch -m SYSCALL,EXECVE -ts recent -i; -m selects record types, -ts recent limits the time range, and -i interprets numeric values. Search Suricata DNS records with sudo jq -c 'select(.event_type=="dns") | {timestamp,src_ip,dest_ip,dns}' /var/log/suricata/eve.json.
Grouping improves readability.
Identifying Cause and Effect
Students often confuse correlation with causation.
Suppose you observe:
PowerShell
DNS Query
HTTP Request
Did PowerShell cause the HTTP request?
Perhaps. Or perhaps another application generated it. Evidence determines causation. Chronology alone does not. Professional analysts remain cautious.
Multi-Source Correlation
One timeline should include all available telemetry. Record the source field or artifact that supports each row so the sequence can be reproduced (Wazuh, Inc., n.d.-a).
| Time | Source and event | Concrete field or artifact |
|---|---|---|
| 09:12:01 | Windows logon | Security Event ID 4624; target user and source address |
| 09:12:08 | Sysmon: Word started | Event ID 1; Image, ParentImage, and CommandLine |
| 09:12:12 | Sysmon: PowerShell started | Event ID 1; Word as parent and PowerShell as child |
| 09:12:14 | Sysmon: DNS query | Event ID 22; QueryName associated with PowerShell |
| 09:12:15 | Suricata: HTTP request | /var/log/suricata/eve.json; source, destination, host, and URL |
| 09:12:18 | Suricata: file transfer | fileinfo record; filename, size, and SHA-256 when available |
| 09:12:21 | Microsoft Defender detection | Defender Operational log; threat name, path, and action status |
| 09:12:22 | Wazuh alert | rule.id, rule.level, agent.name, and @timestamp |
Now the evidence spans four independent technologies. Confidence increases significantly.
Correlation becomes stronger when the analyst also asks what is normal for the specific user, host, and time period. A first-seen destination, an unusual parent-child process relationship, or an authentication event outside the user's established pattern can help prioritize an investigation, but deviation alone does not establish malicious intent. Treat the baseline as context, document the comparison period, and require corroborating evidence before reaching a conclusion. This behavior-aware approach adds meaning to technical artifacts while preserving the distinction between an observation and an assessed finding (Rich, 2026).
Recognizing Precursor Events
Not every important event triggers an alert. Many attacks begin with seemingly ordinary activity:
| Precursor | Example evidence |
|---|---|
| Successful login | Security Event ID 4624 from a new address or unusual time |
| USB insertion | Device-installation log plus a newly mounted volume |
| Office document opened | Office process creation and a recent .docm file path |
| Browser started | Sysmon Event ID 1 with user, parent, and command line |
| Scheduled task created | Security Event ID 4698 and the task XML/action |
These events provide context. They often explain later detections.
Primary Events
Primary events represent the activity being investigated:
| Primary activity | Concrete evidence |
|---|---|
| PowerShell execution | Sysmon Event ID 1 with encoded or download-related arguments |
| Privilege escalation | New privileged logon or token, correlated with the initiating process |
| Malware execution | Process path/hash plus Defender or another independent detection |
| Port scan | Many destination ports from one source within a short interval |
| Remote shell | Network connection followed by command-shell process creation |
| Credential dumping | Access to credential material plus the responsible process and account |
These typically trigger alerts.
Follow-On Events
After the primary activity, additional events frequently reveal intent:
| Follow-on event | Example evidence |
|---|---|
| New process | Sysmon Event ID 1 and the parent-child relationship |
| Registry modification | Sysmon Event IDs 12–14 and the modified key/value |
| DNS request | Sysmon Event ID 22 or DNS telemetry tied to the process/host |
| HTTP communication | Suricata http or flow record sharing the same endpoint and time window |
| Service installation | Windows System Event ID 7045 with service name and executable path |
| Scheduled task | Security Event ID 4698 with its trigger and action |
Following the timeline beyond the alert often reveals attacker objectives.
Figure 4-12
Attack Timeline
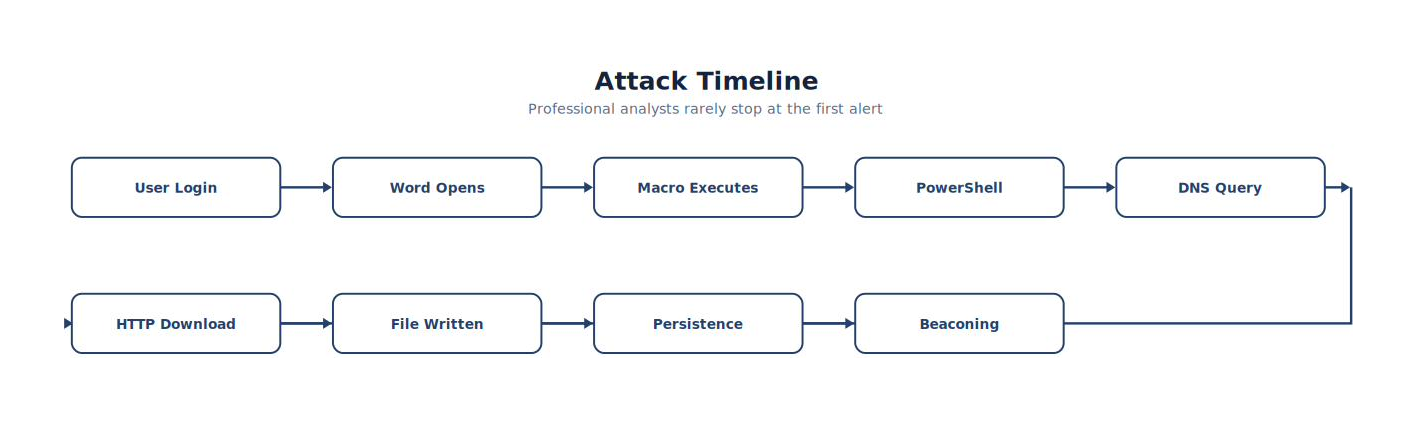
Note. The timeline places the events associated with attack Timeline in chronological order to support reconstruction, correlation, and defensible conclusions.
Professional analysts rarely stop at the first alert.
Visual Timeline Construction
When documenting investigations, consider visual timelines.
Example:
10:01 Login
Figure 4-13
Investigation Timeline — Endpoint Compromise
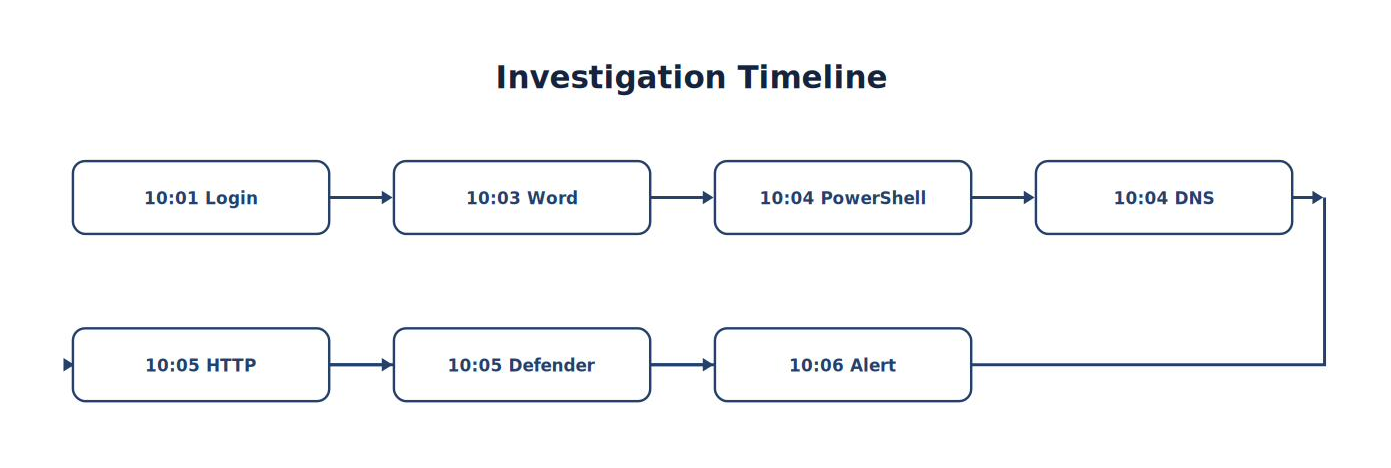
Note. The timeline places the events associated with investigation Timeline — Endpoint Compromise in chronological order to support reconstruction, correlation, and defensible conclusions.
Visual representations often communicate investigations more effectively than paragraphs.
Common Student Mistake
Students frequently investigate only the alert itself.
Professional analysts investigate:
Before the alert
During the alert
After the alert
Many important events occur outside the original detection window.
Analyst Tradecraft Tip
A useful rule of thumb:
For every alert, review at least:
15 minutes before
15 minutes after
Major incidents may require hours or even days of historical context.
Chapter Exercise 4.2
Generate a PowerShell event on your Windows endpoint.
Construct a timeline containing:
Login
Process creation
DNS activity
Network activity
Suricata detections
Windows Defender events
Wazuh alerts
Present the timeline as a table.
Then answer:
Which event occurred first?
Which event initiated the sequence?
Which events confirmed network activity?
Which security product first detected suspicious behavior?
What evidence supports your conclusion?
Analyst Tradecraft Tip
An alert is a photograph. A timeline is a documentary. Photographs capture moments. Documentaries explain stories. Your responsibility as an analyst is not merely to identify suspicious events. It is to reconstruct what happened with sufficient accuracy that another investigator could independently reach the same conclusion.
Looking Ahead
The next section introduces event correlation, one of the defining capabilities of a SIEM. Students will learn how Wazuh combines telemetry from Sysmon, Suricata, Windows Defender, Linux logs, and authentication events into a unified investigative picture. They will explore why isolated alerts are often misleading, how multiple independent data sources increase investigative confidence, and how correlation transforms raw telemetry into actionable intelligence suitable for incident response. This chapter builds directly upon timeline analysis and prepares students for increasingly realistic attack scenarios later in the textbook (Wazuh, Inc., n.d.-a).
4.3 Event Correlation — Combining Evidence into Intelligence
Learning Objectives
After completing this section, you should be able to:
Explain the concept of event correlation.
Differentiate between isolated events and correlated investigations.
Identify related telemetry across multiple security products.
Recognize confidence levels based on corroborating evidence.
Build evidence-supported incident conclusions.
Avoid common analytical mistakes when correlating events.
Introduction
Imagine asking five witnesses to describe the same automobile accident. Each person observed the event from a different location.
One witnessed:
- The collision.
Another saw:
- The traffic light.
Another noticed:
- The driver using a cellphone.
Another recorded:
- The license plate.
No single witness possesses the complete story. Together, they reconstruct the incident. Security telemetry works exactly the same way. Every security product observes the environment from a unique perspective. The analyst’s responsibility is to combine those observations into a coherent explanation. This process is called event correlation.
Why SIEM Exists
Many students ask:
“Why not just look directly at Sysmon?”
Or:
“Why not simply monitor Suricata?” Because neither provides complete visibility. Consider what each technology observes.
| Technology | Primary Visibility |
|---|---|
| Sysmon | Endpoint behavior |
| Windows Defender | Malware detection |
| Suricata | Network traffic |
| Linux Logs | Operating system activity |
| Wazuh | Correlation across all telemetry |
Notice something important. Every tool is incomplete by itself. Together, they provide significantly greater confidence.
Figure 4-14
Individual Visibility
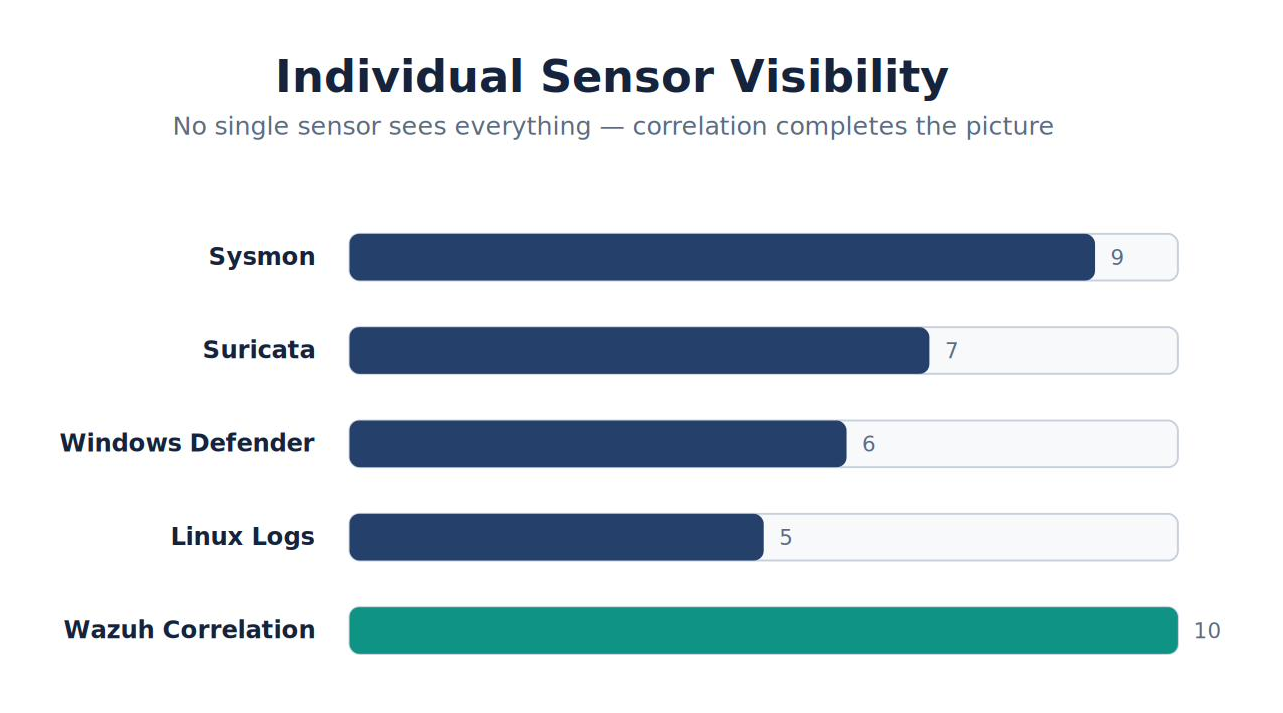
Note. The comparison highlights the operational differences represented by individual Visibility and shows why the distinction matters during analysis.
No single sensor sees everything.
Correlation Defined
Correlation is the process of identifying relationships among multiple security events.
Relationships may include:
Time
Host
User
Process
Network connection
File
Alert signature
Events become significantly more meaningful when considered together.
Example One — Single Event
Suppose Wazuh reports:
PowerShell Executed
Should you panic?
No. PowerShell executes legitimately thousands of times every day. One event alone provides little context.
Example Two — Correlated Events
Now consider:
Figure 4-15
From PowerShell to Suricata Alert
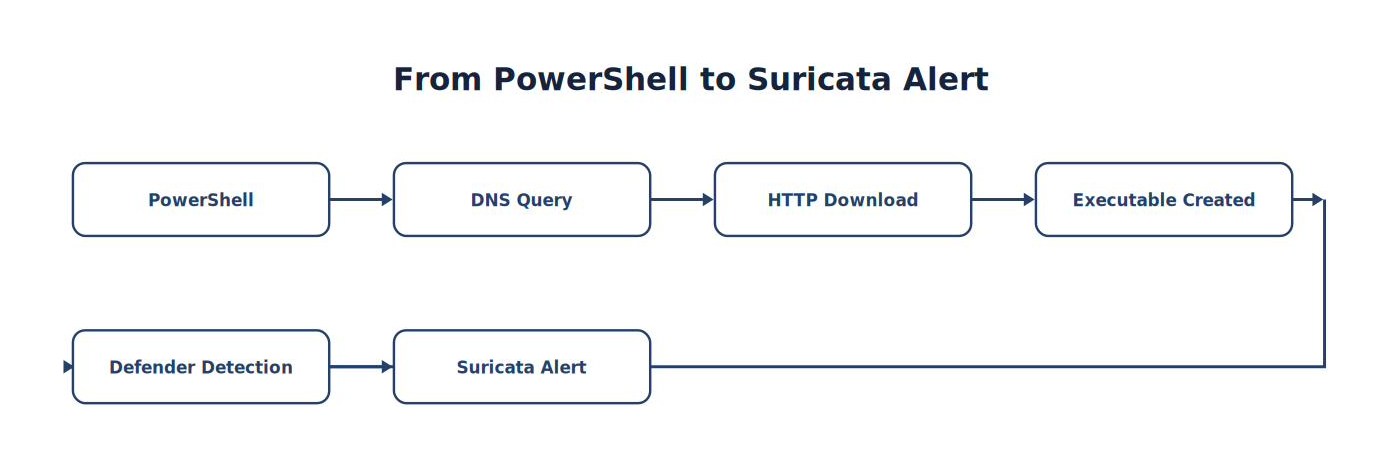
Note. The sequence traces how PowerShell progresses to Suricata Alert, emphasizing the intermediate evidence and processing steps.
Now we have evidence. The probability of malicious behavior increases dramatically. Nothing changed about the PowerShell event itself. What changed was the surrounding evidence.
Analyst Tradecraft Tip
Students often ask:
“How many alerts prove an attack?”
The answer is:
There is no magic number.
Professional analysts evaluate:
Quality
Timing
Context
Consistency
Confidence
Not simply quantity. Five unrelated alerts prove very little. Three strongly related alerts may justify incident response.
Correlation Dimensions
Analysts correlate events across several dimensions.
| Dimension | Guiding question | Compact example | Analytical value |
|---|---|---|---|
| Time | Did the events occur together? | 10:03 PowerShell → 10:04 DNS → 10:05 HTTP | Chronological proximity supports—but does not prove—a relationship. |
| Host | Did the same computer generate the events? | WIN11 in the Windows source records; win11 in agent.name |
A consistent endpoint narrows scope and reduces unrelated matches. |
| User | Did the same identity appear across the activity? | Student01 → local process execution → remote login |
Identity can connect events from different sources and systems. |
| Process | Did one executable launch another? | WINWORD.EXE → powershell.exe → cmd.exe |
Process ancestry exposes the execution chain and initiating application. |
| Network | Does endpoint activity align with network communication? | PowerShell → HTTP GET → Suricata alert | Independent endpoint and network sensors can corroborate one sequence. |
| File | Was a downloaded or created file later executed or detected? | Download → file creation → execution → Defender detection | Matching path, hash, and timestamps can connect delivery to execution and response. |
The user-correlation example is illustrated below.
Figure 4-16
From Student01 to Remote Login
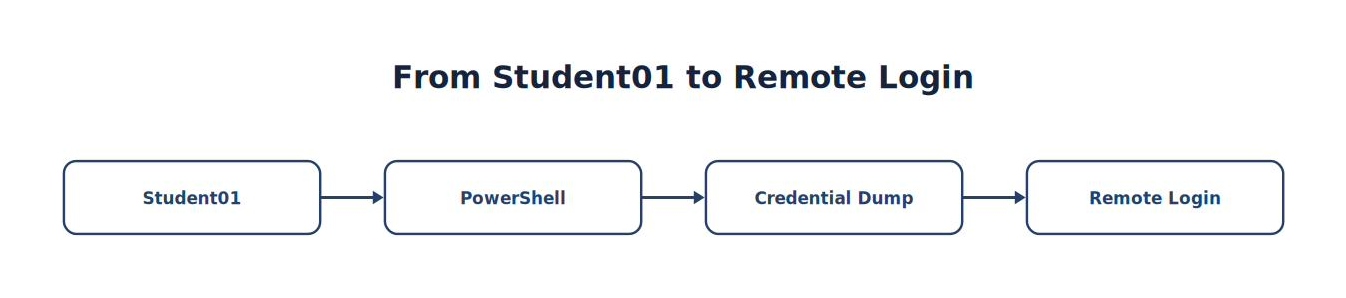
Note. The sequence traces how Student01 progresses to Remote Login, emphasizing the intermediate evidence and processing steps.
The file-correlation example is illustrated below.
Figure 4-17
From Download to Defender Detection
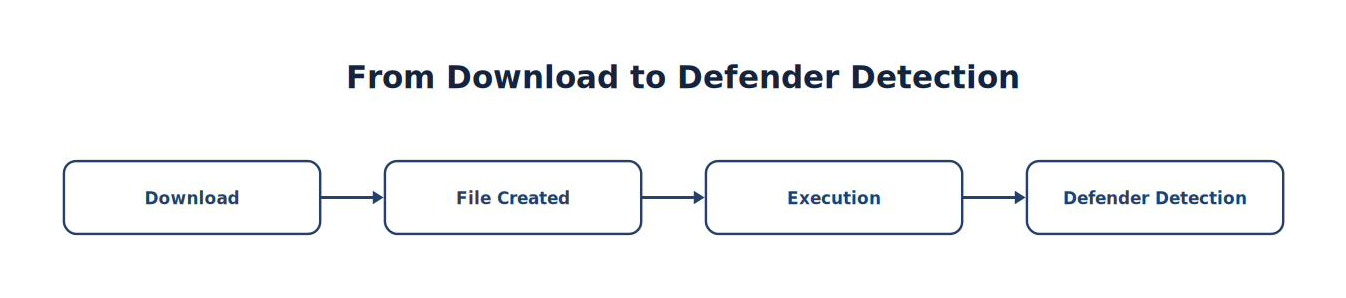
Note. The sequence traces how Download progresses to Defender Detection, emphasizing the intermediate evidence and processing steps.
Confidence Levels
Correlation increases confidence only when evidence is relevant, reliable, and sufficiently independent:
| Evidence accumulated | Example artifact | Working confidence |
|---|---|---|
| One PowerShell process event | Sysmon Event ID 1 for powershell.exe |
Low—the activity may be routine administration. |
| Process ancestry and suspicious arguments | WINWORD.EXE parent plus an encoded PowerShell command line |
Moderate—the execution pattern requires explanation. |
| Matching endpoint and network activity | Sysmon Event ID 22 plus a Suricata HTTP record to the same destination | High—the independent sensors describe one sequence. |
| File and security-control confirmation | Download hash/path plus a Defender detection or quarantine action | Higher—multiple artifacts connect execution to an identified file and response. |
Confidence is not a vote count. Three alerts derived from the same underlying sensor are repetition; endpoint, network, and security-control observations that agree are corroboration.
Figure 4-18
Confidence Pyramid
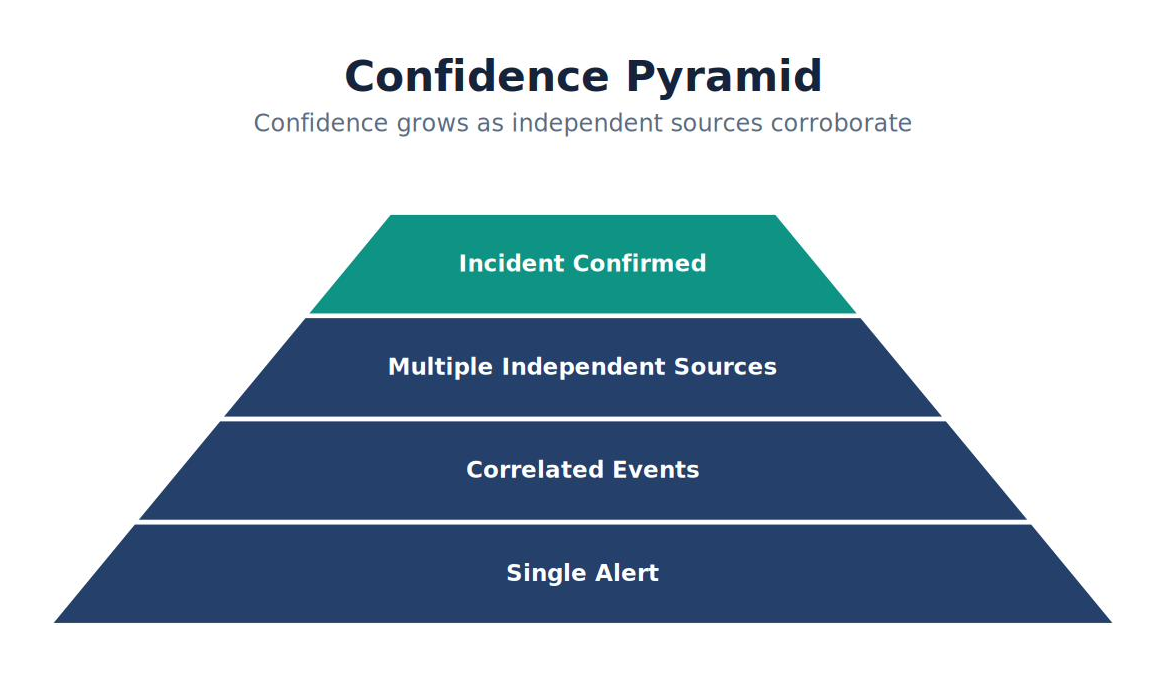
Note. The figure shows how confidence Pyramid narrows broad observations into prioritized evidence and increasingly confident analytical judgments.
Example Investigation: Suspicious PowerShell
| Question | Field or artifact | Observable evidence |
|---|---|---|
| Did PowerShell execute? | Sysmon Event ID 1; data.win.eventdata.image |
Full executable path and event timestamp |
| Who or what launched it? | ParentImage, User, and CommandLine |
Parent-child relationship and initiating account |
| Was DNS performed? | Sysmon Event ID 22; QueryName |
Domain queried by the same endpoint/process near the execution time |
| Was HTTP used? | /var/log/suricata/eve.json http/flow records |
Matching source, destination, host, URL, and time window |
| Was a file transferred? | Suricata fileinfo or endpoint file-creation telemetry |
Filename, destination path, size, and SHA-256 when available |
| Did Defender respond? | Defender Operational log | Threat name, affected path, and remediation/quarantine status |
| Did Wazuh correlate it? | rule.id, rule.level, agent.name, and @timestamp |
A Wazuh alert tied to the same host and sequence |
Every additional source increases confidence.
Correlation Matrix
The following matrix shows what each source contributes rather than implying that every source sees every activity:
| Activity | Primary artifact | Independent corroboration | Useful Wazuh pivot |
|---|---|---|---|
| PowerShell execution | Sysmon Event ID 1 | Defender or network activity near the same time | Process image, parent, user, and agent |
| DNS query | Sysmon Event ID 22 | Suricata DNS record | Query name, source, and timestamp |
| HTTP download | Suricata http and fileinfo records |
Endpoint file creation or Defender detection | Destination, URL, filename, and hash |
| Process tree | Sysmon parent/child fields | Related network or file activity | ParentImage, Image, and command line |
| Network scan | Suricata alert/flow pattern | Endpoint process and socket evidence | Source address, destination ports, and rule ID |
| Quarantine | Defender Operational event | Original process/file/network evidence | Threat, path, action status, and endpoint |
No technology stands alone.
Recognizing False Positives
Correlation also reduces false positives. A PowerShell event alone is ambiguous; test both supporting and contradicting evidence:
| Observation | Example | Effect on the hypothesis |
|---|---|---|
| Expected administrative context | Approved change window, known administrator, trusted script path | Supports a benign explanation. |
| Suspicious execution context | Office parent process, encoded command, unusual user or time | Supports further investigation. |
| Independent malicious evidence | New domain/HTTP destination, downloaded executable, Defender detection | Strengthens the malicious hypothesis. |
| No corroborating event | No matching network, file, or Defender record in the verified time window | Lowers confidence but does not prove the activity benign. |
| Visibility gap | Sensor unhealthy, wrong time range, or missing log source | Makes the absence inconclusive; repair visibility before deciding. |
Correlation works both ways: it can confirm a hypothesis or weaken it. Absence of evidence is useful only after the analyst verifies that the relevant sensor, field, and time range could have captured the activity.
Figure 4-19
Evidence-Based Alert Disposition Flow
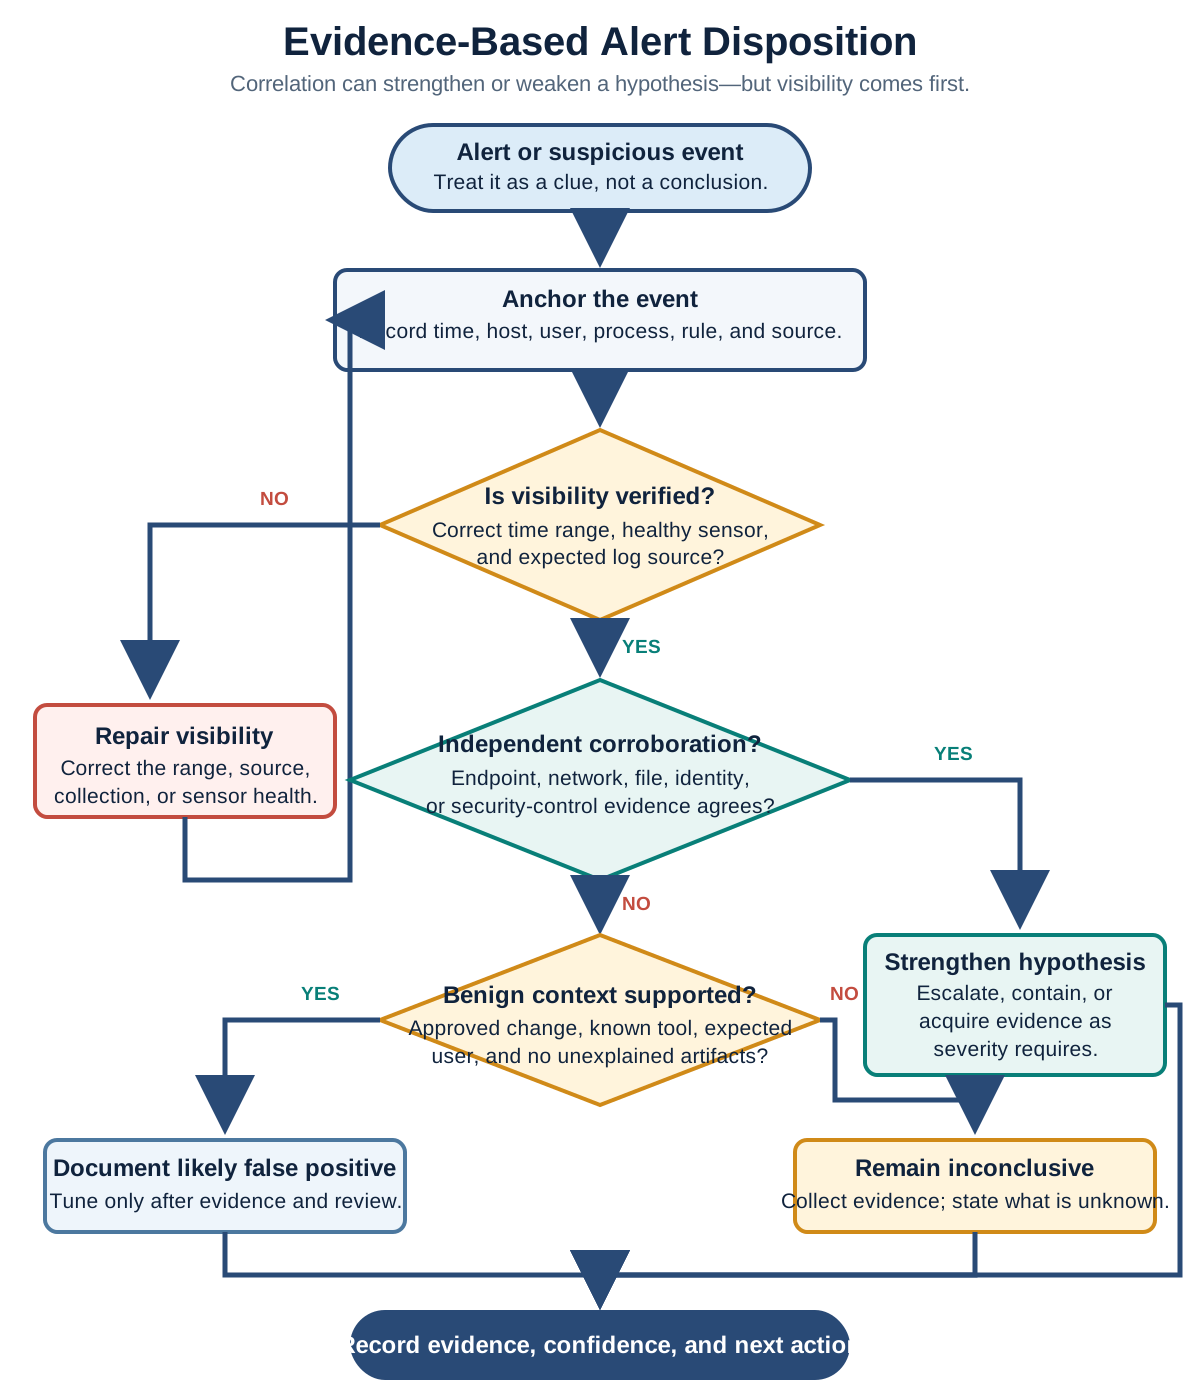
Note. The decision flow prevents analysts from labeling an event malicious or benign before verifying visibility, seeking independent corroboration, and evaluating supported benign context.
Common Student Mistake
Students frequently stop investigating once the first suspicious alert appears.
Professional analysts ask:
What other evidence supports this?
And equally important:
What evidence contradicts this?
Both questions matter.
Chapter Exercise 4.3
Generate a PowerShell session.
Then intentionally perform:
DNS lookup
Web request
File download
EICAR test
Document which technologies observed each action. Complete the following matrix.
| Action | Sysmon | Suricata | Defender | Wazuh |
|---|---|---|---|---|
| PowerShell | □ | □ | □ | □ |
| DNS | □ | □ | □ | □ |
| HTTP | □ | □ | □ | □ |
| File Download | □ | □ | □ | □ |
| Defender Detection | □ | □ | □ | □ |
Students should explain why each technology observed—or did not observe—each activity.
Analyst Tradecraft Tip
Correlation should involve independent evidence. Multiple alerts from the same sensor may indicate repetition; different sensors observing the same activity provide corroboration. Independent confirmation is one of the strongest foundations for investigative confidence.
Imagine an alert states:
“Potential Malware Download.”
Instead of asking:
Is this malware?
Ask:
Did the endpoint create a file?
Was the file executed?
Did Defender quarantine it?
Did the process establish outbound communications?
Did another endpoint contact the same destination?
Has this behavior occurred before?
Correlation transforms speculation into evidence-based conclusions.
Key Concepts
By the end of this section, you should understand that:
Correlation is the defining capability of a SIEM.
No single security technology provides complete visibility.
Independent evidence increases investigative confidence.
Correlation helps identify both true positives and false positives.
Strong investigations are built from multiple corroborating sources rather than isolated alerts.
Looking Ahead
The next section introduces hypothesis-driven investigations, where students move beyond reacting to alerts and begin developing structured investigative theories. They will learn to formulate hypotheses, gather supporting and contradictory evidence, test conclusions against available telemetry, and document findings using professional incident response methodology. This approach prepares students for real-world investigations where the answer is rarely obvious and evidence must be evaluated critically before conclusions are reached.
Analyst Checkpoint
4.4 Hypothesis-Driven Investigations
Learning Objectives
After completing this section, you should be able to:
Explain the concept of hypothesis-driven investigations.
Distinguish observations from assumptions.
Develop investigative hypotheses.
Gather supporting and contradictory evidence.
Evaluate competing explanations.
Reach defensible investigative conclusions.
Introduction
One of the greatest misconceptions about cybersecurity investigations is that alerts identify attacks. They do not. Alerts identify activity.
The analyst determines which explanation best fits the evidence:
| Possible explanation | Concrete example | Evidence that would help test it |
|---|---|---|
| Normal operation | PowerShell inventory script runs at 09:00 daily. | Known task name, approved script path/hash, expected service account, and historical recurrence |
| Administrative work | Administrator installs approved software. | Change ticket, interactive admin logon, trusted installer, and expected parent/child process chain |
| User error | User opens an unintended macro-enabled attachment. | Email/download origin, Office parent process, user account, and no persistence or follow-on activity |
| Software installation | Signed installer launches PowerShell as a helper. | Valid signature, vendor path, installation logs, and documented deployment window |
| Policy violation | User runs an unauthorized remote-access tool. | Application path/hash, network destination, user attribution, and policy reference |
| Malicious behavior | Office launches encoded PowerShell that downloads and executes a file. | Suspicious command line, DNS/HTTP telemetry, file hash, persistence, and independent detection |
Professional investigators avoid jumping directly to conclusions. Instead, they develop one or more hypotheses and systematically evaluate each using available evidence.
What Is a Hypothesis?
A hypothesis is a proposed explanation that can be tested using evidence (Heuer, 1999). Use competing hypotheses so the first plausible story does not become the conclusion:
| Hypothesis | Evidence that supports it | Evidence that weakens it |
|---|---|---|
| Malware launched PowerShell. | Office or unknown parent; encoded command; new external destination; downloaded file; persistence or Defender detection | Approved script, trusted parent, expected account, known destination, and no unexplained follow-on activity |
| An administrator installed software. | Change record; administrator logon; signed installer parent; expected path and time; matching installation log | No change record; unusual user/time; Office parent; obfuscated command; unexpected network/file activity |
Both explanations are initially possible. Record the exact field, artifact, and timestamp used to support or contradict each one. Evidence—not intuition—determines which hypothesis survives, and an unresolved gap must remain labeled as unknown.
Apply the evidence-based sequence in Figure 4-19: verify visibility, test more than one explanation, seek independent evidence, and place the conclusion last.
Observation Versus Conclusion
Students frequently confuse an observed fact with an explanation of that fact:
| Type | Statement | Why it is or is not defensible |
|---|---|---|
| Observation | Sysmon Event ID 1 records powershell.exe on WIN11 at 14:03:22. |
Verifiable from a named artifact and timestamp. |
| Unsupported conclusion | Malware executed. | No process ancestry, command line, file, network, or independent detection has been established. |
| Defensible interim assessment | PowerShell executed; intent and impact remain undetermined. | Separates the fact from the questions still requiring evidence. |
Observations describe what the evidence records. Conclusions explain what the observations mean. Preserve that boundary in notes and reports.
Analyst Tradecraft Tip
Whenever you write:
“The attacker…”
Pause.
Ask yourself:
What evidence proves there was an attacker?
If the answer is:
“The alert.” You have not completed the investigation.
Developing Multiple Hypotheses
Suppose you observe:
PowerShell → DNS → HTTP
Possible explanations include:
| Hypothesis | Evidence that would support it | Evidence that would weaken it |
|---|---|---|
| Malware | Office parent, encoded command, new domain, downloaded file, persistence, or Defender detection | Approved script/hash, expected user/time, and no unexplained follow-on activity |
| Administrator script | Admin account, known script path, change record, and expected destination | Student account, Office parent, obfuscation, or an unapproved destination |
| Software installer | Signed installer parent, installation logs, vendor domain, and approved window | Unknown parent/hash or persistence unrelated to the product |
| Student lab exercise | Class schedule, lab instructions, student account, and known test destination | Activity outside class, different account/host, or unexplained persistence |
| Automated update | Known service parent, scheduled task, vendor signature, and historical recurrence | Interactive Office parent, first-seen destination, or unexpected file behavior |
Professional analysts evaluate all reasonable explanations.
Step One — Record Observations
Write only what you know.
Record the fact and its source:
| Observation | Concrete evidence |
|---|---|
| PowerShell started. | Sysmon Event ID 1; Image and @timestamp |
| User was Student01. | Populated user field in the same process event |
| Parent was WINWORD.EXE. | ParentImage and parent process identifier |
| A DNS lookup occurred. | Sysmon Event ID 22; QueryName and process identifier |
| An HTTP request followed. | Suricata http/flow record sharing the host/address and time window |
Nothing more. No conclusions.
Step Two — Generate Explanations
Possible explanations:
Office macro.
Software installation.
Malware.
Administrative script.
Classroom exercise.
Avoid eliminating possibilities too early.
Step Three — Collect Supporting Evidence
Investigate each explanation with a question that points to evidence:
| Question | Where to look | Example result |
|---|---|---|
| Was Word expected? | User interview, class/change schedule, process history | Student01 opened an assigned .docx at 14:03. |
| Was a document opened? | Office recent-file evidence and process command line | Path points to C:\Users\Student01\Downloads\invoice.docm. |
| Was software being installed? | Installer logs, signature, parent process, change record | Signed vendor installer matches an approved deployment. |
| Did Defender detect or remediate a threat? | Defender Operational log | Threat name, affected path, and quarantine status are recorded. |
| Did Suricata observe a transfer? | /var/log/suricata/eve.json |
HTTP host/URL and fileinfo hash align with the endpoint timeline. |
| Was the activity scheduled? | Task Scheduler event/task XML and maintenance record | Known task executed at its documented time under the expected account. |
Evidence begins separating plausible explanations from unlikely ones.
Step Four — Seek Contradictory Evidence
This is where many investigations fail. Do not search only for evidence that supports your preferred explanation. Also search for evidence that disproves it.
Suppose your hypothesis is:
Malware executed.
Contradictory evidence might include Defender quarantining the file before execution, the user intentionally launching an approved installer, activity matching a scheduled maintenance window, or the SHA-256 matching approved software. Record the artifact that establishes each fact; an unsupported benign explanation is no better than an unsupported malicious one.
Contradictory evidence strengthens the investigation because it forces you to test your assumptions.
Figure 4-20
Hypothesis Testing
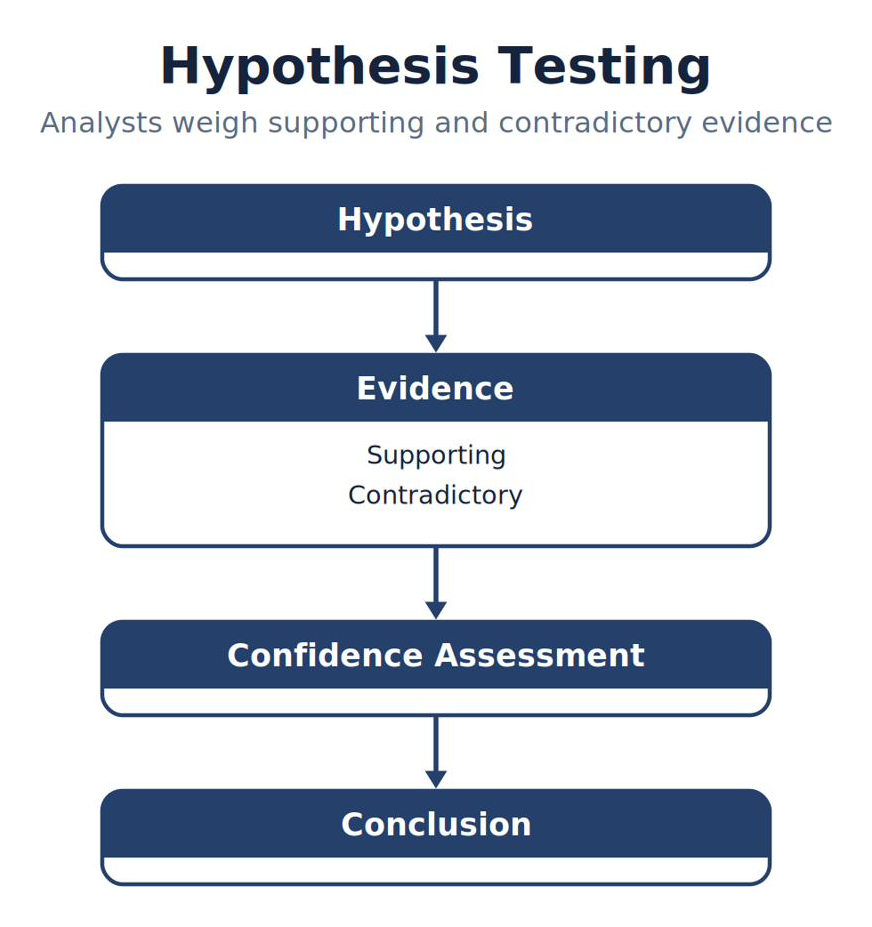
Note. The figure summarizes hypothesis Testing and highlights the relationships among its principal elements, evidence sources, and analytical outcomes.
Confidence Levels
Investigations rarely end with absolute certainty. Instead, analysts express confidence.
Example:
| Confidence | Evidence pattern | Example analyst wording |
|---|---|---|
| Low | One ambiguous event or major visibility gaps | “PowerShell execution is confirmed; intent is unknown.” |
| Moderate | Process context plus one relevant supporting artifact | “Activity is suspicious because Word launched encoded PowerShell; network impact is not established.” |
| High | Independent endpoint and network/file evidence agrees | “Evidence strongly supports a malicious download sequence on WIN11.” |
| Very high | Corroboration across technologies with identity, file, and impact established | “Multiple independent artifacts establish execution, communication, file identity, and remediation.” |
Confidence communicates uncertainty honestly.
Example Investigation
| Stage | Evidence | Effect on assessment |
|---|---|---|
| Observation | Word launched PowerShell; DNS and HTTP followed. | Establishes a sequence, not malicious intent. |
| Supporting | Suricata recorded an executable transfer; Defender identified the file as a Trojan. | Strongly supports a malicious-download hypothesis. |
| Contradictory/limiting | No persistence was found and Defender quarantined the file immediately. | Limits the supported impact; compromise beyond the blocked file is not established. |
| Revised conclusion | Malicious download activity occurred and endpoint protection quarantined the identified file; additional scoping found no persistence in the reviewed evidence. | States both the supported finding and its boundary. |
Avoiding Confirmation Bias
Confirmation bias occurs when investigators search only for evidence supporting an existing belief.
For example, an analyst sees a PowerShell alert and immediately labels it malware. Every later observation is then interpreted to fit that belief. A disciplined analyst writes at least two competing explanations and asks, “What artifact would prove each explanation wrong?” For the malware hypothesis, an approved script hash and documented maintenance activity may weaken it; for the administration hypothesis, an Office parent, obfuscated command, and new external destination may weaken it.
This single question dramatically improves investigative quality.
Analytical Biases and Tradecraft Traps
Analytical bias does not mean an analyst is careless or dishonest. It means human judgment naturally uses shortcuts, especially under time pressure. Professional tradecraft makes those shortcuts visible and deliberately tests them. Heuer (1999) recommends comparing competing explanations and actively seeking disconfirming evidence rather than attempting to eliminate bias through confidence alone.
| Trap | How it appears during an investigation | Countermeasure |
|---|---|---|
| Anchoring | The first alert or theory controls every later interpretation. | Write at least two plausible hypotheses before choosing one. |
| Confirmation bias | The analyst collects only evidence that supports the preferred explanation. | Record one artifact that could disprove each hypothesis. |
| Premature closure | Investigation stops after the first reasonable answer. | Check precursor, primary, and follow-on activity before disposition. |
| Availability bias | A recent class example or famous breach is assumed to explain the current event. | Compare the event with this environment's baseline and exact artifacts. |
| Automation bias | A tool verdict such as “malware” or “benign” is accepted without verification. | Inspect the underlying process, file, identity, network, and rule evidence. |
| Missing-telemetry trap | No alert is treated as proof that no activity occurred. | Verify sensor health, collection scope, fields, and time range first. |
Use one repeatable pause point before closing an investigation: What am I assuming, what evidence would prove me wrong, and which relevant source have I not checked? This brief self-challenge often reveals the next best investigative action.
Common Student Mistake
Students often write incident reports containing statements such as the following when no evidence establishes the presence of an attacker:
“The attacker attempted…”
Instead write:
“Observed activity is consistent with…”
or
“Available evidence suggests…”
These statements accurately communicate uncertainty while remaining evidence-based.
Chapter Exercise 4.4
Generate a bounded benign sequence on WIN11.
UI ACTION · WIN11
Action: Open Microsoft Word, then open Windows PowerShell.
Expected: Both applications appear as running processes; their parent processes may vary depending on how they were launched.
WIN11 · PowerShell
Resolve-DnsName google.com
Invoke-WebRequest -Uri "https://google.com" -UseBasicParsing
Resolve-DnsName requests DNS records for the supplied name. Invoke-WebRequest makes the HTTPS request, -Uri supplies its destination, and -UseBasicParsing avoids the legacy Internet Explorer parsing dependency in Windows PowerShell 5.1.
Representative expected output: Exact addresses, TTLs, headers, and content lengths vary.
Name       Type TTL Section IPAddress
----       ---- --- ------- ---------
google.com A    240 Answer  142.250.72.14

StatusCode        : 200
StatusDescription : OK
Content           : <!doctype html>...
RawContentLength  : 19043
In Discover, set the time range to the last 15 minutes and begin with:
Wazuh Dashboard · DQL filter
agent.name:"win11"Now answer:
What observations can you make?
List three possible explanations.
Which evidence supports each explanation?
Which evidence contradicts each explanation?
Which hypothesis is currently best supported?
What additional evidence would increase your confidence?
Students should present their findings in a structured table rather than narrative form.
Evidence Worksheet
| Observation and time | Field or artifact | Supports | Contradicts/limits |
|---|---|---|---|
| PowerShell started | Sysmon Event ID 1; image, parent, user, command line | Execution occurred | Does not establish intent by itself |
| DNS query | Sysmon Event ID 22; query name and process | Process-associated lookup | Known domain may support benign activity |
| HTTP request | Suricata http/flow; source, destination, URL |
Network activity followed | Expected example.com request supports the lab hypothesis |
| Defender alert or absence | Defender Operational log and verified time range | Detection may support malicious-file hypothesis | No alert lowers confidence only if Defender visibility is verified |
This worksheet encourages balanced reasoning.
Analyst Tradecraft Tip
Imagine two analysts receive the same alert.
Analyst A immediately declares:
“The endpoint is compromised.”
Analyst B says:
“Current evidence suggests suspicious activity. I need to determine whether it represents malicious behavior, administrative activity, or an expected laboratory exercise.”
Which analyst would you trust to investigate a real incident?
Professionalism comes from disciplined reasoning—not confidence alone.
Key Concepts
By the end of this section, you should understand that:
Alerts generate questions, not answers.
Observations are facts; conclusions are interpretations.
Multiple hypotheses should be considered.
Supporting and contradictory evidence are equally valuable.
Confidence should reflect the available evidence.
Well-documented reasoning is as important as the conclusion itself.
Looking Ahead
The next section introduces professional incident documentation. Students will learn how to record observations, maintain investigation notes, construct executive and technical summaries, document evidence, and write incident reports that can be understood by analysts, managers, auditors, and legal teams. Strong technical investigations lose value if they are not documented clearly, accurately, and objectively. This chapter therefore shifts from analytical thinking to communicating investigative findings—a critical skill for every Security Operations Center analyst.
4.5 Professional Incident Documentation
Learning Objectives
After completing this section, you should be able to:
Explain why documentation is essential in cybersecurity.
Differentiate between technical notes and incident reports.
Record objective investigative observations.
Document evidence without introducing bias.
Write concise technical summaries.
Prepare incident reports suitable for management and auditors.
Introduction
Imagine you spend four hours investigating a suspected malware infection.
You identify:
Initial access
Malware execution
Command-and-control communication
Defender quarantine
Timeline
Indicators of Compromise (IOCs)
At the end of the investigation someone asks:
“Can you explain exactly what happened?”
Suppose your answer is:
“I remember most of it.” That is not acceptable in professional cybersecurity.
Investigations must be documented accurately because:
Other analysts continue investigations.
Managers require status updates.
Incident response teams rely on findings.
Auditors review investigations.
Legal teams may require evidence.
Lessons learned improve future detection.
Documentation transforms individual knowledge into organizational knowledge.
The Four-C Reporting Standard
Clear, Concise, Complete & Contextualized.
Incident documentation must preserve facts, evidence, uncertainty, scope, and decisions in a form another person can use. That requires more than technical accuracy. A report must make the important information easy to find and appropriately detailed for its reader while retaining a traceable evidentiary basis (Cichonski et al., 2012).
| Quality | What it requires | What failure looks like |
|---|---|---|
| Clear | Plain, unambiguous language; defined terms; timestamps with time zones; consistent system and user names | Vague pronouns, unexplained acronyms, conflicting names, or unsupported statements |
| Concise | Decision-relevant facts presented once; details moved to a timeline or appendix | Repeated prose, raw log dumps, and technical detail with no stated purpose |
| Complete | Scope, evidence, impact, confidence, unknowns, containment status, and next actions | A polished summary that omits affected assets, evidence, uncertainty, or ownership |
| Contextualized | Language, depth, and emphasis matched to what the audience must understand or decide | Giving executives rule syntax while failing to explain business impact and required decisions |
Concise does not mean incomplete. Complete does not mean long. The goal is the shortest report that allows the intended reader to understand the event, trust the reasoning, and take the correct next action.
Your Report Introduces You
A report may be the analyst's first—and sometimes only—introduction to C-suite executives. It enters the room before the analyst does. Its organization and tone communicate professional qualities whether the author intends them to or not:
| Report characteristic | What it communicates about the analyst |
|---|---|
| Consistent structure and clean formatting | Disciplined, organized thinking |
| Claims tied to timestamps and evidence | Credibility and technical rigor |
| Calibrated words such as indicates, suggests, and not yet established | Mature judgment and intellectual honesty |
| Clear business impact, decisions, owners, and deadlines | Readiness to support leadership |
| Unexplained jargon, careless errors, or unsupported certainty | Weak quality control and unreliable judgment |
Executive writing is not “dumbing down” technical work. It is translating verified technical evidence into risk, impact, options, and decisions without changing the underlying facts.
| Audience | Same evidence, appropriately presented |
|---|---|
| Technical analyst | At 10:15:03 ET, Sysmon Event ID 1 recorded WINWORD.EXE launching powershell.exe on WIN11. Suricata then recorded an HTTP transfer, and Defender quarantined the downloaded file. |
| Executive leadership | Endpoint protection blocked a malicious download attempt on one workstation. Reviewed evidence shows no persistence or lateral movement; monitoring and additional scoping continue. No executive action is required at this time. |
Both statements describe the same investigation. The technical version supports reproduction; the executive version communicates scope, control effectiveness, residual uncertainty, and whether leadership must act.
Sensitive by Default: The Analyst as Custodian
Custodianship mantra: A request is not authorization.
Incident reports, vulnerability assessments, forensic exports, architecture diagrams, screenshots, and evidence packages should be treated as sensitive by default and handled under organizational policy. They may reveal unremediated weaknesses, privileged systems, identities, internal addresses, detection logic, evidence locations, business impact, or response plans—the information an attacker would need to improve a second attempt. NIST guidance emphasizes restricting incident information to authorized personnel and protecting incident communications and documents from unauthorized access or disclosure (Cichonski et al., 2012; Nelson, Rekhi, et al., 2025).
The analyst is a responsible custodian of this material. Curiosity, job title, friendship, urgency, or the statement “I need to see it” does not establish a need to know. Before releasing any report or artifact, verify the requester's identity, authorization, operational need, permitted scope, and approved delivery method. When any element is unclear, stop and ask the incident lead or designated information owner.
| Custodial discipline | Required tradecraft |
|---|---|
| Classify and label | Apply the organization's approved sensitivity/classification label; do not invent one. |
| Enforce need to know | Share only with authorized recipients whose role requires the information for a defined purpose. |
| Minimize disclosure | Provide the least sensitive version that satisfies the need—executive summary, redacted extract, or scoped evidence package. |
| Protect storage | Use approved access-controlled repositories with encryption at rest, logging, backups, and version control; avoid personal drives and unmanaged cloud storage. |
| Protect transmission | Use approved encrypted channels and verify recipients before sending; do not use personal email, consumer messaging, or unapproved file-sharing services. |
| Protect secrets | Do not place passwords, private keys, recovery codes, tokens, or reusable credentials in the report; reference an approved secret-management location instead. |
| Control copies | Limit downloads and forwarding where supported; track the authoritative version and correct recipient lists. |
| Retain and dispose | Follow retention, legal-hold, evidence, and secure-disposal requirements; do not delete or keep copies based on personal preference. |
| Request | Appropriate response |
|---|---|
| Incident commander requests the full report through the approved case system. | Verify role and case access, then provide the controlled authoritative version. |
| Executive needs a decision brief. | Provide a contextualized, minimally necessary summary; retain sensitive technical artifacts in the restricted case record. |
| Vendor asks for “everything” to troubleshoot. | Confirm contract, authorization, legal/privacy requirements, and scope; provide a redacted or limited package when approved. |
| Coworker is curious about the breach. | Do not share. Curiosity is not a business need or authorization. |
| Auditor or regulator requests evidence. | Route through the designated governance/legal process and preserve a record of exactly what was released. |
Once a report leaves the analyst's control, its exposure may be irreversible. Pause before every share: Is this person authorized, do they need this exact information, and am I using the approved protected channel?
Documentation Serves Multiple Audiences
One report rarely satisfies everyone. Different audiences require different levels of detail.
| Audience | Needs |
|---|---|
| SOC Analyst | Technical evidence and timeline |
| Incident Responder | Indicators, affected systems, scope |
| SOC Manager | Current status and risk |
| Executive Leadership | Business impact and decisions |
| Auditor | Evidence of process and controls |
| Legal Counsel | Accurate, objective documentation |
Effective analysts adjust the level of detail without changing the underlying facts.
Analyst Tradecraft Tip
Bottom line up front. Show—do not merely tell. Less is more.
Make every briefing Clear, Concise, Complete & Contextualized for its audience. Lead with what matters, show the evidence, state the required decision, and leave technical detail for the people who need it.
Communicating for the Audience
Before writing a report or building a briefing, decide what the audience must remember when they leave the meeting. For an executive audience, that takeaway is usually: what happened, what matters to the business, what is affected, what has been done, what remains uncertain, and what decision or support is required. Put that answer first; do not make leaders search through technical chronology to discover why they are in the room.
Nerd-to-Normal Translation
Preserve the technical truth while expressing its operational meaning in plain language.
| Technical statement | Executive translation |
|---|---|
| Wazuh rule 92033 fired on WIN11 after Sysmon Event ID 1. | Monitoring detected suspicious PowerShell activity on one employee workstation. |
| Suricata recorded an HTTP transfer and Defender quarantined the SHA-256. | Network and endpoint controls independently confirmed the download, and endpoint protection blocked the identified file. |
| No matching persistence artifacts were found in the reviewed telemetry. | Current evidence shows no persistence, but monitoring and scoped validation continue. |
| Containment requires disabling the account and isolating the endpoint. | We recommend immediately restricting one account and workstation while the investigation continues. |
For reports and slides:
- Lead with the bottom line, current risk, and required decision.
- Use a timeline, scope diagram, decision table, or trend chart when it communicates faster than prose.
- Give each slide one message; make the title state the conclusion, not merely the topic.
- Keep on-screen text to short evidence labels and decision-relevant facts. Speak to the detail; do not paste paragraphs onto slides.
- Move rule syntax, raw logs, hashes, queries, and long timelines to a restricted technical appendix for the technical audience.
- State uncertainty plainly. Simplicity must never become false certainty or omit a material risk.
The final test is simple: Can the audience accurately repeat the bottom line, understand the risk, and identify the next decision after the meeting ends? If not, the briefing was not yet Clear, Concise, Complete & Contextualized.
The Four Components of Every Investigation
Professional documentation contains four major sections.
Figure 4-21
From Observations to Conclusion
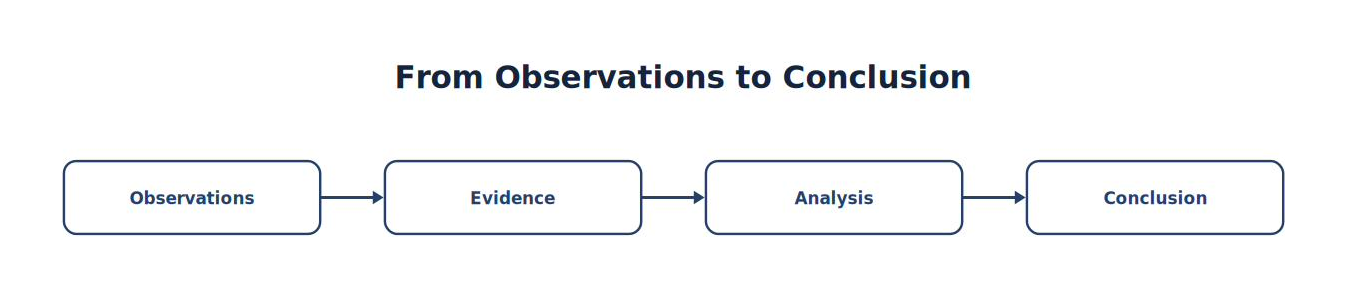
Note. The sequence traces how Observations progresses to Conclusion, emphasizing the intermediate evidence and processing steps.
Each section serves a distinct purpose.
Section 1 — Observations
Observations are objective facts.
Examples:
✓ PowerShell started at 10:15:03. ✓ User Student01 authenticated successfully. ✓ Suricata detected an HTTP download. ✓ Defender quarantined a file. Notice what is missing. No assumptions. No speculation. No opinions.
Poor Observation
The attacker launched malware. No evidence has yet established an attacker.
Good Observation
PowerShell.exe executed at 10:15:03. Parent process: WINWORD.EXE. HTTP communication followed. Windows Defender generated a malware alert. Every statement is directly supported by telemetry.
Analyst Tradecraft Tip
A useful writing discipline is: write what the evidence shows before writing what you assess it means. Keep observations and interpretations visibly separate so another analyst can reproduce the facts and challenge the conclusion.
Section 2 — Evidence
Evidence answers the question:
How do you know?
Every conclusion should reference supporting evidence.
Example:
| Observation | Evidence Source |
|---|---|
| PowerShell executed | Sysmon Event ID 1 |
| DNS query | Sysmon Event ID 22 |
| HTTP request | Suricata |
| Malware detected | Windows Defender |
| Alert generated | Wazuh |
Readers should never wonder where information originated.
Section 3 — Analysis
Analysis explains relationships.
Example:
Observed facts:
Word started PowerShell.
DNS lookup followed.
HTTP download occurred.
Defender quarantined a Trojan.
Analysis:
The sequence is consistent with a malicious Office document attempting to download additional content. Notice the wording.
“Consistent with”
Not:
“Proves.” Professional analysts communicate uncertainty honestly.
Section 4 — Conclusions
Conclusions summarize the investigation.
A strong conclusion answers:
What happened?
What evidence supports it?
What confidence level exists?
What should happen next?
Example:
Current evidence indicates an attempted malware download originating from a Microsoft Word document. Windows Defender quarantined the downloaded file before execution. No evidence of persistence or lateral movement was observed during the investigation. Confidence in this assessment is high due to corroborating evidence from Sysmon, Suricata, Windows Defender, and Wazuh.
This conclusion is:
Objective
Supported
Defensible
Writing Clearly
Technical writing should be:
Accurate
Concise
Objective
Chronological
Reproducible
Avoid unnecessary adjectives.
Poor:
A really suspicious PowerShell attack was definitely executed.
Better:
PowerShell.exe executed at 10:15:03 and initiated an outbound HTTP connection. Additional evidence is consistent with an attempted malware download. Specific evidence is always more valuable than dramatic language.
Building an Investigation Timeline
Every report should include a timeline.
Example:
| Time | Source | Event |
|---|---|---|
| 10:15:01 | Windows | User Login |
| 10:15:03 | Sysmon | PowerShell Started |
| 10:15:05 | Sysmon | DNS Query |
| 10:15:06 | Suricata | HTTP GET |
| 10:15:08 | Windows Defender | Trojan Quarantined |
| 10:15:09 | Wazuh | Correlated Alert |
A timeline allows another analyst to reconstruct the incident without re-performing the investigation.
Recording Indicators of Compromise (IOCs)
Every investigation should capture important indicators.
Examples include:
| IOC Type | Example |
|---|---|
| IP Address | 203.0.113.25 |
| Domain | example-malware.com |
| SHA-256 Hash | |
| Process | powershell.exe |
| File Name | invoice.docm |
| URL | http://example.com/file.exe |
| SID | 2010935 |
Even if the incident is closed, these indicators may prove valuable during future investigations.
Investigation Notes
Professional analysts document continuously in short, chronological, factual notes:
| Time (ET) | Investigation note | Supporting artifact |
|---|---|---|
| 10:15 | PowerShell process observed on WIN11. | Sysmon Event ID 1; image, parent, user, command line |
| 10:18 | DNS query associated with the endpoint confirmed. | Sysmon Event ID 22; query name and timestamp |
| 10:22 | HTTP file transfer detected. | Suricata http/fileinfo record; URL and hash when available |
| 10:25 | Defender quarantined the identified file. | Defender Operational event; path and action status |
| 10:30 | Reviewed persistence locations contained no matching artifact. | Sources checked, query/time range, and negative result |
These notes state what was observed and where it was verified. Later, they become the investigation timeline and support the final report.
Common Student Mistake
Students frequently wait until the investigation is complete before documenting anything. Hours later, important details have been forgotten. Professional analysts document continuously. Documentation is part of the investigation—not something performed afterward.
Investigation Report Template
Use the following compact structure for every incident report:
| Report section | Required content |
|---|---|
| Incident summary | Bottom line, current status, business/operational impact, and required decision |
| Initial alert | Rule ID, severity, timestamp/time zone, endpoint, and alert source |
| Systems involved | Hostnames, users, addresses, roles, and confirmed/possible scope |
| Timeline | Chronological events with source, timestamp, and artifact reference |
| Evidence | Relevant Sysmon, Suricata, Defender, Wazuh, Linux, identity, file, or other records |
| Indicators | Observed hashes, domains, URLs, addresses, filenames, accounts, and their context |
| Analysis | Relationships, competing explanations, supporting/contradictory evidence, and unknowns |
| Conclusion | Assessment, confidence, affected scope, containment status, recommended actions, owners, and deadlines |
From Analyst-Correct to Decision-Ready
Technical accuracy is necessary, but a report is operationally useful only when another person can understand the finding, challenge the evidence, and decide what to do next. The following Alerts to Answers instructional comparison is a writing rubric, not an externally standardized job-level model. “Leader standard” describes the quality expected when work is delivered to a SOC lead, incident commander, or executive stakeholder; it does not mean that only managers are responsible for clear reporting.
| Dimension | Analyst-correct deliverable | Decision-ready deliverable |
|---|---|---|
| Accuracy | Findings are technically correct. | Findings remain correct and defensible under scrutiny. |
| Completeness | The report answers the initial question. | It anticipates likely follow-up questions, gaps, and unknowns. |
| Clarity | Technical peers can understand it. | A non-technical stakeholder can identify the bottom line without translating jargon. |
| Structure | Information has basic organization. | The flow is intentional: executive summary → findings → evidence → impact → action. |
| Communication | It describes what happened. | It explains why the event matters and what should happen next. |
| Formatting | The document is readable. | Headings, tables, chronology, and spacing make it easy to scan and use. |
| Evidence use | Logs and data are included. | Each material conclusion points to relevant evidence and acknowledges contradictions or limits. |
| Risk framing | The technical issue is identified. | Technical consequences are translated into business, mission, safety, privacy, or operational risk. |
| Decision support | The report is informative. | Recommendations are specific, actionable, prioritized, and assigned when authority permits. |
| Ownership | The analyst reports findings. | The deliverable reduces ambiguity and enables an accountable owner to act. |
Use the table as a revision pass. For each row, point to the sentence, table, timeline entry, or recommendation that satisfies the decision-ready column. If no passage does, revise the report or state the unresolved gap. Content alone is not sufficient when poor organization could cause readers to misinterpret a finding, lose confidence, or delay a decision.
Analyst Tradecraft Tip
Use the shift-change test. Could the next analyst continue the investigation using only your documentation? If not, the investigation record is incomplete. Professional work must survive handoffs, management review, audits, and legal scrutiny.
Chapter Exercise 4.1 — Writing Your First Incident Report
Objective
Conduct a structured investigation and prepare a professional incident report using evidence collected from your SOC laboratory.
Scenario
Generate the following controlled activity:
Launch PowerShell.
Perform a DNS lookup (nslookup example.com).
Browse to a website.
Download the EICAR test file (EICAR, n.d.).
Observe Windows Defender quarantine the file.
Locate the associated Wazuh and Suricata events.
Student Tasks
Record the initial Wazuh alert.
Expand the investigation window to ±15 minutes.
Build a chronological timeline.
Collect supporting evidence from:
Sysmon
Suricata
Windows Defender
Wazuh
Record all relevant IOCs.
Identify evidence supporting and contradicting your initial hypothesis.
Write:
An executive summary (150–200 words)
A technical summary (300–500 words)
A conclusion with a stated confidence level
Peer-review another student’s report and identify:
Missing evidence
Unsupported conclusions
Areas requiring clarification
Chapter Connection
The next section introduces evidence collection and preservation. Students will learn the distinction between operational monitoring and digital evidence, understand the principles of maintaining evidentiary integrity, preserve logs and artifacts for later analysis, and appreciate why proper handling of telemetry is essential for incident response, forensic investigations, compliance, and potential legal proceedings. This chapter naturally extends professional documentation by ensuring that the evidence described in reports remains trustworthy, reproducible, and defensible.
4.6 Evidence Collection and Preservation
Learning Objectives
After completing this section, you should be able to:
Explain the importance of evidence preservation.
Differentiate operational logs from forensic evidence.
Identify common digital evidence sources.
Preserve security artifacts without modifying them.
Understand chain of custody concepts.
Collect evidence suitable for later forensic analysis.
Introduction
Imagine your organization experiences a ransomware attack. Within minutes, the Security Operations Center begins investigating. Alerts appear. Telemetry arrives. Processes execute. Network traffic is detected. Files are quarantined. Now imagine someone accidentally deletes the only log proving how the attacker entered the organization. The investigation becomes significantly more difficult. Professional cybersecurity investigations depend upon reliable evidence.
Evidence must be:
Accurate
Complete
Verifiable
Preserved
Without trustworthy evidence, even excellent investigations lose credibility.
What Is Digital Evidence?
The National Institute of Standards and Technology defines digital evidence as “electronic information stored or transmitted in binary form” (National Institute of Standards and Technology [NIST], n.d.). In investigative practice, digital information has evidentiary value when it is relevant to a question, can help support or refute a fact, and is collected and preserved with sufficient integrity and provenance for its intended use (Kent et al., 2006).
| Evidence source | Concrete artifact or location |
|---|---|
| Windows event logs | Exported .evtx records from Security, System, or Application channels |
| Sysmon | Microsoft-Windows-Sysmon/Operational; process, DNS, network, and file events |
| Suricata | /var/log/suricata/eve.json; alert, flow, DNS, HTTP, and fileinfo records |
| Packet capture | A .pcap/.pcapng file with capture interface, start/end time, and hash documented |
| Windows Registry | Hives such as SYSTEM, SOFTWARE, and a user's NTUSER.DAT |
| Linux authentication | /var/log/auth.log, journald records, or audit data in /var/log/audit/audit.log |
| File metadata | Full path, size, timestamps, owner, signature, and SHA-256 hash |
| Browser history | Browser history/download database and associated user profile |
| Memory image | A documented volatile-memory acquisition such as a .raw image |
| Disk image | A verified forensic image such as raw/dd or Expert Witness Format (.E01) |
Every investigation combines multiple evidence sources.
Figure 4-22
Evidence Sources
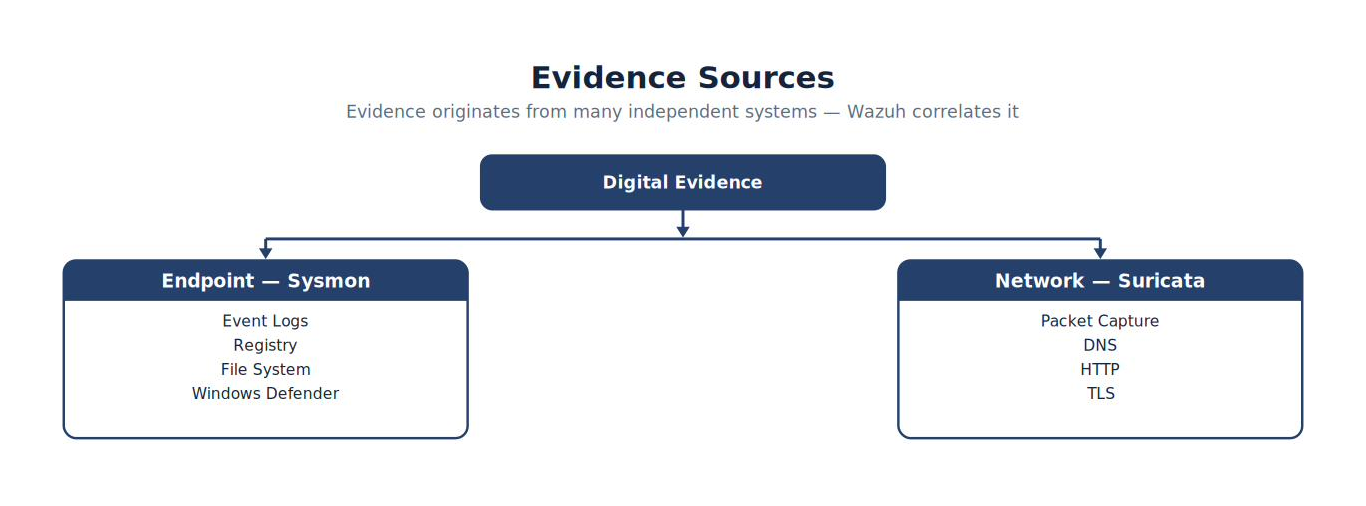
Note. The figure summarizes evidence Sources and highlights the relationships among its principal elements, evidence sources, and analytical outcomes.
Notice that evidence originates from many independent systems.
Operational Data Versus Forensic Evidence
These terms are often confused. They are not identical.
| Operational Data | Forensic Evidence |
|---|---|
| Used for monitoring | Used to establish facts |
| May be overwritten | Must be preserved |
| Supports daily operations | Supports investigations |
| Frequently changes | Captured at a point in time |
During normal SOC operations, telemetry flows continuously. When an incident occurs, selected telemetry becomes evidence.
Analyst Tradecraft Tip
A log file is not automatically evidence merely because it exists. Its value depends on relevance, authenticity, integrity, provenance, and context. Record where it came from, how it was acquired, when it was collected, who handled it, and how integrity was verified.
Primary Evidence Sources in Our Laboratory
Throughout this textbook we repeatedly collect evidence from these locations.
| Source | Location |
|---|---|
| Wazuh Alerts | Dashboard |
| Sysmon | Windows Event Log |
| Defender | Windows Event Log |
| Suricata | /var/log/suricata/eve.json |
| Linux Logs | /var/log/ |
| Wazuh Manager | /var/ossec/logs/ |
Students should become familiar with each location.
Preserve Before You Analyze
One of the first rules of digital forensics (Kent et al., 2006) is:
Preserve first. Analyze second.
Why?
Because analysis sometimes changes evidence.
Examples include:
Opening files
Restarting services
Clearing logs
Updating software
Rebooting systems
These actions may overwrite valuable artifacts. Professional investigators minimize unnecessary changes.
Saving Artifacts in a Forensic Container
A forensic container, as used in this laboratory, is a documented archive that keeps a collected artifact together with its metadata record and cryptographic hash manifest. It is a practical logical-evidence package; it is not a forensic disk-image format and does not preserve every filesystem structure, alternate data stream, extended attribute, or original inode value. Use an authorized forensic acquisition method when the investigation requires those properties (Kent et al., 2006). The following workflow adapts the course's Forensic Container Approach into a reproducible Linux collection pattern (Furstenberg, 2026).
Suppose the artifact is /var/log/suricata/eve.json and the authorized case directory is /cases/SOC-2026-001. Create the case structure without modifying the source log:
UB2604 · TERMINAL
sudo install -d -m 0700 /cases/SOC-2026-001/source /cases/SOC-2026-001/package
date --iso-8601=seconds | sudo tee /cases/SOC-2026-001/collection-time.txt
sudo stat /var/log/suricata/eve.json | sudo tee /cases/SOC-2026-001/source/eve.json.metadata.txt
sudo cp --preserve=all /var/log/suricata/eve.json /cases/SOC-2026-001/source/eve.json
install -d -m 0700 creates owner-only case directories. date --iso-8601=seconds records collection time with an offset. stat captures source metadata before transfer. cp --preserve=all requests preservation of supported mode, ownership, timestamps, links, context, and extended attributes; the destination filesystem and collector's privileges determine what can actually be retained. Record any warning or unsupported attribute rather than assuming perfect preservation.
Verify the copied artifact against the source hash, then create and fingerprint the container:
UB2604 · TERMINAL
sudo sha256sum /var/log/suricata/eve.json /cases/SOC-2026-001/source/eve.json
cd /cases/SOC-2026-001
sudo sha256sum source/eve.json | sudo tee source/eve.json.sha256
sudo sha256sum -c source/eve.json.sha256
sudo tar --acls --xattrs --numeric-owner -czf package/SOC-2026-001-evidence.tar.gz source collection-time.txt
sudo sha256sum package/SOC-2026-001-evidence.tar.gz | sudo tee package/SOC-2026-001-evidence.tar.gz.sha256
The first sha256sum displays source and collected-file hashes for comparison; they should match for a stable source. A live eve.json may grow during collection, so a mismatch must be documented and resolved with an authorized snapshot, log-rotation, or acquisition method rather than ignored. tee creates the manifest for the collected copy, and sha256sum -c reads that manifest and verifies it. tar packages the artifact and records; --acls, --xattrs, and --numeric-owner retain supported access-control lists, extended attributes, and numeric ownership values inside the archive; -c creates, -z compresses with gzip, and -f names the output. The final SHA-256 protects the complete transfer package.
UB2604 · EXPECTED OUTPUT
<same 64-character SHA-256 value>  /var/log/suricata/eve.json
<same 64-character SHA-256 value>  /cases/SOC-2026-001/source/eve.json
source/eve.json: OK
<64-character SHA-256 value>  package/SOC-2026-001-evidence.tar.gz
The hash value varies. Preserve the manifest separately from the transferred container when possible, use the organization's authorized evidence repository, and verify the package again after transfer. If Secure Copy (scp) is approved, scp -p requests preservation of the source file's modification and access times for the transferred package; it cannot preserve the original inode change time (ctime) on a different filesystem. Document the destination ctime as a transfer-created value rather than treating it as original evidence metadata (Furstenberg, 2026).
| Container component | What it proves or preserves | Important limitation |
|---|---|---|
| Collected artifact | The logical file selected for analysis | Not a full disk, memory, or filesystem acquisition |
| Metadata record | What stat reported at collection time |
A text record does not recreate the original filesystem |
| Artifact SHA-256 | Whether the collected file matches the recorded source fingerprint | Integrity does not by itself prove authenticity or proper collection |
| Collection-time record | When and in which offset the collection was recorded | Host clock accuracy must still be validated |
| Container SHA-256 | Whether the packaged transfer unit changed | Recompute and compare after every transfer |
| Case notes/chain of custody | Who collected, moved, received, or accessed the package and why | Requires disciplined human documentation |
Chain of Custody
In many organizations, evidence passes between multiple people.
Chain of custody documents:
Who collected the evidence
When it was collected
Where it was stored
Who accessed it
Why it was transferred
Although our classroom laboratory does not require formal legal documentation, developing this habit prepares students for professional incident response and forensic work.
Example Chain of Custody Record
| Field | Example |
|---|---|
| Case Number | SOC-2026-001 |
| Evidence ID | EV-001 |
| Description | Suricata eve.json |
| Collected By | Student Analyst |
| Date/Time | 2026-09-15 10:45 |
| Storage Location | Investigation Folder |
| Hash Recorded | SHA-256 |
Evidence Integrity
How do you prove evidence was not modified?
One common technique is cryptographic hashing.
Example:
Figure 4-23
From Original File to Integrity Verified
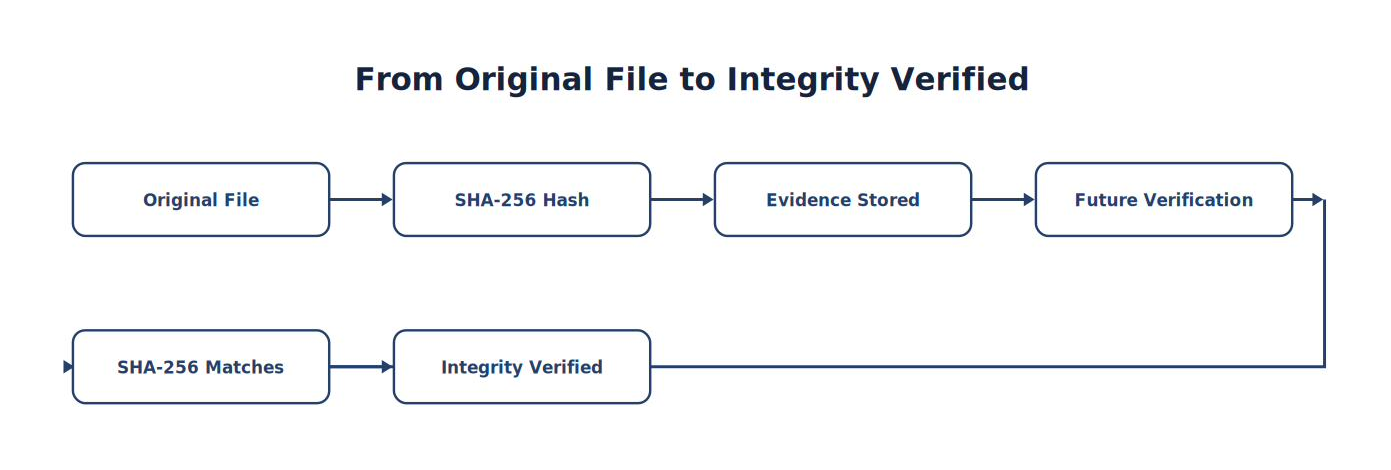
Note. The sequence traces how Original File progresses to Integrity Verified, emphasizing the intermediate evidence and processing steps.
If the hash changes, the file changed. This concept becomes extremely important in later forensic chapters.
Collecting Wazuh Evidence
When documenting an alert, preserve more than a screenshot.
Record:
Rule ID
Timestamp
Agent Name
Alert Level
Full JSON document
Related events
Investigation notes
Screenshots are useful. Structured data is better.
Collecting Suricata Evidence
Important artifacts include:
/var/log/suricata/eve.json suricata.log stats.log
If packet captures are available, preserve those as well.
Remember:
Suricata explains what it detected. A packet capture often explains why.
Collecting Sysmon Evidence
Useful artifacts include:
Process Creation (Event ID 1)
Network Connections (Event ID 3)
CreateRemoteThread (Event ID 8)
File Creation (Event ID 11)
DNS Query (Event ID 22)
Students should record:
Event ID
Timestamp
Process
Parent Process
User
Command Line
These fields frequently become key investigative evidence.
Evidence Collection Matrix
| Technology | Evidence collected | Location, path, or channel examples |
|---|---|---|
| Sysmon | Process, network, DNS, registry, and file activity | Windows Event Viewer → Applications and Services Logs → Microsoft → Windows → Sysmon → Operational; exported file example: Sysmon-Operational.evtx |
| Suricata | Alerts, flows, DNS, HTTP, TLS, and file metadata | /var/log/suricata/eve.json, /var/log/suricata/fast.log, /var/log/suricata/stats.log |
| Defender | Malware detections and remediation actions | Windows Event Viewer → Applications and Services Logs → Microsoft → Windows → Windows Defender → Operational; exported file example: Windows-Defender-Operational.evtx |
| Wazuh | Correlated alerts and manager processing records | /var/ossec/logs/alerts/alerts.json, /var/ossec/logs/alerts/alerts.log, /var/ossec/logs/ossec.log; indexed alerts in Wazuh Dashboard → Discover |
| Linux | Authentication, services, kernel, and Linux Audit records | Ubuntu journal via journalctl; /var/log/auth.log, /var/log/syslog, /var/log/audit/audit.log when auditd is enabled |
Notice how each technology contributes different evidence.
Avoiding Evidence Contamination
Investigators should avoid actions that unnecessarily change the system or destroy the very history they need to explain:
| Premature action | Evidence at risk | Preferred discipline | Windows capture example | Linux capture example |
|---|---|---|---|---|
| Reboot immediately | Volatile memory, active connections, running processes, logged-on sessions | Record time and state; follow the authorized containment/acquisition plan before rebooting. | Get-Date -Format o; Get-Process; Get-NetTCPConnection |
date --iso-8601=seconds; ps aux; sudo ss -plant |
| Clear logs or temporary files | Event chronology, command history, downloads, and application artifacts | Preserve relevant records and document retention/rollover status. | wevtutil epl System C:\Evidence\System.evtx |
sudo journalctl --output=short-iso > ~/case-evidence/system-journal.log |
| Update software | File versions, timestamps, services, packages, and vulnerability state | Capture the baseline and required artifacts before remediation. | `Get-ComputerInfo; Get-HotFix | Sort-Object InstalledOn` |
| Restart a service | Process identity, connections, queues, transient errors, and service state | Record status/logs and document who authorized the restart and why. | Get-Service wazuh*; Get-WinEvent -LogName System -MaxEvents 50 |
sudo systemctl status suricata --no-pager; sudo journalctl -u suricata --since "30 minutes ago" --no-pager |
| Run unplanned tools | Filesystem, registry, memory, network, and execution artifacts | Use approved tools and record command, operator, time, purpose, and output location. | Start-Transcript -LiteralPath C:\Evidence\analyst-session.txt -Append |
script -af ~/case-evidence/analyst-session.txt |
In these examples, PowerShell -Format o records an ISO 8601 timestamp, -MaxEvents limits returned events, -LiteralPath uses the exact output path, and -Append preserves prior transcript content. On Linux, ss -plant shows TCP sockets with process, address, numeric-port, and connection details; journalctl -u selects a systemd unit, --since limits the time window, and --no-pager writes directly to the terminal or redirected file. The script -a option appends and -f flushes output promptly. Create the authorized evidence directory before using any example output path.
Preservation does not always mean “do nothing.” Safety and containment may require immediate action. The analyst should understand the evidentiary cost, obtain required authorization, preserve what is practical, and document every change.
Common Student Mistake
Students often restart Suricata or Wazuh, clear logs, install updates, and reboot before recording the original condition. Only afterward do they ask, “What happened?” By then, service state, timestamps, volatile activity, and log history may have changed. Preserve and document first whenever safety, authorization, and the response plan allow.
The commands below illustrate common state-changing actions. Do not run them on a suspected incident system merely to troubleshoot. First preserve the relevant evidence, obtain authorization, and record the operator, time, reason, and expected impact.
| Action | Example command | What it may change or destroy |
|---|---|---|
| Restart Suricata | sudo systemctl restart suricata |
Process identity, active flows, counters, queued output, and service-state evidence |
| Restart Wazuh Manager | sudo systemctl restart wazuh-manager |
Manager processes, queues, connection state, transient errors, and timestamps |
| Clear a systemd journal | sudo journalctl --rotate followed by sudo journalctl --vacuum-time=1s |
Historical service and operating-system events needed to reconstruct the timeline |
| Install updates | sudo apt update && sudo apt upgrade |
Package versions, files, services, timestamps, and the original vulnerability state |
| Reboot Linux | sudo systemctl reboot |
Volatile memory, active connections, running processes, logged-on sessions, and uptime context |
| Reboot Windows | Restart-Computer |
Volatile state, active network sessions, processes, and portions of the pre-reboot timeline |
Before an authorized service restart, capture a compact baseline:
UB2604 · Terminal
date --iso-8601=seconds
sudo systemctl status suricata --no-pager
sudo journalctl -u suricata --since "30 minutes ago" --no-pager > ~/case-04-evidence/suricata-before-restart.log
sha256sum ~/case-04-evidence/suricata-before-restart.log| Syntax element | What it does and why it is used |
|---|---|
date --iso-8601=seconds |
Records the collection time in an unambiguous ISO 8601 format including the local UTC offset and seconds. |
sudo |
Runs the following command with the permission required to inspect protected service and journal data. |
systemctl status suricata |
Captures Suricata’s current loaded, enabled, active, process, and recent-status information before the restart changes it. |
--no-pager |
Prevents output from opening in an interactive pager, making the result suitable for a terminal transcript or evidence file. |
journalctl -u suricata |
Reads systemd journal records for the Suricata unit; -u means unit. |
--since "30 minutes ago" |
Restricts collection to the recent pre-restart window instead of copying the entire journal. |
> |
Redirects command output into the named file. It creates or overwrites that file, so use a new authorized evidence path. |
~/case-04-evidence/suricata-before-restart.log |
Stores the captured log beneath the current user’s home directory in the case-specific evidence folder. |
sha256sum |
Calculates a SHA-256 digest for the saved log so later integrity checks can detect whether the working copy changed. |
Expected: The terminal records the collection time and current service state, and the preserved log produces a 64-character SHA-256 value. This baseline does not capture every volatile artifact, but it is more defensible than restarting first and documenting later.
Chapter Exercise 4.5
A controlled simulation generated PowerShell, DNS, HTTP, Suricata, Defender, and Wazuh telemetry. Collect only from the authorized laboratory. These examples create working copies for classroom analysis; they do not replace organizational forensic-acquisition procedures, write blockers, chain-of-custody requirements, or legal direction.
On WIN11, review recent Sysmon and Defender records:
WIN11 · PowerShell
Get-WinEvent -LogName 'Microsoft-Windows-Sysmon/Operational' -MaxEvents 50 |
  Select-Object TimeCreated, Id, RecordId, ProviderName, Message

Get-WinEvent -LogName 'Microsoft-Windows-Windows Defender/Operational' -MaxEvents 30 |
  Select-Object TimeCreated, Id, RecordId, Message
Expected: Recent records display timestamps, event IDs, record IDs, and messages. Exact events vary; record the time zone and the identifiers for relevant entries.
On UB2604, create a restricted working copy of Suricata telemetry and verify its hash:
UB2604 · Terminal
mkdir -p -m 700 ~/case-04-evidence
sudo cp --preserve=timestamps /var/log/suricata/eve.json ~/case-04-evidence/eve.json
sudo chown "$USER":"$USER" ~/case-04-evidence/eve.json
sha256sum ~/case-04-evidence/eve.json
Expected: The working copy exists in ~/case-04-evidence/, retains source timestamps where supported, and produces a 64-character SHA-256 value. Record the source path, destination path, collection time, operator, and hash.
If an authorized, non-production test file is available, hash it without opening or executing it:
WIN11 · PowerShell
Get-FileHash -Algorithm SHA256 -LiteralPath 'C:\Path\To\Authorized-Test-File'Expected: PowerShell returns the algorithm, a 64-character hash, and the exact path. If Defender has quarantined the file, do not restore it merely to calculate a hash; use the safely available evidence and document the limitation.
Export or preserve the relevant Wazuh alert using the approved dashboard/case workflow, then build a unified timeline and complete the evidence inventory below.
Evidence Inventory Worksheet
| Evidence ID | Source/artifact | Required record | Collected | Integrity/identity verified |
|---|---|---|---|---|
| EV-001 | Wazuh alert export | Rule, agent, timestamp, source case/export path | □ | □ |
| EV-002 | Sysmon Event ID 1 | Record ID, image, parent, user, command line, time | □ | □ |
| EV-003 | Sysmon Event ID 22 | Record ID, query name, process, time | □ | □ |
| EV-004 | Suricata eve.json copy |
Source/destination path, collection time, SHA-256 | □ | □ |
| EV-005 | Defender Operational event | Record ID, threat, affected path, action/status, time | □ | □ |
Students should include this inventory with every investigation.
Analyst Tradecraft Tip
Preserve before you remediate. Record timestamps, preserve relevant logs, export key events, and document system state before rebooting, updating, clearing files, or restarting services. Trustworthy evidence is as important as the finding itself.
Key Concepts
By the end of this section, you should understand that:
Digital evidence must be preserved before major changes are made.
Operational telemetry can become forensic evidence during an investigation.
Multiple independent evidence sources strengthen investigative conclusions.
Documentation and evidence preservation are inseparable.
Maintaining evidence integrity supports repeatability, incident response, compliance, and forensic analysis.
Looking Ahead
The next section introduces Indicators of Compromise (IOCs) and Indicators of Attack (IOAs). Students will learn the difference between static artifacts (such as file hashes, domains, and IP addresses) and behavioral indicators (such as suspicious process chains and attacker techniques). Using the SOC laboratory, they will identify, collect, and validate IOCs and IOAs from Sysmon, Suricata, Windows Defender, and Wazuh, laying the groundwork for threat hunting and detection engineering in later chapters.
4.7 Indicators of Compromise (IOCs) and Indicators of Attack (IOAs)
Learning Objectives
After completing this section, you should be able to:
Differentiate between Indicators of Compromise (IOCs) and Indicators of Attack (IOAs).
Identify common IOC types collected by Wazuh.
Recognize attacker behaviors represented by IOAs.
Collect IOCs and IOAs from Sysmon, Suricata, Windows Defender, and Linux logs.
Explain why behavioral detection is increasingly important.
Document indicators during an investigation.
Introduction
Suppose an organization discovers malware on a workstation. One investigator records the file hash, filename, IP address, and domain. Another reconstructs the behavior: Word launched PowerShell, PowerShell contacted an external server and downloaded an executable, the executable attempted persistence, and Defender quarantined the file. Both investigations are valuable. The first describes what was observed; the second explains how the activity unfolded. Professional SOC analysts collect both types of indicators.
What Is an IOC?
An Indicator of Compromise (IOC) is an artifact that suggests a system may have been compromised (Cichonski et al., 2012). IOCs are typically static values such as IP addresses, domain names, URLs, file hashes, registry keys, filenames, email addresses, and certificate fingerprints. They are often shared through threat-intelligence feeds and block lists.
Common IOC Types
| IOC | Example value | Example Wazuh DQL lookup |
|---|---|---|
| IPv4 address | 203.0.113.25 | data.srcip:"203.0.113.25" OR data.dstip:"203.0.113.25" OR data.win.eventdata.ipAddress:"203.0.113.25" |
| Domain | malicious-example.com | data.win.eventdata.queryName:"malicious-example.com" OR data.dns.rrname:"malicious-example.com" |
| URL | http://badsite.example/payload.exe |
data.http.url:"http://badsite.example/payload.exe" |
| SHA-256 | 9d5e... |
data.win.eventdata.hashes:*9d5e* OR syscheck.sha256_after:*9d5e* |
| Filename | invoice.docm |
data.win.eventdata.targetFilename:*invoice.docm OR syscheck.path:*invoice.docm |
| Registry key | HKCU\Software\Example |
data.win.eventdata.targetObject:*Software\\Example* |
| Email address | attacker@example.com |
"attacker@example.com" |
| TLS certificate | SHA-256 fingerprint | data.tls.fingerprint:*9d5e* |
The email example performs a broad value search because the indexed field depends on the mail or security product supplying the event. For every IOC, expand a known matching record and use the field name actually populated in that data source before saving the query.
These indicators are valuable because they are easy to search and compare.
IOC Collection in Our SOC
Throughout this laboratory, Wazuh collects IOCs from multiple sources.
| Technology | IOC examples | Location, path, or channel |
|---|---|---|
| Sysmon | Hashes, process names, command lines | Microsoft-Windows-Sysmon/Operational event channel; exported Sysmon-Operational.evtx |
| Suricata | Source/destination addresses, domains, URLs, certificate details | /var/log/suricata/eve.json and /var/log/suricata/fast.log |
| Defender | Malware names, hashes, affected paths | Microsoft-Windows-Windows Defender/Operational event channel |
| Linux | Usernames, addresses, commands, file paths | systemd journal; /var/log/auth.log, /var/log/syslog, and /var/log/audit/audit.log when auditd is enabled |
| Wazuh | Correlated indicators and normalized source fields | Wazuh Dashboard → Discover; /var/ossec/logs/alerts/alerts.json and /var/ossec/logs/alerts/alerts.log |
Notice that every technology contributes different artifacts.
Limitations of IOCs
Suppose malware uses bad.exe today and the operator replaces it with update.exe tomorrow. The hash and filename change immediately; the associated domain and IP address can change just as quickly. Traditional IOC detection therefore becomes less effective when adversaries rotate the artifacts defenders collect.
Analyst Tradecraft Tip
Artifacts change quickly. Behaviors change slowly.
What Is an IOA?
An Indicator of Attack (IOA) identifies suspicious behavior rather than a specific artifact.
Instead of asking only which file appeared, IOA analysis asks what behavior occurred. Behavior generally changes more slowly than malware hashes and filenames.
Examples of IOAs
| Behavior | Why it merits investigation |
|---|---|
| Office launches PowerShell | Office documents do not ordinarily need a scripting shell; the parent-child relationship is commonly associated with malicious document execution. |
| PowerShell downloads an executable | A scripting engine retrieving executable content can indicate payload delivery, especially when the destination or command is unexpected. |
| Process injects into another process | Injection can conceal execution inside a trusted process and evade process-based controls. |
| LSASS memory access | Access to LSASS memory may indicate credential dumping, although approved security tools can also perform it. |
| Multiple failed logins | Repeated failures may reflect password guessing, credential misuse, or a broken service configuration. |
| Rapid port scanning | Connections across many ports or hosts can indicate service discovery and reconnaissance. |
| Encoded PowerShell | Encoding can support legitimate automation, but it can also obscure commands from users and simple inspection. |
| Scheduled task persistence | A newly created or modified task can provide recurring execution after logon, reboot, or a timed trigger. |
Notice that no hashes are required. The behavior itself is the indicator.
Figure 4-24
IOC vs. IOA
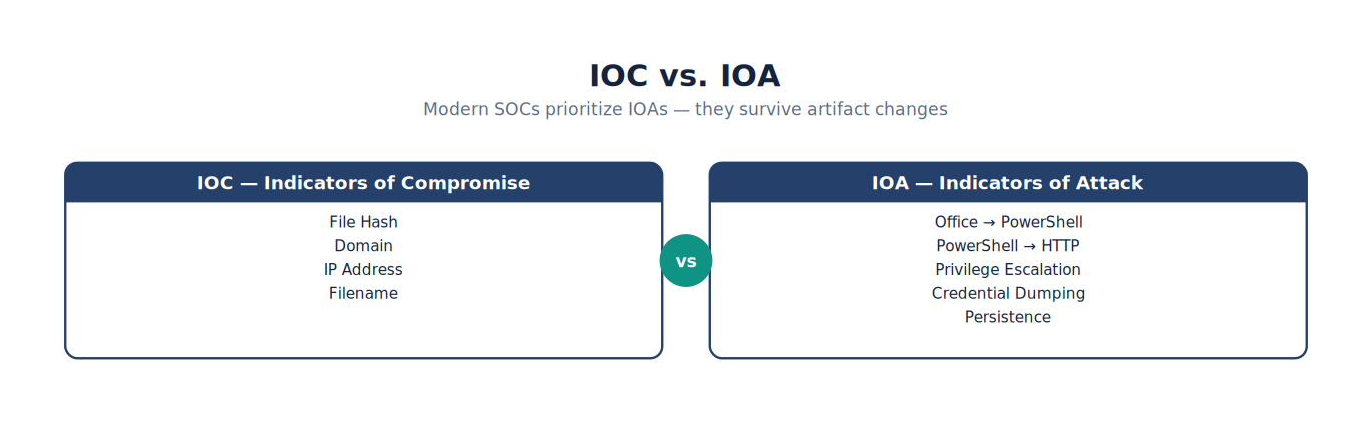
Note. The comparison highlights the operational differences represented by iOC vs. IOA and shows why the distinction matters during analysis.
Modern SOCs increasingly prioritize IOAs because they remain effective even when attackers modify specific artifacts.
Behavioral Detection
Consider the following sequence.
Figure 4-25
From WINWORD.EXE to Beaconing
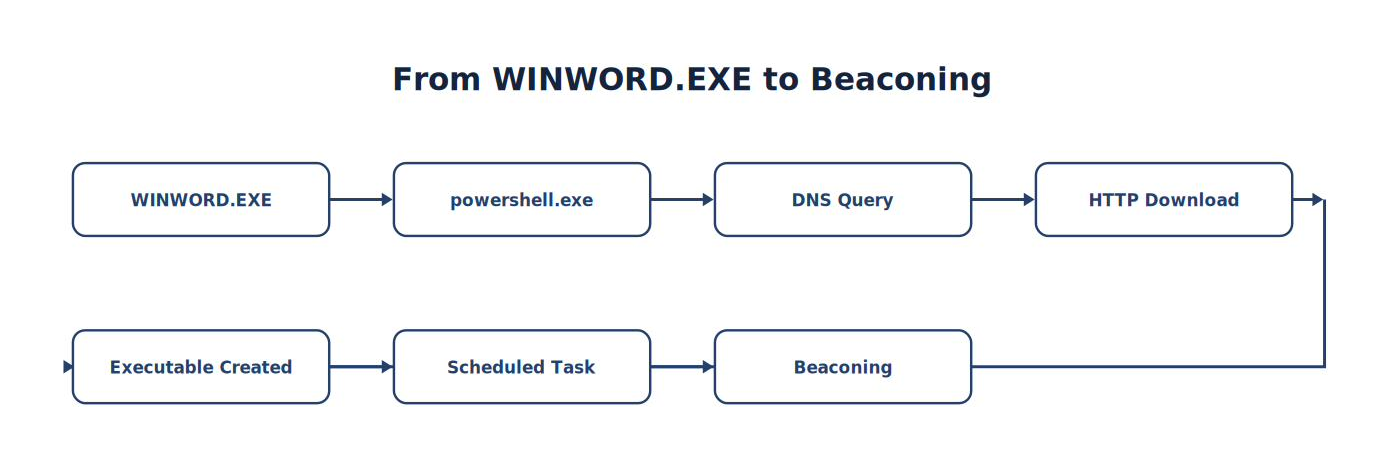
Note. The sequence traces how WINWORD.EXE progresses to Beaconing, emphasizing the intermediate evidence and processing steps.
Every step represents behavior. Even if every file hash changes, the behavior remains highly suspicious.
Collecting IOAs from Sysmon
Sysmon provides behavioral telemetry in Event Viewer at Applications and Services Logs → Microsoft → Windows → Sysmon → Operational (Russinovich & Garnier, n.d.). The PowerShell/API channel name is Microsoft-Windows-Sysmon/Operational, and its default on-disk backing file is %SystemRoot%\System32\Winevt\Logs\Microsoft-Windows-Sysmon%4Operational.evtx—normally C:\Windows\System32\Winevt\Logs\Microsoft-Windows-Sysmon%4Operational.evtx.
| Event ID | Behavior |
|---|---|
| 1 | Process creation |
| 3 | Network connection |
| 8 | CreateRemoteThread |
| 11 | File creation |
| 22 | DNS query |
Combined, these events describe attacker activity rather than simply identifying malware.
Collecting IOAs from Suricata
Suricata records network behavior primarily in /var/log/suricata/eve.json. The examples below are starting points; tune time, address, signature, and protocol conditions to the investigation.
| Behavior | Relevant EVE record or field | Example Bash lookup |
|---|---|---|
| Port scanning | alert, flow; repeated destinations or ports from one source |
`sudo jq -c 'select(.event_type=="alert" and (.alert.signature |
| Command-and-control traffic | alert, flow, dns, http, tls |
`sudo jq -c 'select(.event_type=="alert" and (.alert.category |
| Protocol anomalies | anomaly |
`sudo jq -c 'select(.event_type=="anomaly") |
| Malware downloads | fileinfo, correlated http and alert records |
`sudo jq -c 'select(.event_type=="fileinfo") |
| DNS tunneling | dns.rrname, query type, response, frequency, and length |
`sudo jq -r 'select(.event_type=="dns") |
| Suspicious TLS sessions | tls.sni, certificate subject/issuer, fingerprint, version |
`sudo jq -c 'select(.event_type=="tls") |
jq -c emits one compact JSON object per match; jq -r emits raw text for counting; test(...;"i") performs a case-insensitive regular-expression match; // empty suppresses missing values; sort | uniq -c | sort -nr groups identical domains, counts them, and ranks the highest counts first. These searches examine behavior, not merely an IP address.
Collecting IOAs from Wazuh
Because Wazuh correlates multiple telemetry sources, it often reveals behaviors that individual sensors cannot.
Example:
Figure 4-26
From PowerShell to Persistence
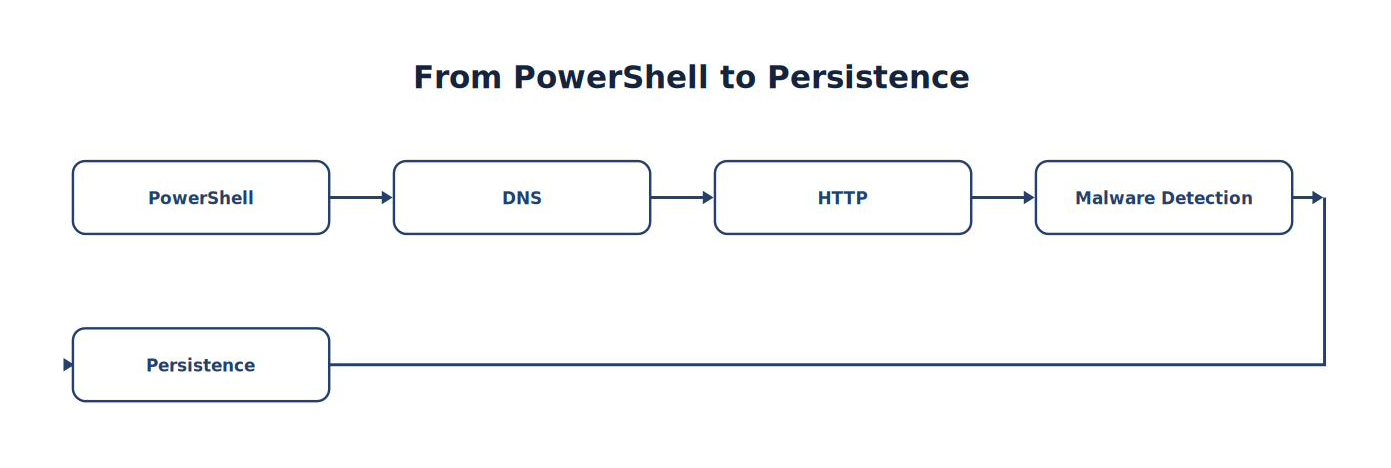
Note. The sequence traces how PowerShell progresses to Persistence, emphasizing the intermediate evidence and processing steps.
This sequence is significantly stronger than any individual event.
Case Study
Suppose Defender reports a Trojan detection. Begin with Defender Operational Event ID 1116, then correlate it with Sysmon, Suricata, and Wazuh rather than treating the detection name as the complete investigation.
Get-WinEvent -FilterHashtable @{LogName='Microsoft-Windows-Windows Defender/Operational'; Id=1116} -MaxEvents 20 |
Select-Object TimeCreated, Id, RecordId, Message| Investigation question | Artifact or source | Example Wazuh DQL lookup |
|---|---|---|
| What hash was detected? | Defender 1116 message; Sysmon hash fields; Wazuh decoded event | data.win.eventdata.hashes:*SHA256* |
| What filename and path were involved? | Defender affected-resource field; Sysmon Event ID 11 | data.win.eventdata.targetFilename:*invoice.docm |
| Which IP address was contacted? | Sysmon Event ID 3; Suricata flow, http, or alert |
agent.name:"win11" AND (data.dstip:* OR data.win.eventdata.destinationIp:*) |
| Which domain was queried? | Sysmon Event ID 22; Suricata dns |
agent.name:"win11" AND data.win.system.eventID:22 |
| What launched the malware? | Sysmon Event ID 1 ParentImage, Image, CommandLine, ProcessGuid |
agent.name:"win11" AND data.win.eventdata.image:*malware.exe |
| Which user executed it? | Sysmon Event ID 1 User; Security 4688 when enabled |
agent.name:"win11" AND data.win.eventdata.user:* |
| Did PowerShell download it? | Sysmon Events 1, 3, and 22 correlated with Suricata HTTP/file records | agent.name:"win11" AND data.win.eventdata.image:*powershell.exe |
| Did it attempt persistence? | Sysmon registry events 12–14; scheduled-task events; service-install events | agent.name:"win11" AND (data.win.system.eventID:12 OR data.win.system.eventID:13 OR data.win.system.eventID:14) |
| Was lateral movement attempted? | Logons 4624/4625, remote-service activity, network connections to peer systems | agent.name:"win11" AND (data.win.system.eventID:4624 OR data.win.system.eventID:4625) |
| Was data exfiltration observed? | Suricata flow byte counts, HTTP transfers, DNS behavior, and destination context |
data.srcip:"192.168.1.40" AND data.flow.bytes_toserver:* |
-FilterHashtable filters the Windows log at the source, LogName selects the Defender Operational channel, Id=1116 selects malware detections, and -MaxEvents 20 bounds the output. Both IOC and IOA questions matter; the behavioral investigation supplies the chronology and context needed to explain the detection.
Threat Intelligence
Threat intelligence feeds frequently distribute IOCs.
Examples include:
Malicious domains
IP addresses
File hashes
URLs
Threat hunting frequently focuses on IOAs.
Examples include:
PowerShell abuse
Living-off-the-Land techniques
Credential dumping
Suspicious parent-child process relationships
Network reconnaissance
Future chapters will combine both approaches.
Common Student Mistake
Students often record only:
Hash
IP
Filename
Then stop.
Professional analysts also document:
Process ancestry
User activity
Network behavior
Timeline
Correlated events
MITRE ATT&CK® techniques
Detection rules triggered
Behavior tells the complete story.
Chapter Exercise 4.6
Perform the following activities.
Open Microsoft Word.
Launch PowerShell.
Perform a DNS lookup.
Browse to a website.
Download the EICAR file.
Observe Windows Defender detection.
Complete the following table.
| Activity | IOC | IOA |
|---|---|---|
| PowerShell | Process Name | Office launching PowerShell |
| DNS | Domain | PowerShell performing DNS |
| HTTP | Destination IP | Script downloading executable |
| Defender | Hash | Malware execution attempt |
From the investigation, students should identify at least:
Five IOCs
Five IOAs
IOC/IOA Worksheet
| Indicator | Type | Source | Confidence |
|---|---|---|---|
| SHA-256 | IOC | Sysmon | High |
| Domain | IOC | Suricata | Moderate |
| Office → PowerShell | IOA | Sysmon | High |
| Defender Quarantine | IOA | Defender | Very High |
This worksheet will become a recurring artifact throughout the remainder of the course.
Analyst Tradecraft Tip
Imagine an attacker changes:
Every filename
Every hash
Every domain
Every IP address
Would your SOC still detect the attack?
If your detections rely only on IOCs, perhaps not. If your detections focus on behaviors such as Office spawning PowerShell, suspicious parent-child processes, encoded commands, credential dumping, and unusual network communication, the answer is far more likely to be yes. Behavior is significantly harder to disguise than artifacts.
Key Concepts
By the end of this section, you should understand that:
IOCs identify specific artifacts associated with an incident.
IOAs identify attacker behaviors and techniques.
Effective SOC investigations collect both.
Behavioral detections remain useful even when attackers modify malware.
Modern detection engineering increasingly emphasizes behaviors over individual artifacts.
Looking Ahead
The next section introduces the MITRE ATT&CK® Framework, which provides a standardized language for describing attacker behavior (MITRE Corporation, n.d.-a). Students will map Sysmon events, Suricata alerts, Windows Defender detections, and Wazuh rules to ATT&CK tactics and techniques, learning to interpret investigations in terms of adversary objectives rather than isolated alerts. This framework will become the organizing model for threat hunting, detection engineering, purple teaming, and incident response throughout the remainder of the textbook. It also establishes a common vocabulary used by SOCs, incident response teams, and threat intelligence analysts worldwide.
4.8 Applying the MITRE ATT&CK® Framework to Investigations
Learning Objectives
After completing this section, you should be able to:
Explain the purpose of the MITRE ATT&CK Framework.
Differentiate between tactics and techniques.
Map Wazuh alerts to ATT&CK techniques.
Use ATT&CK during investigations.
Explain attacker objectives using standardized terminology.
Recognize how ATT&CK supports detection engineering and threat hunting.
Introduction
Suppose two analysts investigate the same attack.
One writes:
Malware probably downloaded another file.
The second writes:
Activity is consistent with T1105 – Ingress Tool Transfer following T1059.001 – PowerShell execution.
Which report is easier for another analyst to understand?
The second.
Why?
Because ATT&CK provides a standardized vocabulary. As introduced in Chapter 1, rather than inventing descriptions, analysts describe attacker behavior using common terminology understood throughout the cybersecurity community.
A Brief Recap
Chapter 1 introduced the MITRE ATT&CK Framework as a shared vocabulary for adversary behavior — a publicly available knowledge base documenting real-world attacker tactics and techniques (MITRE Corporation, n.d.-a). This section moves from that introduction to application: using ATT&CK as a working investigative framework to map telemetry, describe attack progressions, and communicate findings. Rather than cataloging malware, ATT&CK catalogs how attackers operate.
It answers questions such as:
How do attackers gain access?
How do they execute malicious code?
How do they establish persistence?
How do they evade defenses?
How do they steal credentials?
How do they move laterally?
How do they exfiltrate data?
ATT&CK focuses on behavior, making it an ideal companion to the IOC and IOA concepts introduced in the previous section (MITRE Corporation, n.d.-a).
Figure 4-27
ATT&CK Philosophy
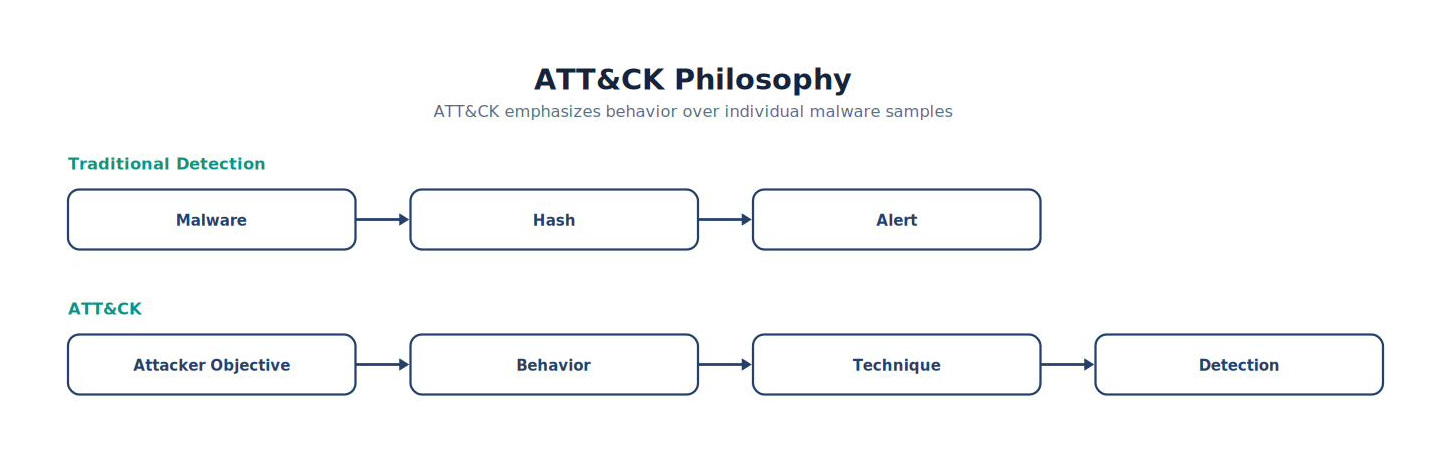
Note. The figure summarizes aTT&CK Philosophy and highlights the relationships among its principal elements, evidence sources, and analytical outcomes.
Notice that ATT&CK emphasizes behavior rather than individual malware samples.
ATT&CK Tactics
ATT&CK organizes attacker behavior into tactics.
A tactic answers the question:
What objective is the attacker trying to accomplish?
Common Enterprise tactics include:
| Tactic | Objective |
|---|---|
| Initial Access | Gain entry into the environment |
| Execution | Run malicious code |
| Persistence | Maintain long-term access |
| Privilege Escalation | Obtain higher privileges |
| Defense Evasion | Avoid detection |
| Credential Access | Obtain credentials |
| Discovery | Learn about the environment |
| Lateral Movement | Move to other systems |
| Collection | Gather information |
| Command and Control | Communicate with attacker infrastructure |
| Exfiltration | Remove data |
| Impact | Disrupt, destroy, or encrypt systems |
Think of tactics as the attacker’s goals.
ATT&CK Techniques
Each tactic contains one or more techniques.
A technique answers the question:
How did the attacker accomplish the objective?
Example:
| Tactic | Technique |
|---|---|
| Execution | T1059 – Command and Scripting Interpreter |
| Execution | T1059.001 – PowerShell |
| Discovery | T1083 – File and Directory Discovery |
| Credential Access | T1003 – OS Credential Dumping |
| Command and Control | T1071 – Application Layer Protocol |
Techniques describe specific behaviors observed during an attack.
Analyst Tradecraft Tip
Students often memorize ATT&CK IDs. That is not the objective. The objective is understanding behavior. If you understand what PowerShell abuse looks like, you can always look up T1059.001. Understanding is more valuable than memorization.
Mapping Laboratory Events to ATT&CK
Throughout this textbook, students will map their laboratory activities to ATT&CK.
| Laboratory Activity | ATT&CK Technique |
|---|---|
| PowerShell execution | T1059.001 |
| DNS lookups | T1071.004 (DNS) (when used for C2) |
| HTTP downloads | T1105 |
| Scheduled task creation | T1053 |
| Network scanning | T1046 |
| Credential dumping | T1003 |
Notice that one investigation often maps to multiple techniques.
Figure 4-28
Mapping Events to ATT&CK
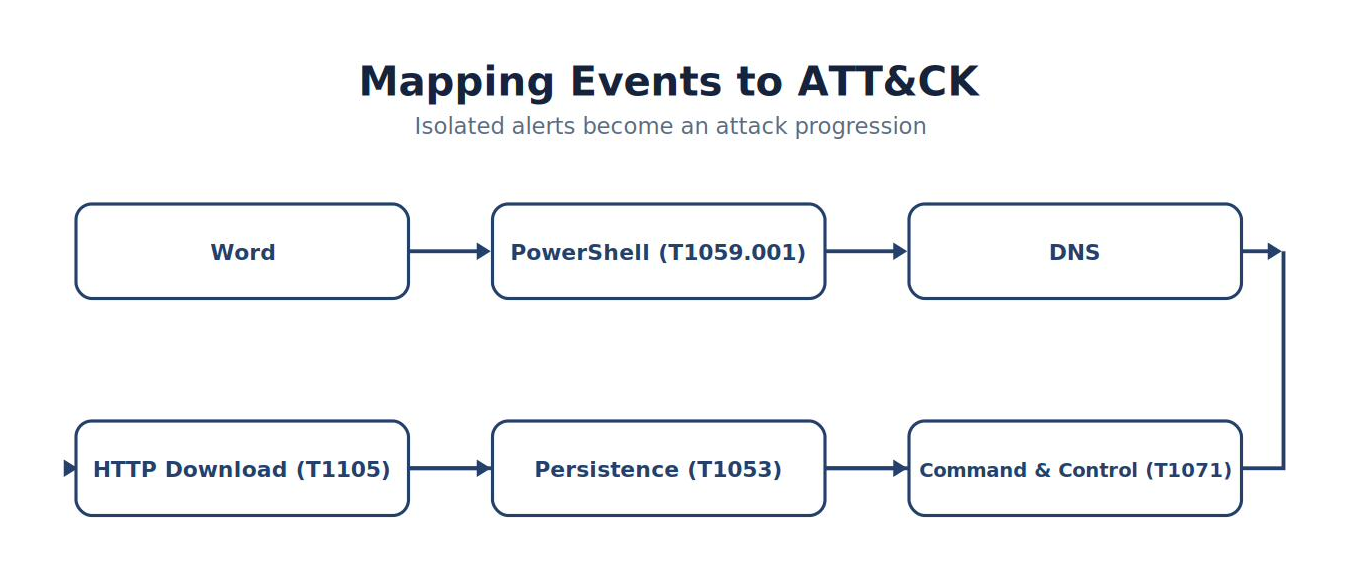
Note. The figure maps the principal dimensions of mapping Events to ATT&CK so analysts can compare relationships, identify gaps, and prioritize follow-up work.
ATT&CK and Wazuh
Many Wazuh rules include ATT&CK mappings.
An alert may contain information similar to:
ATT&CK Tactic
ATT&CK Technique
ATT&CK ID
Students should learn to identify these mappings when reviewing alerts. They provide valuable context and facilitate communication among analysts.
ATT&CK and Sysmon
Sysmon provides telemetry for many ATT&CK techniques.
Examples include:
| Sysmon Event | ATT&CK Examples |
|---|---|
| Event ID 1 | Execution |
| Event ID 3 | Command and Control |
| Event ID 8 | Process Injection |
| Event ID 11 | Tool Transfer |
| Event ID 22 | DNS-based C2 |
Notice that Sysmon does not “detect ATT&CK.” Rather, it records telemetry associated with behaviors described in ATT&CK.
ATT&CK and Suricata
Suricata observes attacker behavior occurring on the network.
Examples include:
| Suricata Detection | Possible ATT&CK Mapping |
|---|---|
| Port Scan | T1046 – Network Service Discovery |
| HTTP Malware Download | T1105 – Ingress Tool Transfer |
| DNS Tunnel | T1071.004 – DNS |
| Command-and-Control Traffic | T1071 – Application Layer Protocol |
Network telemetry frequently provides evidence supporting ATT&CK mappings identified from endpoint activity.
ATT&CK and Threat Hunting
Threat hunting often begins with ATT&CK.
Instead of searching for:
Malware hash
Hunters search for:
Office spawning PowerShell
Encoded PowerShell commands
Unusual parent-child processes
Credential dumping behavior
Network reconnaissance
Remote service creation
Behavior survives even when malware changes.
Building an ATT&CK Timeline
Consider the following investigation.
| Time | Event | ATT&CK |
|---|---|---|
| 10:01 | Word Opened | User Activity |
| 10:03 | PowerShell | T1059.001 |
| 10:04 | DNS Query | T1071.004 (if malicious C2) |
| 10:05 | HTTP Download | T1105 |
| 10:07 | Scheduled Task | T1053 |
| 10:08 | Beaconing | T1071 |
Rather than merely listing events, the analyst now describes attacker objectives.
Common Student Mistake
Students sometimes assume:
Every PowerShell execution equals T1059.001. Technically, PowerShell execution may correspond to that technique, but context determines whether it represents legitimate administration or malicious activity. ATT&CK describes behaviors. It does not automatically imply malicious intent. Evidence and context remain essential.
Chapter Exercise 4.7
Repeat the authorized WIN11 exercise and record the timestamp before generating telemetry. Complete Progressive Lab PL-00A first: its scoped Defender exclusion, YARA rule, and helper scripts must already exist under C:\WazuhLabs. Do not substitute real malware or use this procedure on a production endpoint.
WIN11 · PowerShell (Administrator)
Start-Transcript -LiteralPath 'C:\WazuhLabs\evidence\attack-mapping-session.txt' -Append
Get-Date -Format o
Resolve-DnsName google.com
Start-Process 'https://google.com'
Invoke-WebRequest -Uri 'https://google.com' -UseBasicParsing |
  Select-Object StatusCode, StatusDescription, RawContentLength

& 'C:\WazuhLabs\Scripts\Lab_00A_Create_Controlled_EICAR_Test_File_v20.ps1' -ConfirmControlledLab
$TestDirectory = 'C:\WazuhLabs\YARA\EICAR-Test'
Remove-MpPreference -ExclusionPath $TestDirectory
Start-MpScan -ScanType CustomScan -ScanPath $TestDirectory
& 'C:\WazuhLabs\Scripts\Lab_00A_Review_Defender_EICAR_Events_v20.ps1'
Stop-Transcript
The sequence records the session, creates DNS and HTTPS activity, invokes the controlled EICAR helper, removes the temporary exclusion, asks Defender to scan only the test directory, and reviews recent Defender evidence. Defender may quarantine the EICAR artifact before Start-MpScan; do not recreate it repeatedly. In Wazuh Dashboard → Discover, set the time selector around the recorded timestamp and try agent.name:"win11" AND data.win.system.eventID:22 for Sysmon DNS activity, agent.name:"win11" AND data.win.system.eventID:1116 for Defender detections, and agent.name:"win11" AND data.win.eventdata.image:*powershell.exe for PowerShell process evidence. Suricata results appear only when the laboratory sensor can observe WIN11 traffic.
| Syntax element | Purpose |
|---|---|
Start-Transcript -LiteralPath ... -Append |
Records the PowerShell commands and output at the exact evidence path without discarding an existing transcript. |
Get-Date -Format o |
Records an ISO 8601 timestamp with fractional seconds and UTC offset for later correlation. |
Resolve-DnsName google.com |
Generates a controlled DNS query and displays the returned records. |
Start-Process 'https://google.com' |
Opens the URL in the endpoint’s default browser. |
Invoke-WebRequest -Uri ... -UseBasicParsing |
Generates an HTTPS request; -Uri supplies the destination and -UseBasicParsing avoids the legacy Internet Explorer dependency in Windows PowerShell 5.1. |
& '...ps1' -ConfirmControlledLab |
The call operator (&) runs the named helper; the mandatory switch confirms use on the authorized laboratory endpoint. |
Remove-MpPreference -ExclusionPath |
Removes only the temporary PL-00A Defender exclusion before detection validation. |
Start-MpScan -ScanType CustomScan -ScanPath |
Runs a Defender custom scan restricted to the controlled test directory. |
Stop-Transcript |
Closes the session record so it can be preserved and hashed. |
Complete the following table using the events actually observed; do not claim an ATT&CK mapping merely because the example command ran.
| Activity | ATT&CK Tactic | ATT&CK Technique | Evidence Source |
|---|---|---|---|
| PowerShell | Execution | T1059.001 | Sysmon |
| DNS | Command & Control (context dependent) | T1071.004 | Sysmon |
| HTTP Download | Command & Control / Tool Transfer | T1105 | Suricata |
| Defender Detection | N/A (Defender observation) | Evidence supporting execution | Defender |
Students should explain why they selected each mapping and identify any assumptions made.
ATT&CK Mapping Worksheet
| Observation | ATT&CK | Confidence | Supporting Evidence |
|---|---|---|---|
| PowerShell | T1059.001 | High | Sysmon Event ID 1 |
| HTTP Download | T1105 | High | Suricata |
| Scheduled Task | T1053 | High | Sysmon |
This worksheet becomes part of every major investigation later in the course.
Analyst Tradecraft Tip
Map observed behavior—not assumptions—to ATT&CK.
Compare two descriptions of the same event. “PowerShell downloaded a file” records a useful observation. “Evidence is consistent with Execution (T1059.001) followed by Ingress Tool Transfer (T1105); supporting telemetry came from Sysmon, Suricata, Defender, and Wazuh” communicates the behavior, mapping, and evidentiary basis. Professional teams use ATT&CK to describe adversary behavior in standardized, technology-neutral language, but each mapping must remain traceable to evidence (MITRE Corporation, n.d.-a).
Key Concepts
By the end of this section, you should understand that:
ATT&CK is a framework describing adversary behavior, not malware.
Tactics describe attacker objectives.
Techniques describe how those objectives are accomplished.
Wazuh, Sysmon, and Suricata provide telemetry that can be mapped to ATT&CK.
ATT&CK improves communication, detection engineering, threat hunting, and incident response.
Context is essential—an ATT&CK technique describes behavior, but additional evidence is required to determine whether the behavior is malicious.
Looking Ahead
The next section introduces MITRE ATT&CK Navigator, where students will visualize detections across the ATT&CK matrix, identify coverage gaps within their laboratory SOC, and measure which adversary behaviors are currently detectable. They will use the telemetry generated throughout the course to build their first ATT&CK heat maps, assess detection maturity, and prioritize improvements. This marks the beginning of detection engineering, where the goal shifts from simply responding to alerts to deliberately improving the SOC’s ability to detect attacker behavior.
4.9 Measuring Detection Coverage with MITRE ATT&CK Navigator
Learning Objectives
After completing this section, you should be able to:
Explain the purpose of MITRE ATT&CK Navigator.
Visualize detection coverage across ATT&CK techniques.
Identify strengths and weaknesses within your SOC.
Build an ATT&CK heat map.
Measure detection maturity.
Prioritize future detection engineering efforts.
Introduction
Suppose someone asks:
“How good is your SOC?”
Many beginning analysts answer:
“We have Wazuh.”
Or:
“We use Suricata.” Neither answer measures detection capability. Professional SOCs measure coverage, not products.
Coverage answers questions such as:
Which ATT&CK techniques can we detect?
Which techniques have partial visibility?
Which techniques have no visibility at all?
Which detections require improvement?
ATT&CK Navigator provides a visual method for answering these questions.
What Is ATT&CK Navigator?
MITRE ATT&CK Navigator is a visualization tool that allows analysts to map techniques onto the ATT&CK matrix. Instead of reading long technique lists, analysts see a visual representation of detection coverage. Think of it as a map of your SOC’s current visibility.
Figure 4-29
Detection Coverage Concept
Note. The figure maps the principal dimensions of detection Coverage Concept so analysts can compare relationships, identify gaps, and prioritize follow-up work.
The objective is not to make every square green. The objective is to understand where your visibility exists—and where it does not.
Why Coverage Matters
Imagine two SOCs.
SOC A
Detects PowerShell
Detects DNS
Detects HTTP
Detects Malware
SOC B
Detects PowerShell
Detects DNS
Detects HTTP
Detects Malware
Detects Credential Dumping
Detects Lateral Movement
Detects Persistence
Detects Defense Evasion
Which SOC is more mature?
Clearly SOC B. Coverage provides an objective method for measuring detection capability.
Our Laboratory Coverage
By the end of Chapter 4, our SOC detects behavior associated with several ATT&CK techniques.
| Technique | Detection Source |
|---|---|
| T1059.001 PowerShell | Sysmon |
| T1046 Network Service Discovery | Suricata |
| T1105 Ingress Tool Transfer | Suricata |
| T1071 Application Layer Protocol | Suricata |
| T1053 Scheduled Tasks (later labs) | Sysmon |
This list will grow throughout the semester.
Analyst Tradecraft Tip
Coverage is never finished. Test it continuously.
Detection Maturity
ATT&CK Navigator supports user-defined technique scores and color gradients for visualizing defensive coverage, but MITRE does not prescribe the meanings of a 0–5 scale (MITRE Corporation, n.d.-c). The following is therefore an Alerts to Answers instructional rubric, not an official ATT&CK maturity model. It is also distinct from the NIST CSF Implementation Tiers and the broader SOC/SIEM capability discussion in Section 2.12: this rubric asks how well the laboratory detects and validates one technique.
| Level | Description |
|---|---|
| 0 | No visibility |
| 1 | Minimal detection |
| 2 | Basic detection |
| 3 | Correlated detection |
| 4 | High-confidence detection |
| 5 | Automated response and continuous validation |
Assign a score only after recording the telemetry, analytic, validation result, and known visibility gaps that justify it. The laboratory aims to progress from Levels 1–2 toward Levels 3–4 as students add correlation, custom rules, and repeatable testing; Level 5 additionally requires an authorized response workflow and continuing validation.
Building a Heat Map
Use an ATT&CK Navigator layer to translate the documented rubric scores into a colorized view. Colors summarize the recorded evidence; they do not independently prove detection coverage. MITRE cautions that one detected implementation of a technique is not sufficient reason to declare the entire technique covered (MITRE Corporation, n.d.-a).
Figure 4-30
Example Laboratory Detection-Coverage Heat Map
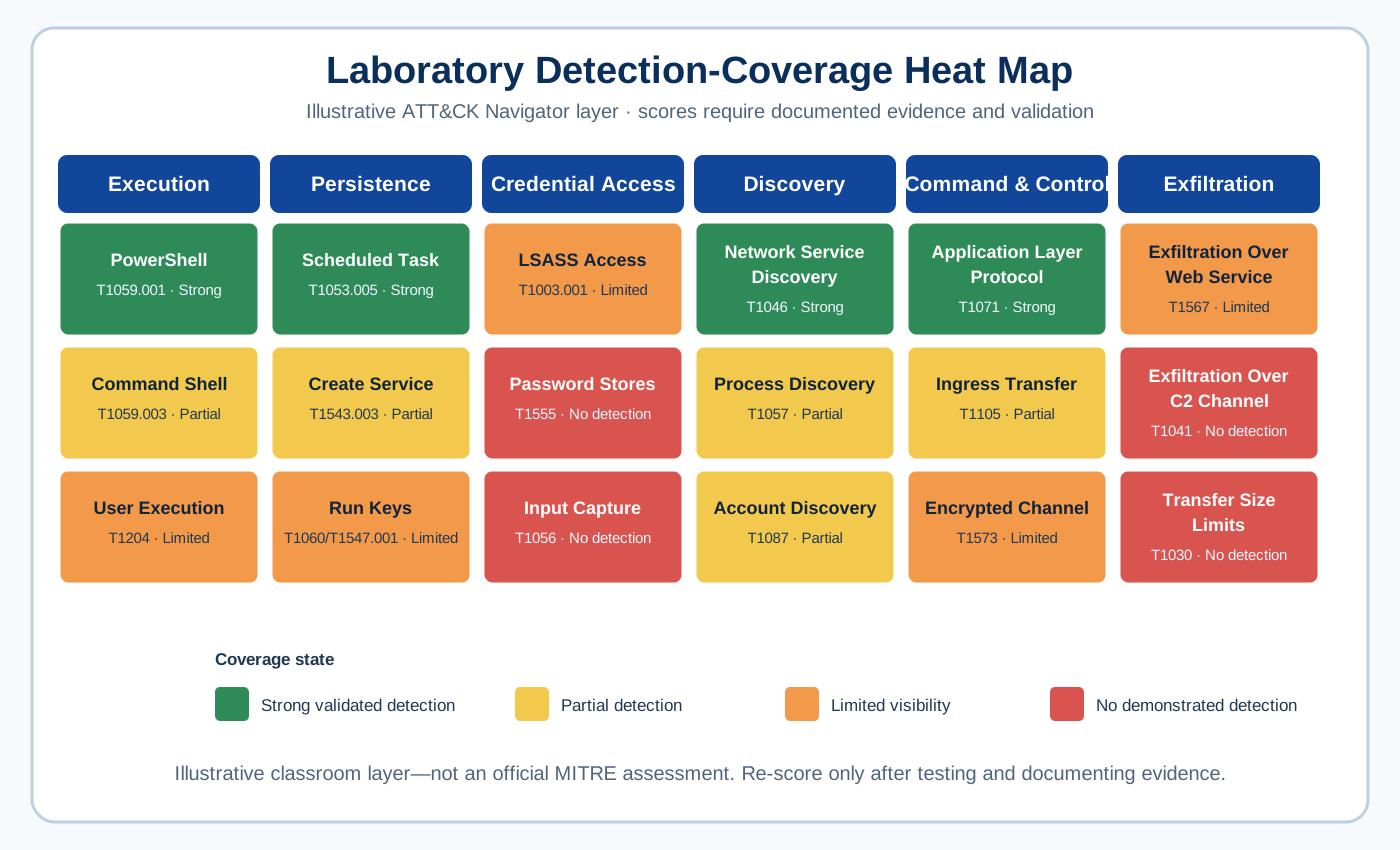
Note. This illustrative layer uses the book’s locally defined rubric. Green indicates strong validated detection, yellow partial detection, orange limited visibility, and red no demonstrated detection. It is not an official MITRE assessment of the laboratory.
Notice that weaknesses become obvious.
Mapping Laboratory Exercises
Each laboratory contributes additional ATT&CK coverage.
| Lab | ATT&CK Focus |
|---|---|
| Sysmon | Execution |
| Suricata | Discovery, Command & Control |
| Defender | Malware |
| PowerShell | Execution |
| Nmap | Discovery |
| EICAR | Tool Transfer |
| Scheduled Tasks | Persistence |
Students should update their Navigator layer after every completed lab. By the end of the course, the heat map becomes a visual record of their learning.
Coverage Does Not Equal Prevention
Another common misconception:
Detection means protection. Not necessarily.
Detection answers:
Did we observe the activity?
Prevention answers:
Did we stop the activity?
Many organizations intentionally detect behaviors they choose not to block because the operational cost of false positives would be too high. Understanding this distinction is essential for designing practical security operations.
Identifying Detection Gaps
After mapping existing detections, ask:
Which ATT&CK tactics have little or no visibility?
Which techniques rely on only one sensor?
Where would additional logging improve confidence?
Which custom Wazuh rules should we develop?
Would Sysmon configuration changes improve coverage?
Would additional Suricata signatures increase visibility?
Detection engineering is a process of continuous improvement.
Common Student Mistake
Students often celebrate every new detection.
Professional engineers ask a different question:
What still goes undetected?
The objective is not simply to add detections. The objective is to reduce unknown risk.
Chapter Exercise 4.8
Using the laboratory completed so far:
Review recent Wazuh alerts.
Identify the associated ATT&CK techniques.
Assign each technique a maturity level (0–5).
Create a simple coverage table.
Identify three techniques for which your SOC currently has little or no visibility.
Recommend one improvement for each gap.
Sample Coverage Assessment
| ATT&CK Technique | Evidence Source | Maturity | Improvement |
|---|---|---|---|
| T1059.001 | Sysmon | 3 | Add custom Wazuh correlation |
| T1046 | Suricata | 3 | Tune ET Open rules |
| T1105 | Suricata | 3 | Add file hash correlation |
| T1003 | None | 0 | Create detection lab later |
| T1021 | None | 0 | Add lateral movement exercises |
This table evolves as students complete additional chapters.
Designing Better Detections
Suppose students identify weak coverage for:
Credential Dumping.
Possible improvements include:
Enable additional Sysmon logging.
Develop custom Wazuh rules.
Simulate Mimikatz in an isolated lab.
Correlate LSASS access with PowerShell activity.
Map detections to ATT&CK.
Notice that detection engineering is an iterative cycle.
Detection Engineering Workflow
Figure 4-31
From Identify Gap to Repeat
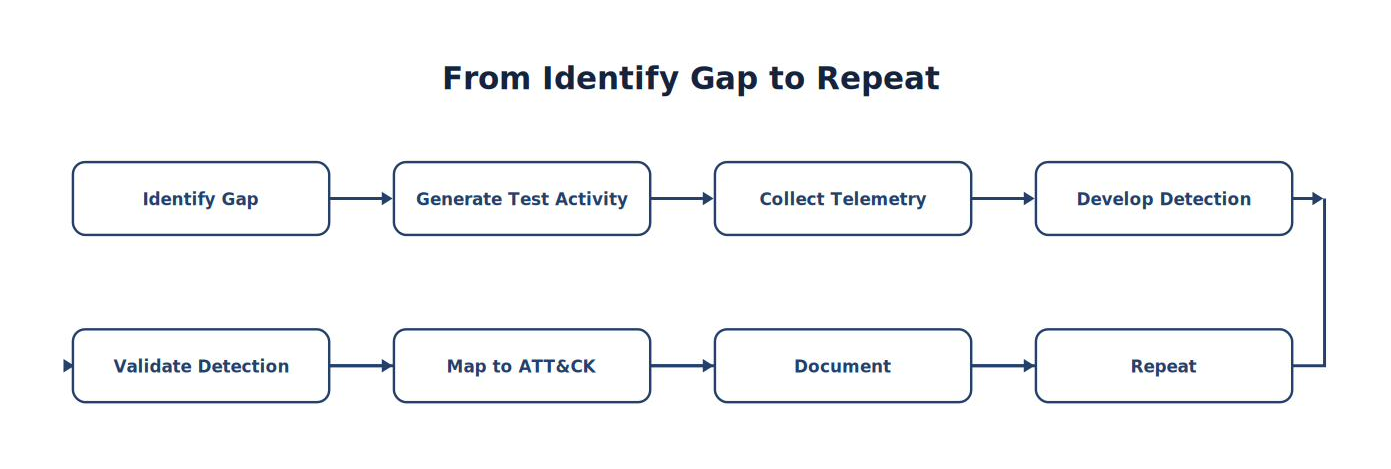
Note. The sequence traces how Identify Gap progresses to Repeat, emphasizing the intermediate evidence and processing steps.
This workflow becomes the foundation for later chapters on custom rule creation and purple teaming.
Think Like a Detection Engineer
Imagine your organization experiences an incident involving lateral movement. After the investigation, you discover that your SOC had excellent visibility into execution, but almost no visibility into remote administration protocols.
Rather than asking:
“Why didn’t Wazuh detect it?”
A better question is:
“What telemetry, rules, or sensors would have allowed us to detect it?” That shift—from blaming tools to improving coverage—is the hallmark of a mature detection engineering mindset.
Key Concepts
By the end of this section, you should understand that:
Detection coverage is more meaningful than simply listing security tools.
ATT&CK Navigator provides a visual representation of SOC visibility.
Detection maturity can be measured and improved over time.
Coverage assessments help prioritize engineering efforts.
Effective SOCs continuously identify, validate, and close detection gaps.
Chapter Summary
Congratulations. By completing Chapter 4, you have transitioned from building a Security Operations Center to operating one.
You can now:
Navigate the Wazuh Dashboard confidently.
Conduct structured investigations.
Use Discover to search millions of events efficiently.
Build and analyze timelines.
Correlate endpoint and network telemetry.
Develop and test investigative hypotheses.
Write professional incident reports.
Preserve digital evidence.
Differentiate IOCs from IOAs.
Map activity to the MITRE ATT&CK Framework.
Measure your SOC’s detection coverage using ATT&CK Navigator.
These skills form the analytical foundation required for the remainder of this textbook.
Chapter 4 Key Terms
| Term | Definition |
|---|---|
| Correlation | Associating multiple related events — across time, host, user, or network, and often from multiple telemetry sources — into a single coherent picture that identifies meaningful activity. |
| Discover | The Wazuh Dashboard’s primary search and investigation interface. |
| Hypothesis-Driven Investigation | An investigative approach in which an analyst proposes possible explanations and tests them against evidence rather than assuming a conclusion. |
| Indicator of Attack (IOA) | Evidence of attacker behavior or technique in progress, independent of specific malware or infrastructure. |
| Indicator of Compromise (IOC) | A static forensic artifact — file hash, IP, domain, URL, or filename — associated with a known threat and suggesting compromise. |
| MITRE ATT&CK | A publicly available, globally used knowledge base of adversary tactics and techniques, based on real-world observations, each assigned a unique identifier. |
| MITRE ATT&CK Navigator | A visualization tool used to map, track, and score detection coverage against the ATT&CK matrix. |
| Sub-technique | A more specific variation of a MITRE ATT&CK technique, denoted with a decimal suffix (e.g., T1059.001). |
| Tactic | The adversary’s tactical goal in MITRE ATT&CK (e.g., Execution, Persistence, Command and Control). |
| Technique | The specific method an adversary uses to achieve a tactic, identified by a unique ID (e.g., T1059). |
| Timeline Analysis | Reconstructing the chronological sequence of events surrounding a security alert. |
Knowledge Check
Select the best answer for each question.
1. What is the primary purpose of the Discover interface in Wazuh?
A. To configure agent installation
B. To write Suricata rules
C. To search, filter, and investigate security events
D. To manage VMware snapshots
2. Why do experienced analysts expand the time window before and after an alert?
A. To reduce the number of events displayed
B. To reveal related activity that provides context for the investigation
C. To improve Suricata performance
D. It is required by the Wazuh license
3. Which best describes an Indicator of Compromise (IOC)?
A. A tactic used by MITRE ATT&CK
B. A category of Wazuh detection rule severity
C. A type of VMware network adapter
D. A forensic artifact such as a file hash, IP address, or domain tied to a known threat
4. Which best describes an Indicator of Attack (IOA)?
A. Evidence of attacker behavior or technique in progress, regardless of the specific tool used
B. A signature-based antivirus detection
C. A firewall configuration setting
D. A Suricata rule category
5. In MITRE ATT&CK, what does a technique ID such as T1059.001 represent?
A. A tactic
B. A Suricata signature ID
C. A Wazuh rule ID
D. A sub-technique — in this case, PowerShell under Command and Scripting Interpreter
6. Which MITRE ATT&CK tactic best describes T1003 (OS Credential Dumping)?
A. Discovery
B. Exfiltration
C. Credential Access
D. Initial Access
7. What is the purpose of the MITRE ATT&CK Navigator in a SOC?
A. To visualize and measure which adversary techniques the SOC can currently detect
B. To replace the Wazuh Dashboard
C. To install Suricata rules automatically
D. To generate VMware snapshots
8. Why should analysts avoid forming a conclusion before collecting evidence?
A. Evidence collection is optional in professional investigations
B. Premature conclusions introduce confirmation bias and can lead to incorrect findings
C. Wazuh requires evidence to be collected in a specific order
D. It has no real effect on investigation quality
9. What is the main goal of professional incident documentation?
A. To satisfy a checklist requirement
B. To reduce the number of alerts generated
C. To automatically close tickets
D. To allow another analyst to understand and reproduce your reasoning without speaking to you
10. Why is correlating endpoint and network telemetry more valuable than examining either source alone?
A. It reduces the total number of alerts
B. It is required by Wazuh licensing
C. No single sensor sees the entire attack; combining sources produces a more complete and reliable picture
D. Network telemetry is always more accurate than endpoint telemetry
Chapter Discussion Questions
Why does a broad, expanding search strategy typically outperform a narrow search focused only on the original alert?
Explain the difference between an Indicator of Compromise and an Indicator of Attack, and give an example of each from this chapter.
Why is mapping an investigation to MITRE ATT&CK more useful than simply describing what happened in plain language?
Describe how you would test a hypothesis during an investigation rather than simply accepting your first explanation.
Why does professional incident documentation matter even when an alert turns out to be a false positive?
Explain how the MITRE ATT&CK Navigator could be used to identify gaps in a SOC’s detection coverage.
Walk through how you would correlate a Sysmon PowerShell event with a Suricata network alert during an investigation.
Looking Ahead — Chapter 5
Chapter 5 shifts from investigating alerts to engineering detections. Students will begin writing and tuning Wazuh rules, customizing Sysmon configurations, developing local Suricata signatures, reducing false positives, validating detections with controlled attack simulations, and measuring improvements using ATT&CK. By the end of the chapter, students will no longer be passive users of security tools—they will be capable of designing, testing, and maintaining their own detection capabilities, which is the defining skill of a modern Detection Engineer and an advanced Security Operations Center analyst.
Further Resources
MITRE ATT&CK (https://attack.mitre.org) — Look up any technique ID you encounter in an alert.
MITRE ATT&CK Navigator (https://mitre-attack.github.io/attack-navigator/) — Build the coverage layers described in section 4.9.
NIST SP 800-86 — Guide to Integrating Forensic Techniques into Incident Response (https://csrc.nist.gov/pubs/sp/800/86/final) — Evidence handling principles that underpin section 4.6.
Rich, M. S. (2026). Advanced network forensics: A cyber-behavioral science approach. John Wiley & Sons. — Secondary reading on adding behavioral context to technical evidence.
Wazuh — User Manual (https://documentation.wazuh.com/current/user-manual/index.html) — Dashboard and Discover reference used throughout this chapter.