

Chapter Overview
Course Progression
This chapter prepares students for Progressive Labs PL-01 and PL-02, where they apply SIEM navigation, event interpretation, configuration, and attack analysis. Chapter Exercises are embedded practice; Progressive Labs are cumulative investigations. See Course Progression and Progressive Lab Alignment in the front matter.
Organizations generate security data across endpoints, networks, servers, applications, identity systems, and cloud platforms. Each source is useful, but fragmented telemetry creates an operational problem: how does an analyst investigate activity when the evidence is scattered across dozens of systems?
Security Information and Event Management (SIEM) platforms address that problem by collecting telemetry from diverse sources, organizing it for search and analysis, correlating related activity, and presenting useful context to analysts.
Throughout the remainder of this textbook, Wazuh will serve as our SIEM platform. Before installing and configuring Wazuh, however, it is essential to understand why SIEM technology exists and how it fundamentally changes the way organizations detect and investigate cyber threats.
Learning Objectives
After completing this chapter, you should be able to:
- Define Security Information and Event Management (SIEM).
- Explain the historical problems SIEM platforms were designed to solve.
- Describe the components of a SIEM architecture.
- Explain log collection, normalization, correlation, and enrichment.
- Differentiate between log management and security analytics.
- Explain how Wazuh fits into the modern SIEM ecosystem.
- Explain why centralized visibility dramatically improves investigations.
Opening Scenario
The Impossible Investigation
Imagine that you have been assigned your first investigation. A workstation has apparently downloaded malware. Management wants answers. You begin collecting evidence. The Windows administrator sends you Windows Event Logs. The network administrator exports firewall logs. The Linux administrator emails authentication logs. The email administrator provides Exchange audit records. Microsoft Defender exports malware detection logs. Suricata provides IDS alerts (Open Information Security Foundation, n.d.). The VPN administrator sends authentication records. Each log file looks different. Each uses different timestamps. Some use local time. Others use Coordinated Universal Time (UTC). Some identify users by username. Others use security identifiers (SIDs). One records IP addresses. Another records hostnames. Nothing appears to line up. The evidence exists.
The challenge is making sense of it. This is precisely the problem that SIEM technology was created to solve.
2.1 What Is a SIEM?
A Security Information and Event Management (SIEM) platform centralizes security telemetry for storage, search, analysis, correlation, and presentation (Gartner, n.d.-b). This unified view supports monitoring and investigation, while log-management practices govern the supporting processes for generating, transmitting, storing, accessing, and disposing of log data (Kent & Souppaya, 2006).
A SIEM answers questions such as:
- Which systems generated alerts today?
- Which users authenticated unsuccessfully?
- Which endpoints communicated with malicious IP addresses?
- Did multiple security products observe the same activity?
- Which systems are no longer reporting telemetry?
- Which alerts require immediate investigation?
Instead of manually assembling this information, analysts search a centralized repository.
Breaking Down the Name
The term SIEM consists of two earlier technologies.
Security Information Management (SIM)
Originally focused on:
Long-term log storage
Compliance reporting
Historical analysis
Audit support
Organizations primarily used SIM systems to retain logs for months or years.
Security Event Management (SEM)
Focused on:
Real-time monitoring
Alert generation
Correlation
Incident response
SEM systems emphasized operational monitoring rather than historical reporting. Modern SIEM platforms combine both capabilities.
They simultaneously support:
Real-time investigations
Historical analysis
Regulatory compliance
Threat hunting
Security reporting
Operational dashboards
Figure 2-1
Evolution of SIEM
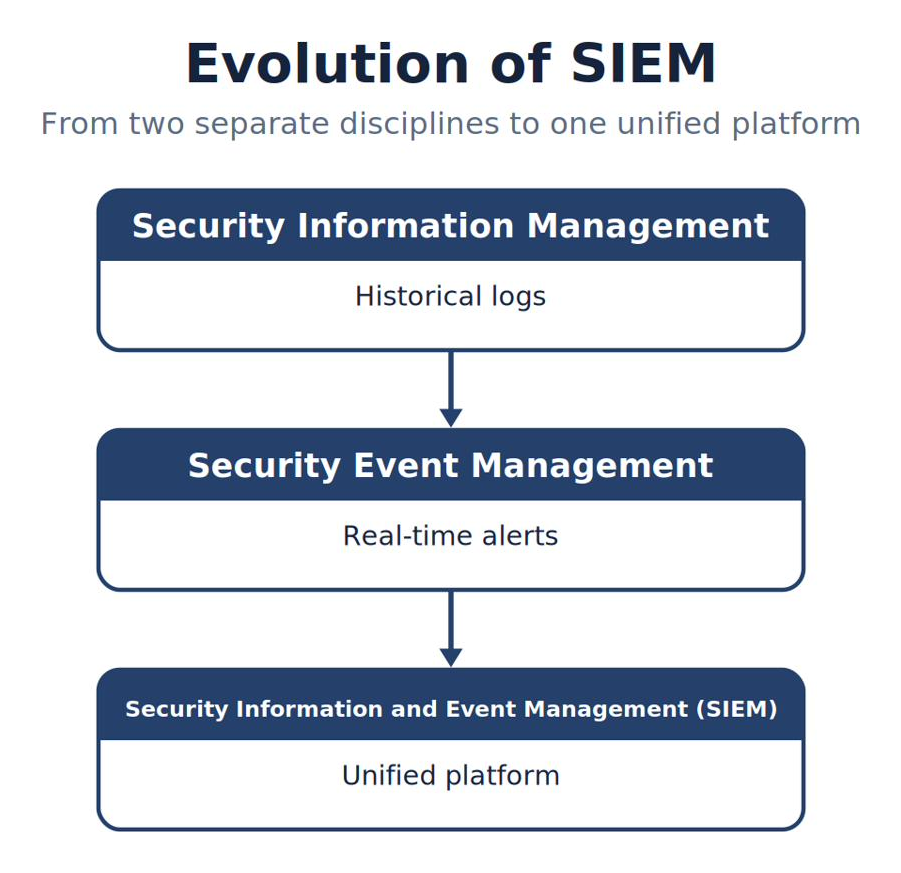
Note. The figure traces the progression represented by evolution of SIEM, showing how capabilities become more integrated, repeatable, and evidence driven.
Why Organizations Needed SIEM
Before SIEM platforms became common, every security device operated independently. Consider a typical organization. Each technology maintained its own logs.
Firewall → Firewall Logs
Windows → Windows Event Logs
Linux → Syslog
Suricata → eve.json
Microsoft Defender → Defender Operational Log
An analyst investigating an incident might spend hours locating information before the actual investigation could even begin. This process was slow, error-prone, and often incomplete. SIEM platforms eliminated much of this manual effort.
Figure 2-2
Security Before SIEM
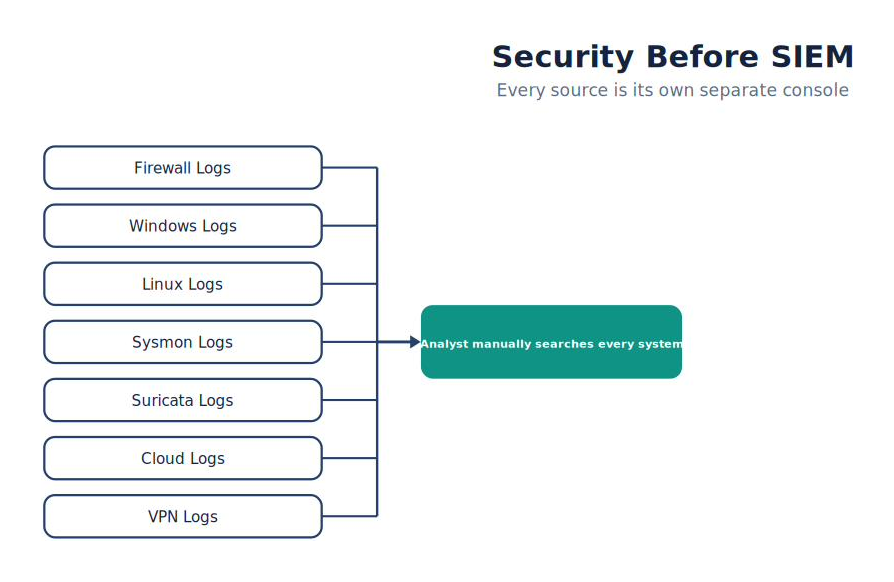
Note. The comparison highlights the operational differences represented by security Before SIEM and shows why the distinction matters during analysis.
Figure 2-3
Security After SIEM
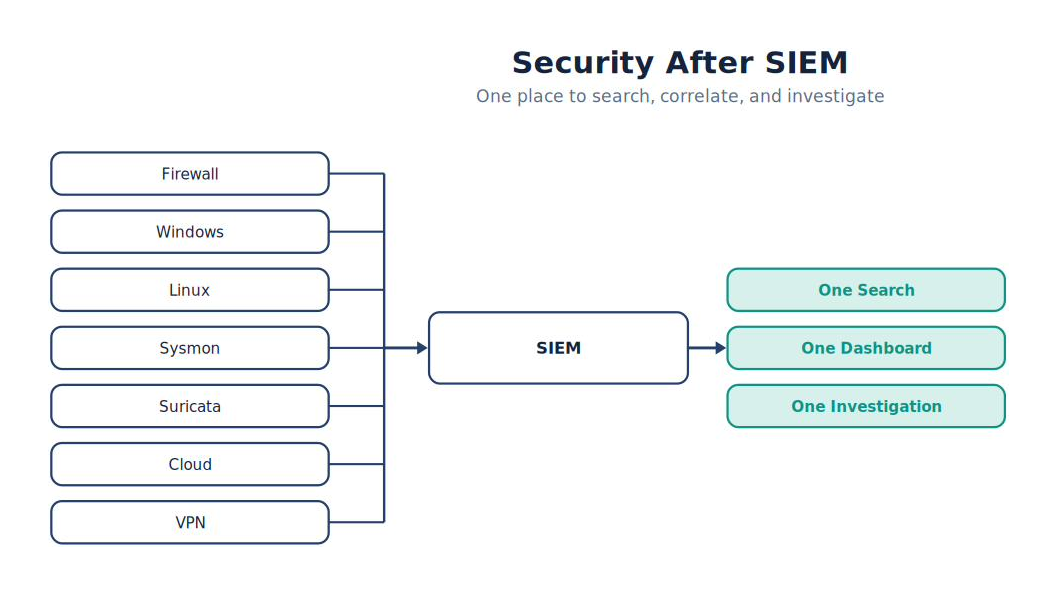
Note. The comparison highlights the operational differences represented by security After SIEM and shows why the distinction matters during analysis.
Analyst Tradecraft Tip
A SIEM is only as reliable as the telemetry and logic behind it.
Poor inputs produce poor conclusions.
The Four Fundamental Functions of a SIEM
Every modern SIEM performs four primary tasks.
1. Collection
Receive telemetry from many sources.
Examples include:
- Windows Event Logs — channels such as
Security,System, andApplication - Sysmon
- Suricata
- Linux Syslog
- Firewalls
- Endpoint Detection and Response (EDR)
- Cloud Platforms
- Authentication Services
Collection is the foundation. Without data, nothing else is possible.
2. Normalization
Every technology records information differently.
For example, Windows may identify a username as:
DOMAIN
Linux records:
jdoe
Cloud identity systems may use:
Normalization transforms different formats into consistent fields that can be searched and correlated together. This dramatically simplifies investigations.
3. Correlation
Correlation is where a SIEM begins adding value. Instead of examining events individually, the SIEM looks for relationships.
For example:
Sysmon → PowerShell Started
Suricata → HTTP Download
Windows Defender → Malware Quarantined → One Investigation
Individually, these appear unrelated. Together, they describe an attack sequence. Correlation transforms isolated observations into meaningful investigations.
4. Presentation
Finally, the SIEM presents information through:
Dashboards
Searches
Alerts
Reports
Visualizations
Timelines
Presentation allows analysts to focus on investigation rather than manually assembling data.
Best Practice
A SIEM should reduce analyst workload—not increase it. If a SIEM produces thousands of unactionable alerts every day, analysts quickly become overwhelmed. This condition is known as alert fatigue. Throughout this textbook, you’ll learn that an effective SOC continuously tunes its detection rules to maximize useful alerts while minimizing unnecessary noise.
Looking Ahead
In the next section, we’ll examine the complete SIEM architecture, following a single event as it travels from an endpoint, through the Wazuh Agent, into the Wazuh Manager, through decoders and rules, into the Indexer, and finally onto the Dashboard where a SOC analyst begins an investigation. This data pipeline is the foundation of every lab and every investigation that follows in the remainder of the book.
2.2 The SIEM Data Pipeline
Learning Objectives
After completing this section, you should be able to:
Describe the complete lifecycle of a security event within a SIEM.
Explain the role of agents, managers, decoders, rules, and dashboards.
Identify where security telemetry can be lost.
Troubleshoot missing alerts by following the telemetry pipeline.
Understand how Wazuh implements a modern SIEM architecture.
Every Alert Has a Journey
One of the most valuable skills a SOC analyst can develop is understanding where security information comes from and how it reaches the dashboard. Many beginning analysts see an alert appear in Wazuh and think the SIEM somehow “found” the attack. That is not what actually happened. Every alert shown on the Dashboard has traveled through multiple systems before reaching the analyst. Understanding this journey makes troubleshooting significantly easier.
Whenever an alert is missing, the question becomes:
Where did the telemetry stop?
The Journey Begins at the Endpoint
Every investigation starts somewhere.
Perhaps a user:
Opens Microsoft Word.
Launches PowerShell.
Downloads a file.
Connects a USB drive.
Logs into Windows.
Runs Nmap.
Visits a malicious website.
These actions are ordinary operating system activities. The operating system records them. Security software observes them. Telemetry is generated. Nothing has reached Wazuh yet.
Figure 2-4
Event Generation
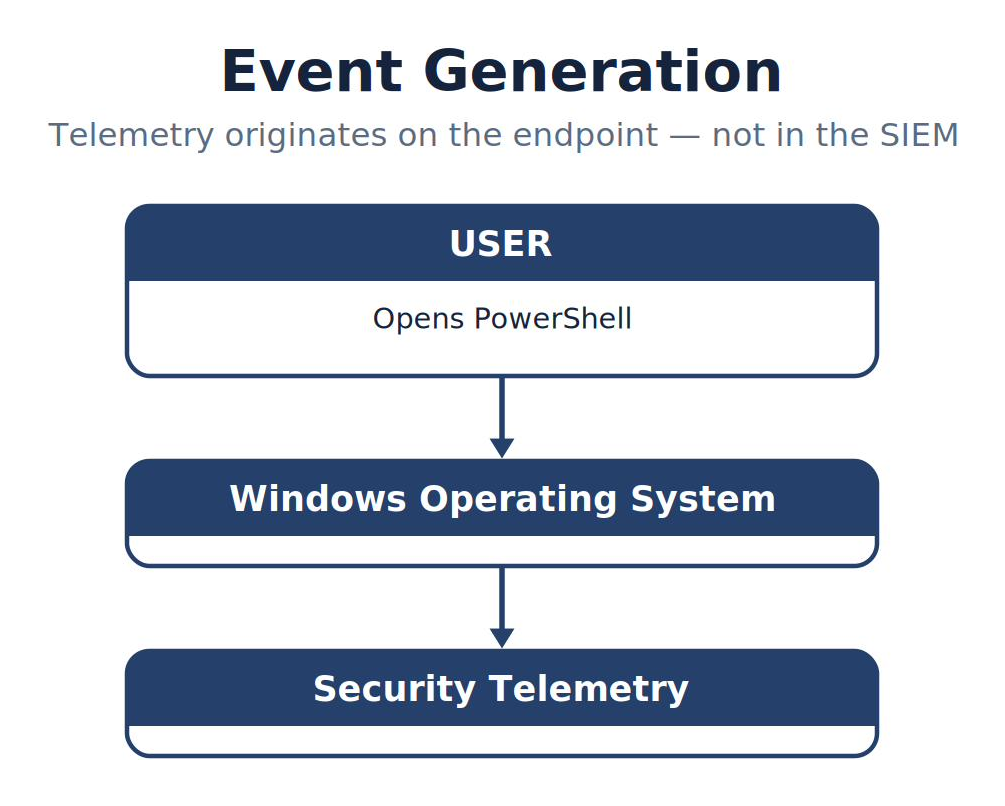
Note. The figure summarizes event Generation and highlights the relationships among its principal elements, evidence sources, and analytical outcomes.
Notice that telemetry originates on the endpoint—not in the SIEM.
Step 1 — Security Sensors Observe Activity
Different security products observe different aspects of system behavior.
For example:
| Technology | Observes |
|---|---|
| Sysmon | Process creation, DNS queries, registry activity |
| Windows Defender | Malware detection and antivirus activity |
| Suricata | Network packets |
| Windows Event Logs | Authentication and operating system events |
| Linux Syslog | Linux operating system events |
| Firewall | Network connections |
Each product specializes in observing a particular type of activity. No single sensor observes everything.
Figure 2-5
Multiple Sensors Observe One System
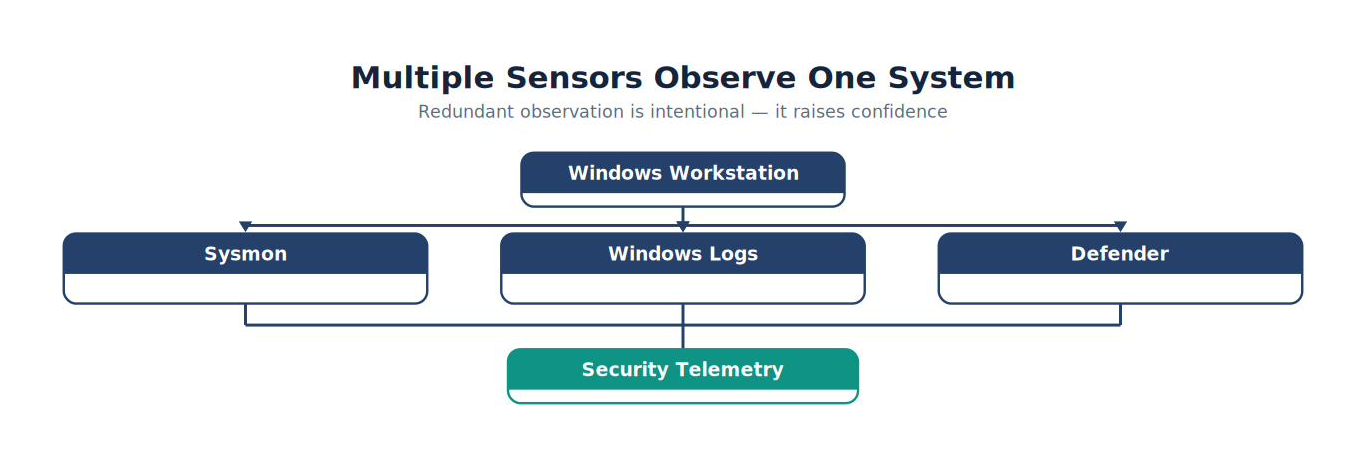
Note. The figure summarizes multiple Sensors Observe One System and highlights the relationships among its principal elements, evidence sources, and analytical outcomes.
This redundancy is intentional. Multiple observations improve confidence during investigations.
Step 2 — The Wazuh Agent Collects Telemetry
The Wazuh Agent acts as the local collector. Rather than sending every file on the computer, it collects only configured security information.
Depending on configuration, the agent may collect:
Windows Event Logs
Sysmon Events —
Microsoft-Windows-Sysmon/OperationalDefender Events
Linux Syslog
Audit Logs
Suricata eve.json
File Integrity Monitoring (FIM)
Vulnerability Information
Think of the agent as a courier. Its responsibility is to deliver security information to the Manager.
Analyst Tradecraft Tip
Know what generates the evidence and what merely transports it.
Sysmon creates the event; the Wazuh Agent collects it.
Step 3 — Secure Transmission
After collecting telemetry, the agent securely forwards information to the Wazuh Manager. Several important things happen during this stage.
The transmission:
Is encrypted.
Preserves event timestamps.
Preserves source identification.
Includes agent metadata.
If network connectivity fails, events may never reach the Manager.
Therefore, one of the first troubleshooting questions should always be:
Is the agent connected?
Figure 2-6
Secure Telemetry Transport
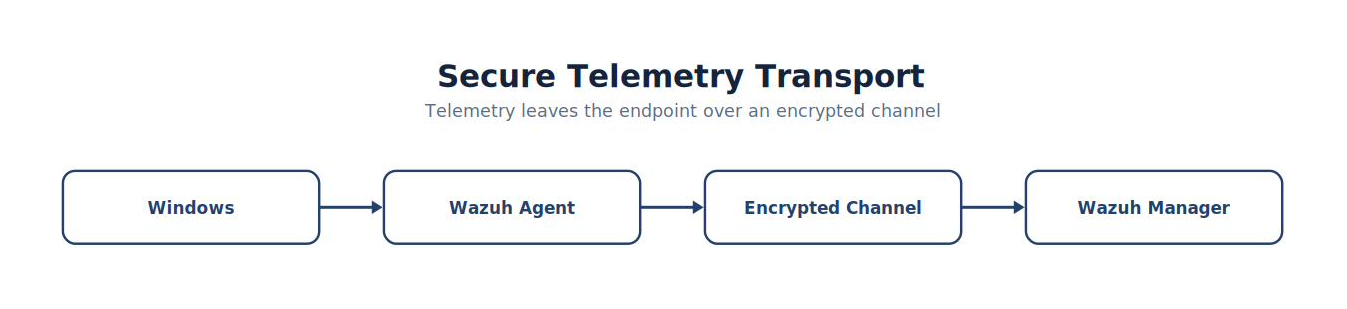
Note. The figure summarizes secure Telemetry Transport and highlights the relationships among its principal elements, evidence sources, and analytical outcomes.
Step 4 — Decoding
The Wazuh Manager now receives raw telemetry. Unfortunately, every security product speaks a different “language.” Consider the following examples.
Windows:
Event ID: 4624
Sysmon:
Event ID: 1
Suricata:
“event_type”:“alert”
Linux:
sshd[4123]:
All four describe completely different formats. Before rules can evaluate them, Wazuh must first understand them. This process is called decoding.
What Is a Decoder?
A decoder identifies:
Log format
Event source
Field names
Important values
For example, a decoder may recognize:
Source IP
Destination IP
Username
Process Name
Event ID
Timestamp
Once decoded, rules can evaluate those fields consistently.
Figure 2-7
Decoding
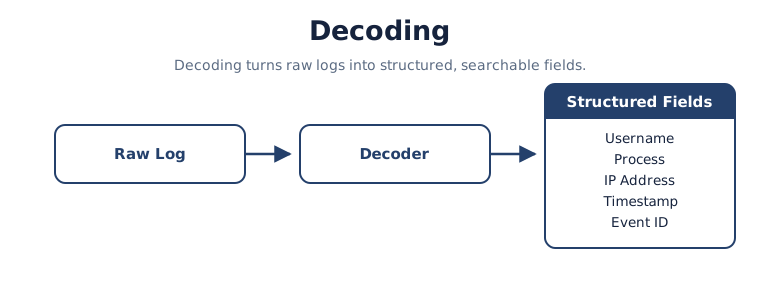
Note. The figure summarizes decoding and highlights the relationships among its principal elements, evidence sources, and analytical outcomes.
Step 5 — Rule Evaluation
Once events have been decoded, they are evaluated against detection rules.
Rules ask questions such as:
Is this Event ID suspicious?
Is this IP address malicious?
Has this user failed authentication multiple times?
Did Word launch PowerShell?
Did Suricata identify malware traffic?
Has Defender detected ransomware?
If the conditions match, an alert is generated. Otherwise, the event is simply stored. This distinction is important. Not every event produces an alert.
Best Practice
A mature SOC stores far more events than alerts. Events provide historical context. Alerts prioritize analyst attention. Deleting events because they did not generate alerts removes valuable investigative evidence. For this reason, professional SOCs retain security telemetry for weeks, months, or even years depending on organizational policy and regulatory requirements (Kent & Souppaya, 2006).
Step 6 — Indexing
After rule evaluation, events and alerts are indexed. Indexing organizes information for rapid searching. Imagine attempting to locate one specific sentence inside every book in a university library. Without an index, the task would be nearly impossible. Indexes make information searchable. The Wazuh Indexer performs the same function. It enables analysts to search millions—or billions—of records in seconds.
Step 7 — Dashboard Presentation
Finally, the Dashboard retrieves indexed information and presents it to the analyst. The Dashboard does not perform detection. It visualizes information already processed by the SIEM.
Analysts can:
Search events
Review alerts
Build dashboards
Investigate timelines
Create reports
Filter data
Correlate activity
The Dashboard is simply the analyst’s window into the SIEM.
Figure 2-8
Complete Wazuh Processing Pipeline
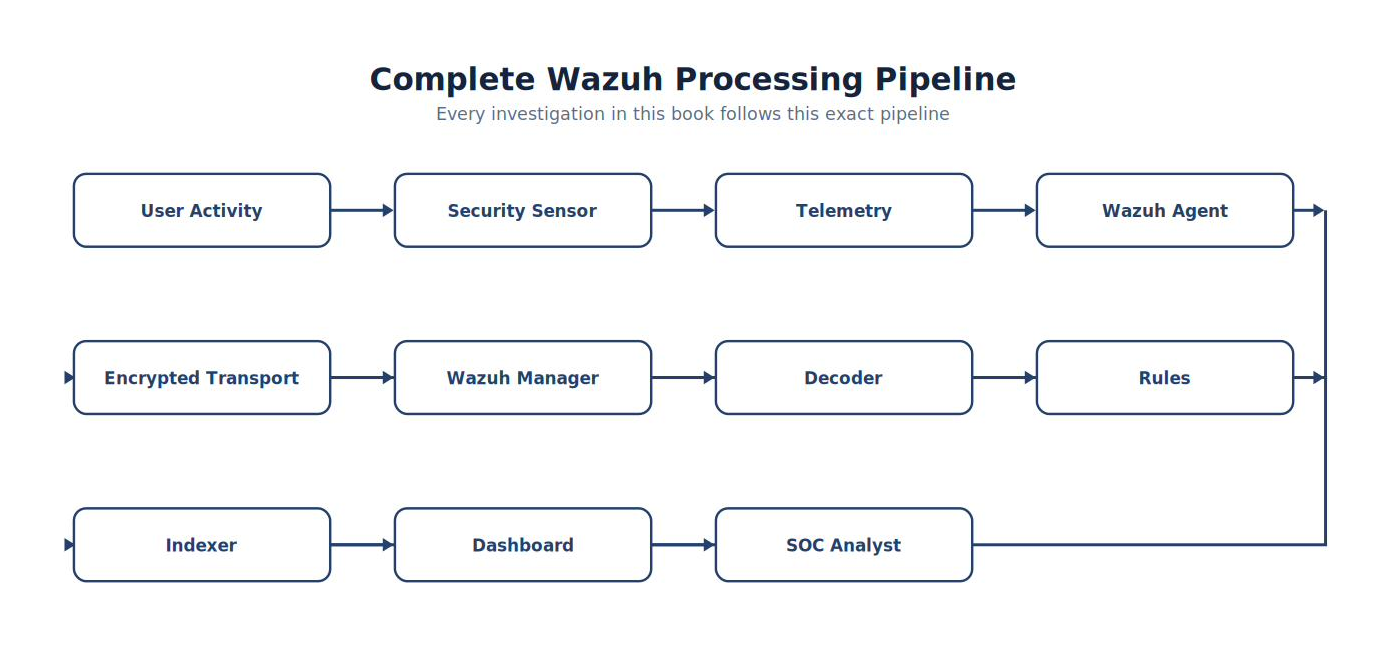
Note. The pipeline shows how information moves through complete Wazuh Processing Pipeline, from its source through processing to the analyst-visible result.
This diagram is one of the most important figures in this textbook. Every investigation you perform during the remainder of this book follows this exact pipeline.
Common Student Mistake
A student performs an Nmap scan. Nothing appears in the Dashboard.
The student immediately concludes:
“Suricata isn’t working.” A professional analyst investigates systematically.
Figure 2-9
Did Nmap Generate Traffic? — Decision Flow
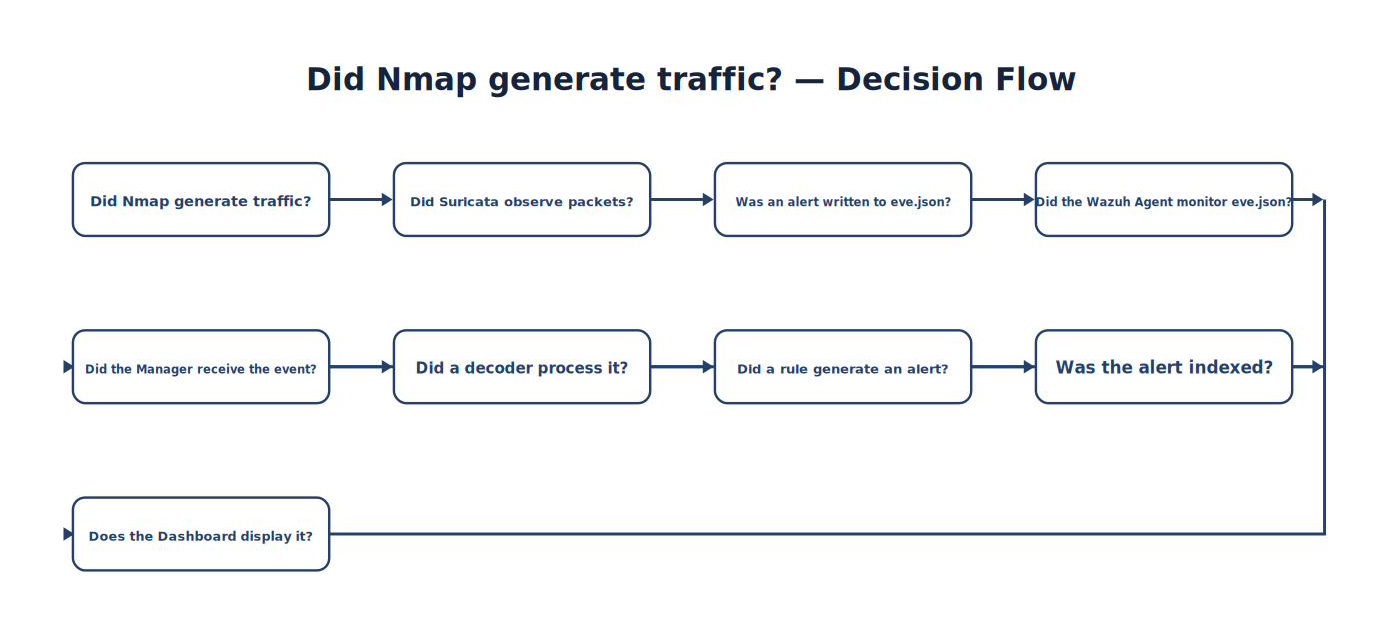
Note. The decision flow organizes the questions and validation checks used to evaluate did Nmap Generate Traffic? and select the appropriate next action.
Only after walking through the entire pipeline should conclusions be drawn. This structured troubleshooting methodology is one of the defining habits of experienced SOC analysts.
Chapter Connection
You now understand how security telemetry moves through a SIEM. In the next section, we build upon this foundation by examining event normalization and data enrichment—the processes that transform thousands of incompatible log formats into a unified dataset that analysts can search, correlate, and investigate efficiently.
2.3 Event Normalization and Data Enrichment
Learning Objectives
After completing this section, you should be able to:
Explain why event normalization is necessary in a modern SIEM.
Describe how different operating systems record the same activity.
Understand how normalization enables correlation.
Explain the concept of data enrichment.
Recognize why standardized data dramatically improves threat investigations.
The Challenge of Different Log Formats
One of the greatest challenges facing a Security Operations Center is that every technology speaks a different language. Consider something as simple as a successful user login. Windows records the event differently than Linux. A firewall records it differently than Active Directory. Cloud providers often use yet another format. Humans can usually recognize that these records describe similar activity. Computers cannot. Before a SIEM can search, correlate, or analyze information, it must first convert these different formats into a common structure. This process is known as event normalization.
A Simple Example
Imagine three systems recording the same user.
Windows
Account Name: jsmith
Linux
user=jsmith
Cloud Identity Provider
username: jsmith@example.edu
Although each record describes the same individual, the field names differ. Without normalization, searching for “all activity generated by jsmith” becomes extremely difficult.
Figure 2-10
Before Normalization
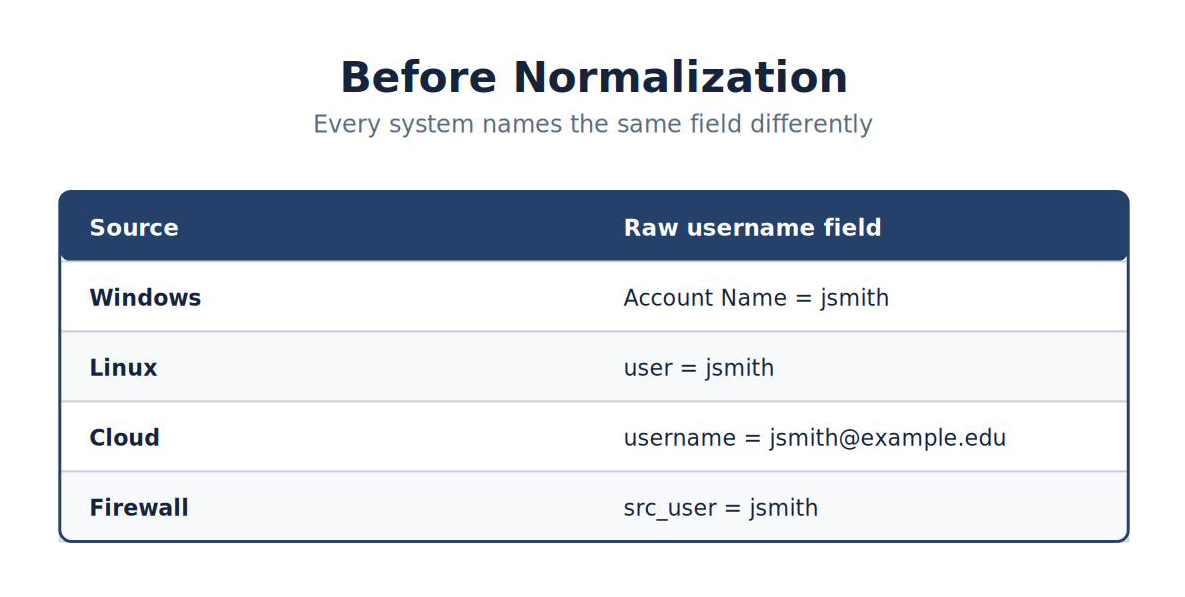
Note. The figure summarizes before Normalization and highlights the relationships among its principal elements, evidence sources, and analytical outcomes.
| Source | Raw username field |
|---|---|
| Windows | Account Name = jsmith |
| Linux | user = jsmith |
| Cloud | username = jsmith@example.edu |
| Firewall | src_user = jsmith |
Every system uses different terminology.
After Normalization
The SIEM transforms these records into a common structure.
User = jsmith
Now every security product refers to the user using the same field. Searching becomes dramatically easier.
Figure 2-11
After Normalization
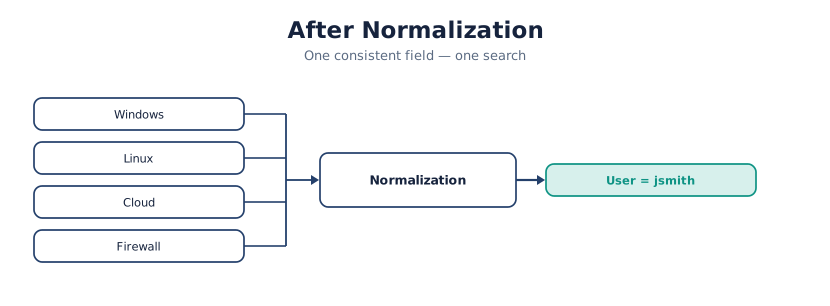
Note. The figure summarizes after Normalization and highlights the relationships among its principal elements, evidence sources, and analytical outcomes.
Instead of learning dozens of vendor-specific formats, analysts search one consistent dataset.
Why This Matters
Imagine you receive an alert involving the user jsmith.
Without normalization, you might need to search:
Account Name
User
Username
src_user
destinationUser
account
logonUser
principalName
With normalization, one search retrieves activity from every supported source. This saves enormous amounts of investigative time.
Analyst Tradecraft Tip
Normalize the data so analysts can investigate the activity.
Consistency turns many log formats into one investigative language.
Understanding Data Enrichment
Normalization organizes data. Enrichment adds context. Raw security events often contain only minimal information. Consider the following firewall log.
Source IP: 10.10.25.44
Destination IP: 172.16.10.18 Destination Port: 443
Technically correct. Operationally limited. Now consider the enriched version.
Source:
Faculty-Laptop-07
User: Professor Smith
Department: Computer Science
Destination: Finance Database
Application: Microsoft SQL Server
Location: Main Campus
The second record is much easier to understand. Enrichment transforms technical information into operational intelligence.
Common Sources of Enrichment
Modern SIEM platforms enrich security data using information from many sources.
Examples include:
| Source | Added Context |
|---|---|
| Asset Inventory | Computer name, owner, department |
| Active Directory | User information, group membership |
| Threat Intelligence | Known malicious IP addresses |
| Vulnerability Scanner | System vulnerabilities |
| DNS | Hostname resolution |
| Geolocation | Geographic location of IP addresses |
| CMDB | Business owner, criticality |
The more context analysts have, the faster investigations become.
Real-World Example
Suppose Suricata detects communication with:
185.243.115.84
Without enrichment, the analyst knows only the IP address.
After enrichment, the SIEM identifies:
Known ransomware infrastructure
Country of origin
First observed date
Threat intelligence confidence
Associated malware family
Historical connections within the organization
Instead of beginning with an unknown IP address, the analyst begins with actionable intelligence.
Figure 2-12
Data Enrichment
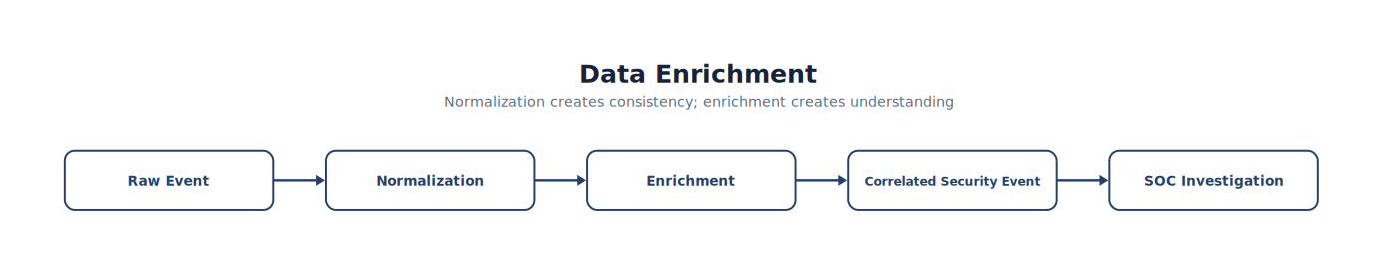
Note. The figure summarizes data Enrichment and highlights the relationships among its principal elements, evidence sources, and analytical outcomes.
Why Correlation Depends on Normalization
Imagine two alerts.
Sysmon
Process:
powershell.exe
Suricata
Source IP:
192.168.10.44
Individually, they reveal very little.
Now suppose normalization identifies:
The workstation
The user
The timestamp
Correlation now determines:
PowerShell executed.
The workstation immediately contacted a malicious server.
Defender quarantined a downloaded executable.
None of these systems knew about one another. The SIEM connected them. This ability to combine unrelated observations is what makes SIEM technology so powerful.
Best Practice
Never investigate isolated events if correlated information is available.
Ask questions such as:
What happened immediately before this event?
What happened immediately afterward?
Did another sensor observe related activity?
Is this endpoint vulnerable?
Has this user generated similar alerts previously?
Have other endpoints exhibited the same behavior?
The answers often determine whether an alert represents a routine administrative task or a genuine compromise.
Common Student Mistake
Students often search only for the alert they received.
Experienced analysts search for:
The user
The hostname
The IP address
The Process GUID
The Process ID
The surrounding timeline
They investigate the environment surrounding the alert rather than the alert itself. This approach frequently uncovers additional malicious activity that would otherwise remain hidden.
Analyst Tradecraft Tip
Investigate relationships, not isolated log entries.
The alert is the starting point—not the boundary.
Chapter Connection
You now understand how a SIEM transforms thousands of different log formats into a unified dataset through normalization and enrichment (Kent & Souppaya, 2006). In the next section, we examine correlation in detail—one of the defining capabilities of every modern SIEM. You will learn how Wazuh identifies relationships among seemingly unrelated events and why correlation allows analysts to detect attacks that would be nearly impossible to recognize by examining individual log entries alone.
2.4 Correlation — Turning Data into Intelligence
Learning Objectives
After completing this section, you should be able to:
Define security correlation.
Explain why correlation is one of the defining features of a SIEM.
Describe how unrelated events become meaningful when analyzed together.
Recognize the limitations of investigating isolated events.
Understand how Wazuh correlates security telemetry from multiple sources.
Seeing the Bigger Picture
Imagine someone hands you a single page torn from a novel.
Could you accurately describe the entire story?
Probably not. Now imagine you have the entire book. The characters, plot, relationships, and ending suddenly make sense. Security investigations work the same way. A single log entry rarely tells the complete story. A single alert almost never explains an attack. Professional analysts build investigations by combining many pieces of evidence into a coherent timeline. This process is called correlation.
What Is Correlation?
Correlation is the process of identifying meaningful relationships between multiple security events. Rather than analyzing individual events independently, a SIEM searches for patterns that indicate suspicious behavior.
Correlation asks questions such as:
Did these events occur on the same computer?
Did they involve the same user?
Did they happen within a short time period?
Are they related to the same process?
Were they generated by different security products observing the same activity?
When the answer is yes, the events may describe a single attack.
Individual Events
Consider these observations.
Event 1
Sysmon
PowerShell Started
Event 2
Suricata
Outbound HTTPS Connection
Event 3
Windows Defender
Malware Quarantined
Each event appears relatively ordinary. Individually, none proves malicious activity.
Correlated View
Now place the events in chronological order.
| Time | Source | Event |
|---|---|---|
| 10:14:22 | Sysmon | WINWORD.EXE launches PowerShell |
| 10:14:27 | Sysmon | PowerShell downloads a file |
| 10:14:29 | Suricata | Suspicious HTTPS communication |
| 10:14:33 | Defender | Trojan detected and quarantined |
| 10:14:35 | Wazuh | Correlated alert generated |
Suddenly, the investigation tells a very different story. Rather than isolated observations, the analyst sees an attack sequence.
Figure 2-13
Correlation Timeline
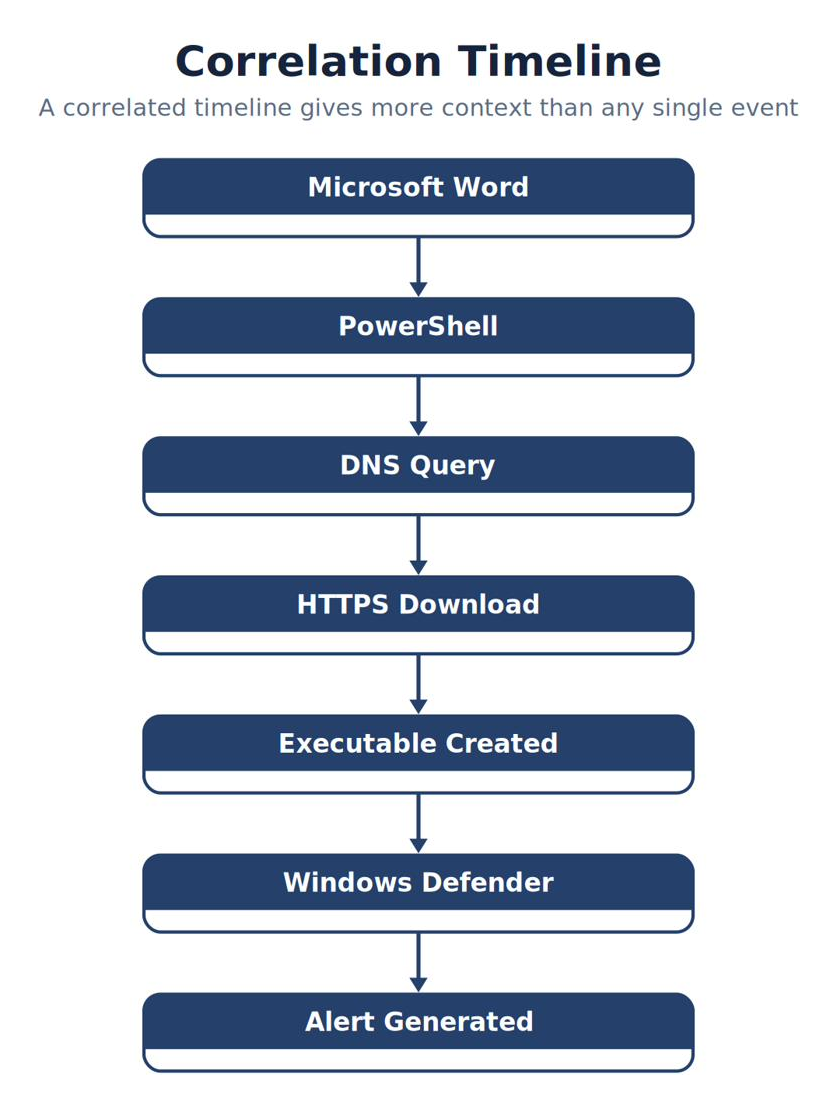
Note. The timeline places the events associated with correlation Timeline in chronological order to support reconstruction, correlation, and defensible conclusions.
This timeline provides significantly more context than any single event (Kent & Souppaya, 2006).
Correlation Answers Questions
Security analysts rarely ask:
“Did this event occur?”
Instead, they ask:
What happened before it?
What happened afterward?
What else happened on this endpoint?
Did another sensor observe related activity?
Is this behavior normal?
Has this happened before?
Correlation helps answer each of these questions.
Example 1 — PowerShell
Suppose Wazuh receives the following event.
PowerShell Started
Should the analyst investigate?
Perhaps. Perhaps not. PowerShell is a legitimate administrative tool. System administrators use it every day. By itself, PowerShell execution is rarely suspicious. Now consider additional telemetry.
| Time | Event |
|---|---|
| 08:15 | WINWORD.EXE launches PowerShell |
| 08:15 | PowerShell downloads script |
| 08:16 | Scheduled Task Created |
| 08:16 | Defender detects malware |
The context changes everything.
The analyst now sees:
An unusual parent process.
Network activity.
Persistence.
Malware detection.
Correlation transforms uncertainty into confidence.
Example 2 — Failed Logins
Imagine a Windows server records one failed login.
Should the SOC respond?
Probably not. Users mistype passwords every day. Now consider this sequence.
| Time | Event |
|---|---|
| 02:14 | Failed Login |
| 02:14 | Failed Login |
| 02:15 | Failed Login |
| 02:15 | Failed Login |
| 02:15 | Failed Login |
| 02:16 | Successful Login |
The pattern suggests something entirely different.
Perhaps:
Password spraying
Brute-force attack
Credential stuffing
Compromised credentials
Correlation identifies the pattern.
Analyst Tradecraft Tip
Do not chase alerts. Reconstruct the story.
Investigate the environment surrounding the alert.
Time-Based Correlation
Many attacks occur quickly. Events that happen within seconds of one another are often related.
For example:
09:44:10
User Opens Email → 09:44:13
Word Opens Document → 09:44:16
PowerShell Starts → 09:44:18
DNS Request → 09:44:20
HTTPS Connection → 09:44:23
Malware Download → 09:44:27
Defender Detection
Looking at any one event independently may not reveal an attack. Viewing the timeline makes the sequence obvious.
User-Based Correlation
Analysts frequently investigate activity by user.
For example, searching:
User = jsmith may reveal:
VPN login
Windows login
PowerShell execution
USB insertion
File deletion
Network scan
Although these activities originated from different systems, they all involve the same individual.
Host-Based Correlation
Sometimes the endpoint becomes the investigative focus.
Searching for:
WIN11 might reveal:
Defender alerts
Sysmon events
Windows authentication
Suricata network activity
File Integrity Monitoring alerts
This creates a complete picture of one workstation.
Network-Based Correlation
Analysts also investigate by IP address.
For example, searching:
192.168.1.25 may reveal:
DNS queries
HTTP requests
Firewall activity
Suricata alerts
Windows authentication
VPN sessions
One search retrieves information from multiple technologies.
Figure 2-14
Correlation Dimensions
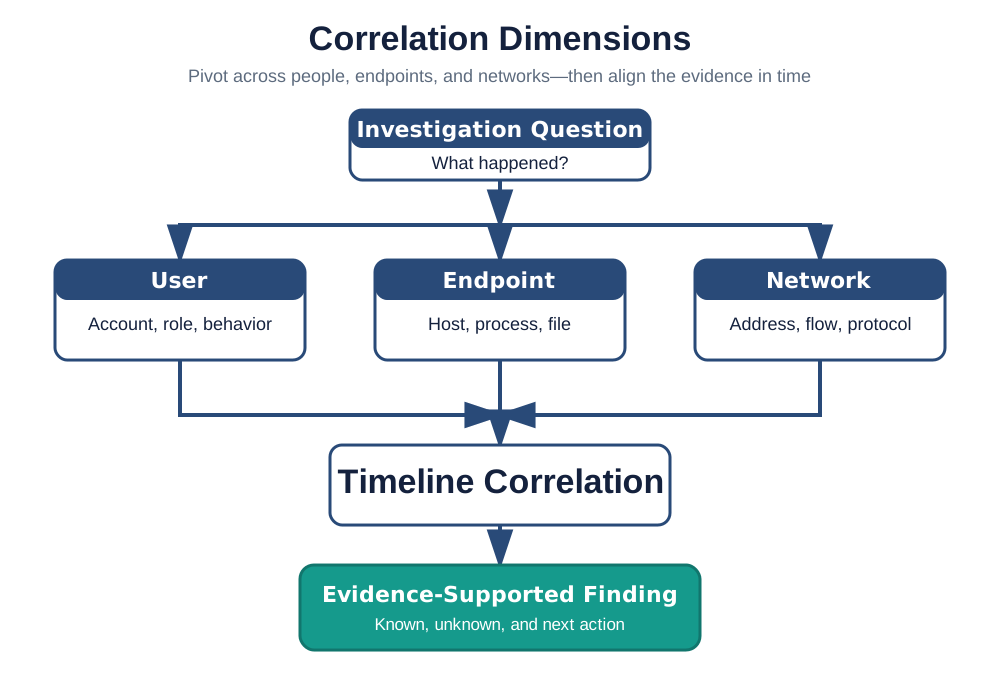
Note. The figure summarizes correlation Dimensions and highlights the relationships among its principal elements, evidence sources, and analytical outcomes.
Professional analysts move fluidly between these dimensions.
Correlation Is Not Magic
Students sometimes assume that correlation automatically solves investigations. It does not. Correlation produces better evidence.
Analysts still must:
Interpret results.
Eliminate false positives.
Validate assumptions.
Understand business context.
Determine whether an incident exists.
Correlation assists analysts. It does not replace them.
Best Practice
During every investigation, attempt to answer these questions:
Who?
What?
When?
Where?
How?
Why?
What happened next?
If you cannot answer one of these questions, additional telemetry may be required.
Common Student Mistake
Students often stop investigating after the first alert.
Professional analysts continue until they understand:
Initial access
Execution
Persistence
Privilege escalation
Lateral movement
Data access
Command and control
Impact
This complete sequence is known as the attack lifecycle. Chapter 1 introduced the MITRE ATT&CK® framework as a shared vocabulary for adversary behavior (MITRE Corporation, n.d.-a). Throughout the investigations in this textbook, correlated event sequences like the one above are mapped to ATT&CK techniques, allowing analysts to describe attacker behavior precisely rather than reasoning about isolated events.
Analyst Tradecraft Tip
Correlate before you count.
Several alerts may describe one incident.
Chapter Connection
Correlation is one of the defining capabilities of every modern SIEM, but it depends on something equally important: high-quality detection rules. In the next section, you’ll learn how detection rules transform normalized, correlated telemetry into meaningful alerts. We’ll examine how Wazuh applies rule logic, prioritizes alerts, assigns severity levels, and helps analysts focus on the activity that matters most.
2.5 Detection Rules — How a SIEM Recognizes Suspicious Activity
Learning Objectives
After completing this section, you should be able to:
Explain what a detection rule is.
Understand how Wazuh evaluates incoming events.
Differentiate between events and alerts.
Explain alert severity levels.
Recognize why detection engineering is a critical SOC function.
Understand the limitations of rule-based detection.
Introduction
Imagine standing outside a large office building watching employees arrive for work. Hundreds of people enter the building every hour. Most are employees. Some are visitors. Some are delivery personnel. If your job were to identify suspicious individuals, you would probably develop a set of observations.
For example:
Is the person entering after business hours?
Are they using another employee’s badge?
Are they attempting to access restricted areas?
Are they carrying unusual equipment?
Have they been seen before?
Cybersecurity detection rules work in a very similar manner. They continuously evaluate incoming telemetry, looking for combinations of characteristics that indicate activity worthy of investigation. Without rules, a SIEM would simply become a large database of log files. Rules transform stored data into operational intelligence.
What Is a Detection Rule?
A detection rule is a predefined set of conditions used to identify activity that may indicate malicious behavior, policy violations, or operational problems (Scarfone & Mell, 2007).
Rules evaluate incoming events and ask questions such as:
Does this event match a known attack pattern?
Did this event originate from a critical system?
Has this user generated similar activity before?
Has this event occurred too many times?
Does this event violate organizational policy?
If the answer satisfies the rule logic, the SIEM generates an alert.
Events Flow Through Rules
Every event received by Wazuh follows a predictable path.
Figure 2-15
Security Event — Decision Flow
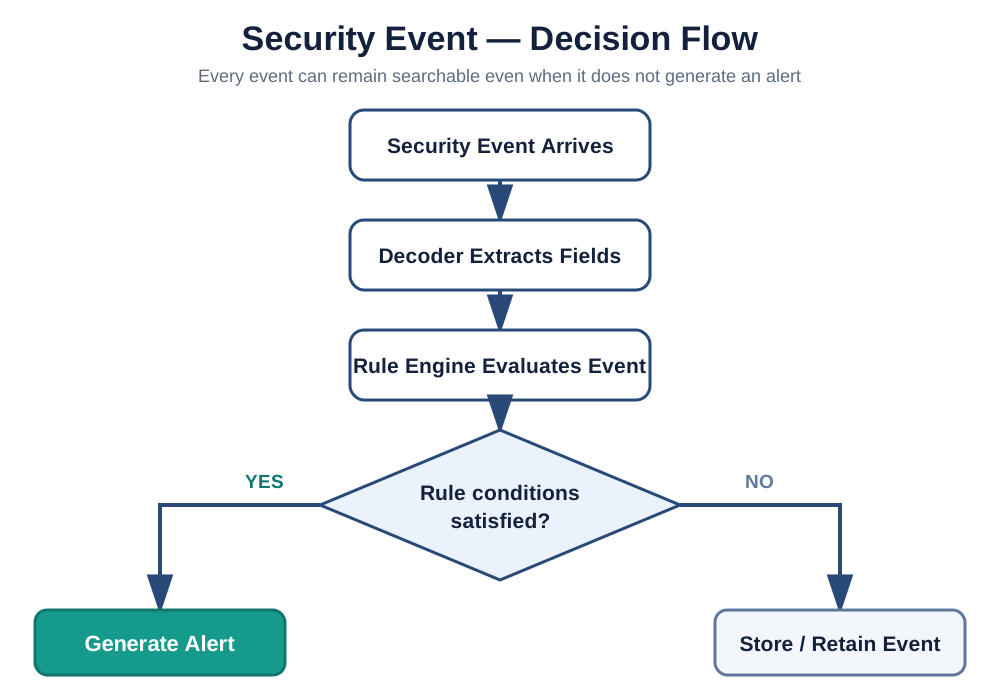
Note. The decision flow organizes the questions and validation checks used to evaluate security Event and select the appropriate next action.
Notice something important. Even if no rule matches, the event may still be valuable. Events that do not generate alerts often become critical evidence during later investigations.
Rules Evaluate Conditions
Consider the following simplified example.
Suppose Sysmon records:
Process Name:
powershell.exe
Should Wazuh generate an alert?
Probably not. PowerShell is used legitimately throughout many organizations. Now add another condition.
Parent Process:
WINWORD.EXE
Now the situation becomes more interesting. Microsoft Word rarely launches PowerShell during normal business operations. A detection rule might therefore generate an alert.
Figure 2-16
Rule Logic
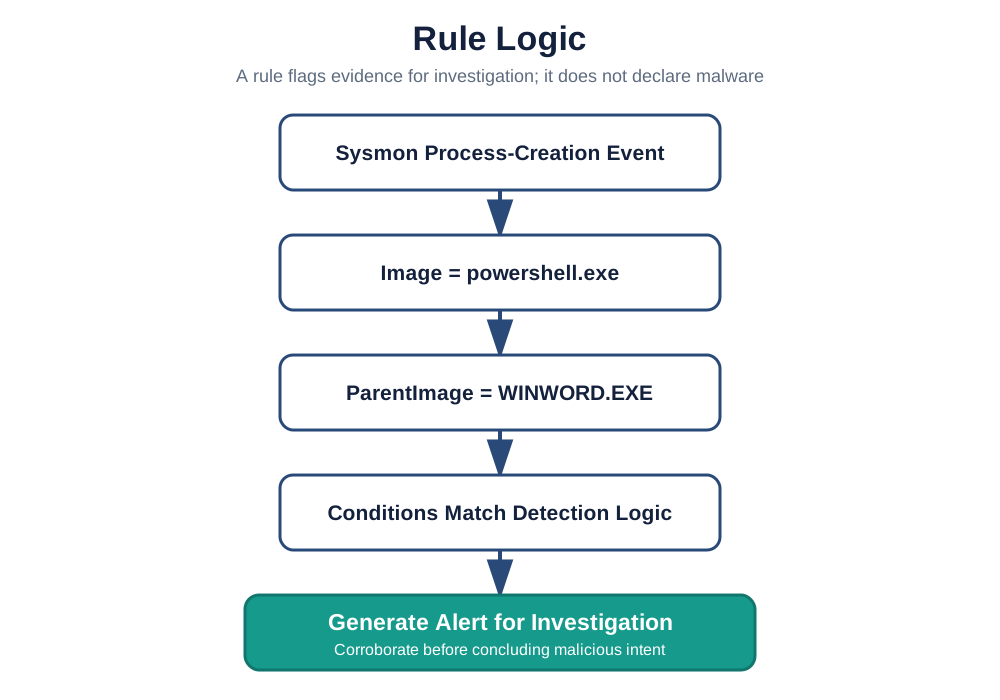
Note. The figure breaks rule Logic into its functional parts and shows how those parts combine to produce the intended detection behavior.
Notice that the rule did not conclude malware exists. It concluded the activity deserves investigation.
Simple Rules vs. Complex Rules
Not all rules are equally sophisticated. Some evaluate a single condition. Others evaluate dozens.
Simple Rule
The following local rule inherits from the vendor rule that identifies a failed Windows logon. In the pinned course ruleset, rule 60122 represents the decoded logon-failure event. Validate parent IDs with wazuh-logtest before deploying a rule against another Wazuh version.
WAZUH-SRV · XML · /var/ossec/etc/rules/local_rules.xml
<group name="windows,authentication_failed,">
  <rule id="100201" level="5">
    <if_sid>60122</if_sid>
    <description>Windows logon failure requires review</description>
  </rule>
</group>
This is valid Wazuh rule syntax: <if_sid> links the local child rule to the vendor parent, id uniquely identifies the local rule, and level controls alert severity. Test the sample event with /var/ossec/bin/wazuh-logtest before restarting the Manager.
More Advanced Rule
The next rule correlates five matches of the local failed-logon rule within 120 seconds and requires the decoded source IP and user to remain the same.
WAZUH-SRV · XML · /var/ossec/etc/rules/local_rules.xml
<group name="windows,authentication_failed,">
  <rule id="100202" level="10" frequency="5" timeframe="120">
    <if_matched_sid>100201</if_matched_sid>
    <same_srcip />
    <same_user />
    <description>Repeated Windows logon failures from one source against one account</description>
  </rule>
</group>
This rule reduces noise by identifying a suspicious pattern instead of escalating every failure independently. The correlation fields work only when the decoder populates the source IP and user; confirm the extracted fields in Phase 2 of wazuh-logtest.
Local rules belong under /var/ossec/etc/rules/. Vendor-supplied rules live under /var/ossec/ruleset/rules/; use them for reference, but do not edit them because upgrades replace that directory.
Rule Chaining
Modern SIEM platforms often evaluate multiple related rules together. Consider the following sequence.
Rule 1
PowerShell Started → Rule 2
PowerShell Downloaded File → Rule 3
Executable Created → Rule 4
Windows Defender Detection → High Confidence Alert
Each individual event may appear only moderately suspicious. Together, they strongly indicate malicious activity. This technique is called rule chaining.
Alert Severity
Not every alert is equally important. Organizations assign severity levels to help analysts prioritize investigations. Although exact scales vary between organizations, a typical classification is shown below.
| Severity | Meaning | Example |
|---|---|---|
| Informational | Routine activity | Service Started |
| Low | Minor concern | Single Failed Login |
| Medium | Suspicious behavior | Port Scan |
| High | Likely compromise | Malware Download |
| Critical | Active incident | Ransomware Detected |
Severity helps analysts determine which alerts deserve immediate attention.
Wazuh Alert Levels
The generic severity scale above is useful for reasoning about priority, but Wazuh itself assigns every rule a numeric level from 0 to 15. This is the number you will see in the rule.level field on every alert throughout Lab 0 and Labs 1–4, so it is worth understanding now (Wazuh, Inc., n.d.-a).
| Wazuh Level | Classification | Generic Severity |
|---|---|---|
| 0 | Ignored — no alert generated (used to suppress false positives) | — |
| 2 | System low priority notification | Informational |
| 3 | Successful/authorized events | Informational |
| 5 | User-generated error (e.g., a single failed login) | Low |
| 6–9 | Low-relevance attack or policy violation | Low–Medium |
| 10 | Multiple user-generated errors (e.g., repeated failed logins) | Medium |
| 11–12 | High-importance event | Medium–High |
| 13–14 | Unusual/high-importance error | High |
| 15 | Severe attack — no chance of false positive | Critical |
Two practical points for lab work. First, level 0 means the rule matched but was intentionally silenced; it is how analysts suppress known-benign noise without losing the underlying event (Wazuh, Inc., n.d.-a). Second, several low levels (0, 2, and 4) do not appear in the Security Events view by default, so a “missing” alert is sometimes simply a low-level event filtered from the dashboard rather than a broken pipeline. You will filter alerts by level directly in Lab 1 using a query such as rule.level:>=7.
Analyst Tradecraft Tip
Severity is not priority.
Technical severity must be weighed against business impact and asset criticality before determining investigation priority.
Rule Tuning
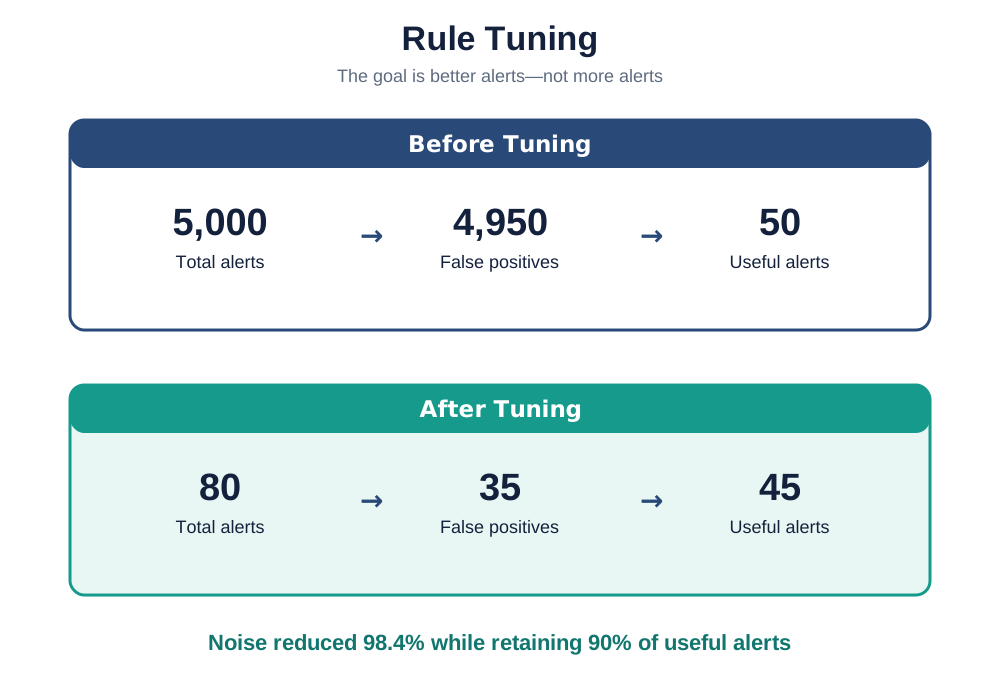
One of the ongoing responsibilities of a SOC is rule tuning. As environments change, detection rules must evolve. Suppose a rule generates 5,000 alerts every day.
After investigation, analysts discover that:
4,950 alerts are expected activity.
50 require investigation.
The SOC modifies the rule.
After tuning:
80 alerts are generated.
45 require investigation.
Nothing malicious was lost. Analyst workload decreased dramatically. This process is called reducing false positives.
Figure 2-17
Rule Tuning
Note. The figure summarizes rule Tuning and highlights the relationships among its principal elements, evidence sources, and analytical outcomes.
The goal is not to create more alerts. The goal is to create better alerts.
Detection Engineering
Someone must create, maintain, and improve detection rules. This discipline is called Detection Engineering.
Detection engineers:
Research new attack techniques.
Study threat intelligence.
Develop custom detection logic.
Test rules.
Tune alert quality.
Reduce analyst workload.
Improve visibility.
Detection engineering is one of the fastest-growing specialties within modern Security Operations Centers.
Wazuh Rules
Throughout this textbook, you will work extensively with Wazuh rules.
You will learn to:
Read existing rules.
Understand rule hierarchy.
Override vendor rules.
Create local custom rules.
Test rule behavior.
Validate alert generation.
Troubleshoot rule failures.
By the end of the book, you will be capable of developing detection rules tailored to your own environment.
Common Student Mistake
A student modifies several rules simultaneously. After restarting Wazuh, expected alerts disappear.
Which modification caused the problem?
No one knows. Professional analysts follow a disciplined process.
Modify one rule.
Restart the service.
Generate test telemetry.
Verify expected behavior.
Document the result.
Repeat.
This methodology simplifies troubleshooting and reduces configuration errors.
You receive the following alert.
PowerShell Execution Detected
Ask yourself:
Which rule generated the alert?
Why did the rule match?
What telemetry satisfied the rule conditions?
Was the activity expected?
Has the rule produced false positives previously?
Should the rule be modified?
Professional analysts investigate both the alert and the rule that generated it. Understanding why an alert exists is often just as important as investigating the activity itself.
Best Practice
Treat detection rules as living components of the SOC. Review them regularly. Remove obsolete rules. Tune noisy rules. Add detections for emerging threats. Validate every rule after modification. An organization’s detection capability improves continuously—not because software automatically becomes smarter, but because analysts continuously improve the quality of their detection logic.
Chapter Connection
You now understand how events become alerts through the application of detection rules. In the next section, we will examine searching and investigating data within a SIEM. Rather than focusing on how alerts are generated, you will learn how SOC analysts use dashboards, searches, filters, timelines, and saved queries to transform alerts into evidence-based investigations. This section will serve as the bridge between understanding SIEM technology and using it effectively during real-world incident investigations.
2.6 Searching, Investigating, and Thinking Like a SOC Analyst
Learning Objectives
After completing this section, you should be able to:
Explain why searching is one of the most important SIEM skills.
Develop an investigation strategy instead of relying solely on alerts.
Differentiate between searching and filtering.
Understand timeline-based investigations.
Recognize common investigation mistakes.
Build a repeatable investigative workflow.
Introduction
One of the biggest misconceptions about Security Operations Centers is that analysts spend their day watching dashboards waiting for alerts to appear. In reality, professional analysts spend much more time searching than they do watching dashboards.
The dashboard answers one question:
“What has already been detected?”
Searching answers a much more powerful question:
“What else is happening?” This distinction separates reactive analysts from proactive investigators.
Searching Is Investigation
Suppose Wazuh generates the following alert.
Suspicious PowerShell Execution
Many beginning analysts stop here. They read the alert. Maybe they acknowledge it. Then they move to the next alert. Professional analysts do something completely different. They begin asking questions.
Which computer?
Which user?
Which process?
Which parent process?
Which network connections?
Which DNS requests?
Which files were created?
Which registry keys changed?
What happened immediately afterward?
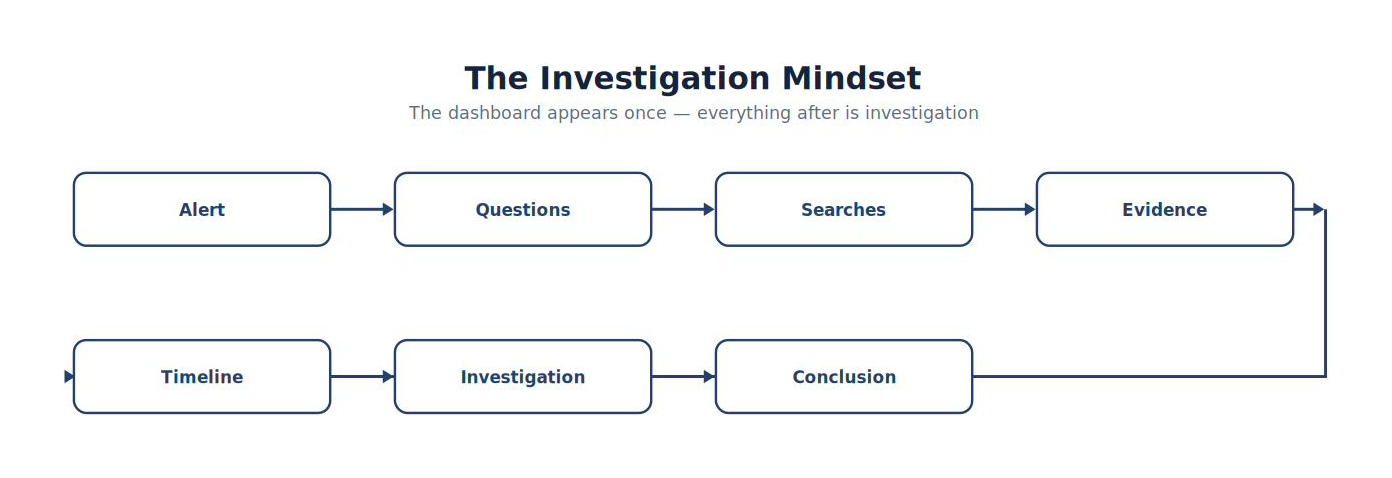
The alert becomes the beginning of the investigation—not the end.
Figure 2-18
The Investigation Mindset
Note. The figure summarizes the Investigation Mindset and highlights the relationships among its principal elements, evidence sources, and analytical outcomes.
Notice that the dashboard appears only once. Everything afterward involves investigation.
Start Broad, Then Narrow
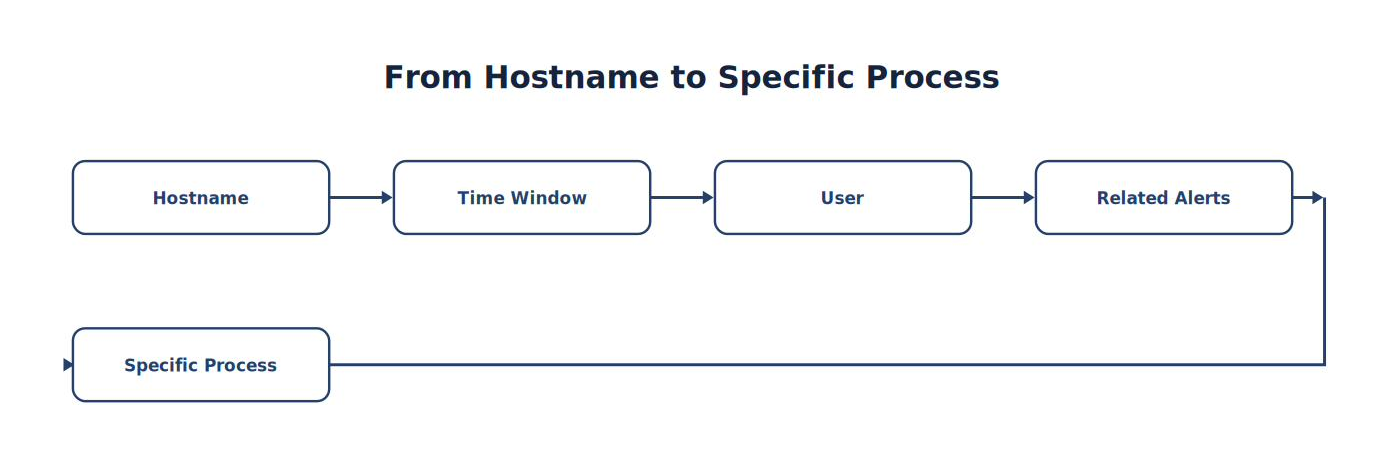
One of the best habits a SOC analyst can develop is beginning with a broad search before narrowing the investigation.
For example, instead of immediately searching for:
powershell.exe begin with:
Figure 2-19
From Hostname to Specific Process
Note. The sequence traces how Hostname progresses to Specific Process, emphasizing the intermediate evidence and processing steps.
This approach reduces the chance of overlooking important evidence.
Example Investigation
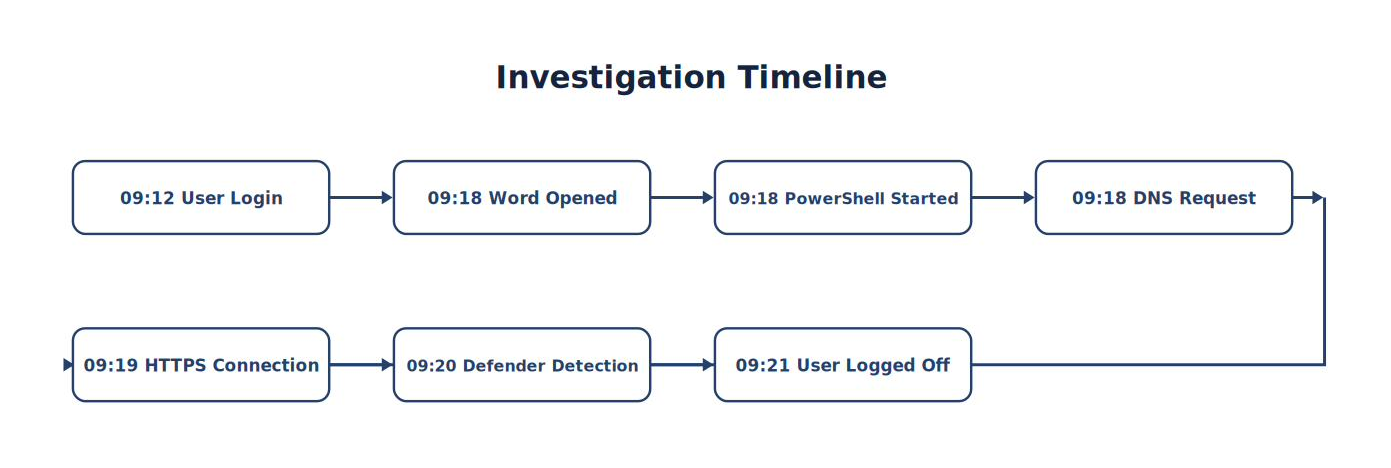
Suppose Wazuh reports:
PowerShell Detected
Instead of immediately examining PowerShell, search for the workstation.
Example timeline:
Figure 2-20
Investigation Timeline — Authentication Events
Note. The timeline places the events associated with investigation Timeline — Authentication Events in chronological order to support reconstruction, correlation, and defensible conclusions.
Notice how much information becomes available simply by expanding the investigation.
Investigating by Host
One of the most common investigative techniques is searching by hostname.
Questions include:
What happened on this computer today?
Which alerts originated here?
Which users logged in?
Were administrative tools executed?
Were suspicious files created?
Did Defender detect malware?
Searching by host often reveals activity unrelated to the original alert.
Investigating by User
Sometimes the person becomes the investigation. Instead of searching for the computer, search for the user.
Questions include:
Which computers did this user access?
Were multiple logins successful?
Did the user execute PowerShell?
Did they access privileged resources?
Were USB devices connected?
Were unusual applications executed?
User-based investigations are particularly valuable during insider threat investigations.
Investigating by Time
Time is one of the most important investigative dimensions. Many attacks unfold within minutes.
For example:
Figure 2-21
Investigation Timeline — Ordering Events by Time
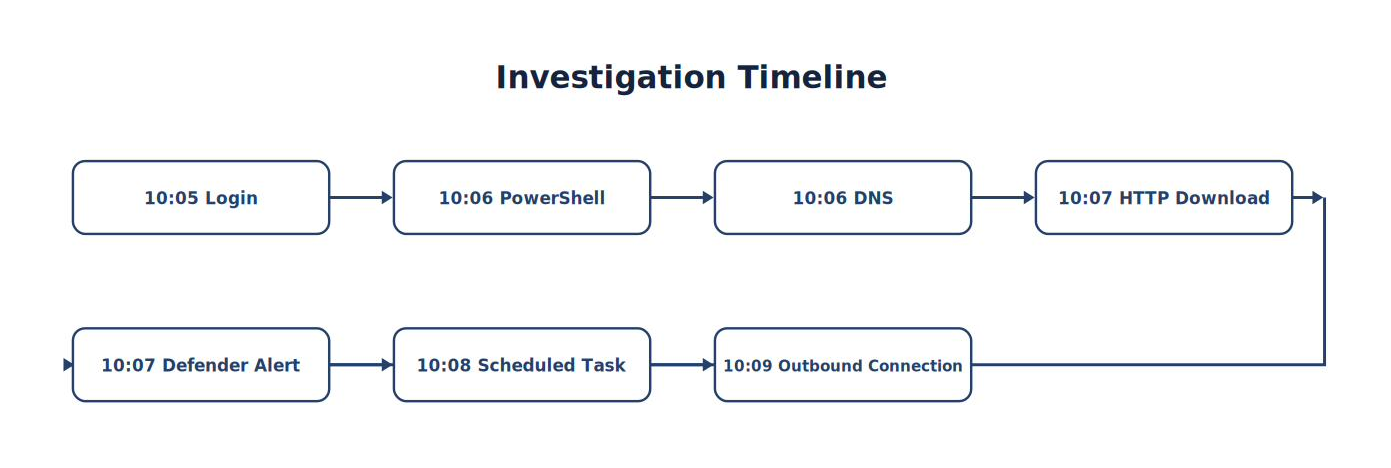
Note. The timeline places the events associated with investigation Timeline — Ordering Events by Time in chronological order to support reconstruction, correlation, and defensible conclusions.
Searching within an appropriate time window frequently uncovers additional evidence. Professional analysts rarely investigate a single event in isolation.
Analyst Tradecraft Tip
Expand the time window.
Attackers rarely perform only one action.
What the Wider Window Reveals
Looking beyond the initial alert often reveals:
Initial access
Discovery
Lateral movement
Persistence
Data collection
Cleanup
Context almost always improves investigations.
Timeline Analysis
Every investigation is ultimately an exercise in reconstructing a timeline. Imagine investigators examining a bank robbery.
They would ask:
When did the suspect arrive?
Which entrance did they use?
Which cameras observed them?
Which employees interacted with them?
When did they leave?
SOC analysts perform exactly the same type of reconstruction. The only difference is that the evidence comes from security telemetry rather than surveillance cameras.
Figure 2-22
Timeline Investigation
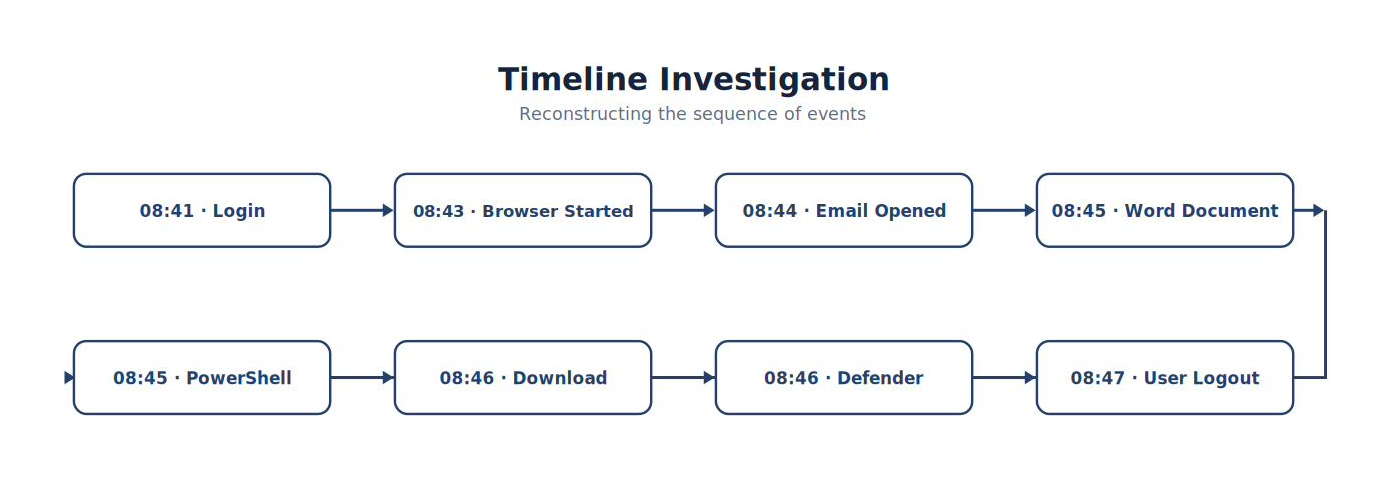
Note. The timeline places the events associated with timeline Investigation in chronological order to support reconstruction, correlation, and defensible conclusions.
Searching Across Multiple Data Sources
A powerful SIEM allows analysts to investigate many technologies simultaneously.
For example, a search for one workstation may retrieve information from:
Windows Event Logs
Sysmon
Defender
Suricata
Linux authentication logs
File Integrity Monitoring
Vulnerability Detection
Active Response
Firewall logs
This unified visibility dramatically reduces investigation time. Without a SIEM, the analyst would manually examine each system independently.
Dashboards vs. Searches
Beginning analysts often confuse dashboards with investigations. They serve different purposes.
| Dashboard | Search |
|---|---|
| Operational overview | Detailed investigation |
| High-level visibility | Specific evidence |
| Current alerts | Historical analysis |
| Executive summaries | Technical detail |
| Monitoring | Investigation |
Dashboards tell you where to look. Searches tell you what happened.
Common Student Mistake
A student receives an alert for:
Multiple Failed Logins
The student investigates only the failed logins.
Professional analysts also search for:
Successful logins
Password changes
Privilege escalation
VPN activity
Account lockouts
Administrator actions
Related endpoint alerts
The failed login may simply be the beginning of the story.
Best Practice
Every investigation should answer the following questions:
| Question | Purpose |
|---|---|
| Who? | Identify the user or account. |
| What? | Determine the activity performed. |
| When? | Build an accurate timeline. |
| Where? | Identify affected systems. |
| How? | Determine the attack technique or process. |
| Why? | Understand intent or business context. |
| What Next? | Identify required response actions. |
If any of these questions remain unanswered, additional investigation is usually required.
Suppose you receive this alert:
ET SCAN Potential SSH Scan
Do not immediately ask:
“Was someone scanning?”
Instead ask:
Which system performed the scan?
Was it internal or external?
Who owns that system?
Was the activity authorized?
Has this host scanned previously?
Did Sysmon record Nmap execution?
Did the firewall observe additional connections?
Was this part of a scheduled vulnerability assessment?
Notice how the alert simply initiates the investigation. The analyst’s questions determine its quality.
The Analyst’s Investigation Loop
Professional investigations follow a repeatable cycle.
Figure 2-23
Alert — Decision Flow
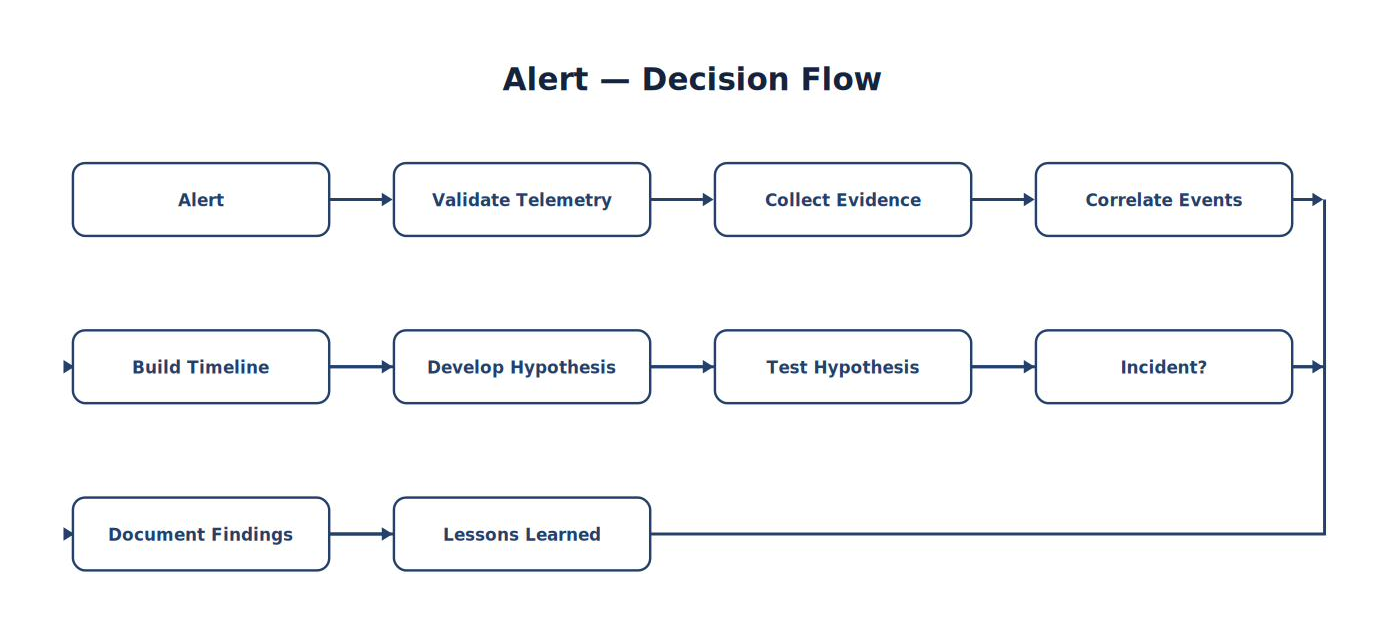
Note. The decision flow organizes the questions and validation checks used to evaluate alert and select the appropriate next action.
This workflow appears repeatedly throughout this textbook because it mirrors the methodology used in mature Security Operations Centers.
Chapter Connection
You now understand how analysts search, investigate, and build evidence-based timelines using a SIEM. In the next section, we examine Wazuh as an enterprise SIEM platform. Rather than discussing SIEM concepts in the abstract, we will map each concept introduced in this chapter directly to the Wazuh architecture you will build throughout the remainder of the book, including the Wazuh Manager, Agents, Indexer, Dashboard, Rules, Decoders, and their interaction with Suricata, Sysmon, Windows Defender, and Ubuntu Linux.
2.7 Wazuh — An Enterprise SIEM Platform
Learning Objectives
After completing this section, you should be able to:
Explain the role of Wazuh within a Security Operations Center.
Identify the major architectural components of Wazuh.
Describe how events travel through the Wazuh platform.
Differentiate the responsibilities of the Manager, Agent, Indexer, and Dashboard.
Understand why Wazuh serves as the operational hub of the laboratory environment used throughout this textbook (Wazuh, Inc., n.d.-a).
Introduction
Throughout this chapter we have discussed Security Information and Event Management (SIEM) as a concept. Beginning with this section, we transition from theory to implementation. The SIEM platform used throughout this textbook is Wazuh.
Wazuh is an enterprise-class, open-source security platform capable of collecting telemetry from thousands of endpoints while providing centralized monitoring, threat detection, vulnerability assessment, file integrity monitoring, security configuration assessment, and incident investigation.
Unlike many commercial SIEM products that require multiple licensed components, Wazuh provides an integrated platform suitable for both educational laboratories and enterprise environments (Wazuh, Inc., n.d.-a). More importantly for this textbook, Wazuh exposes the underlying security concepts rather than hiding them behind proprietary interfaces. Students will learn how a SIEM works—not simply which buttons to click.
Why Wazuh?
When selecting the platform for this textbook, several objectives guided the decision.
The platform needed to:
Support Windows and Linux.
Integrate with Suricata.
Support Sysmon.
Scale from a classroom laboratory to enterprise deployments.
Be actively maintained.
Follow modern security architecture.
Be accessible to students without expensive licensing.
Wazuh satisfies each of these requirements. More importantly, it allows students to build an operational Security Operations Center using the same concepts employed by large organizations.
The Wazuh Architecture
Although Wazuh consists of several software components, the overall architecture is remarkably straightforward. The platform can be viewed as four primary components.
Wazuh Agent
Wazuh Manager
Wazuh Indexer
Wazuh Dashboard
Each performs a specialized role.
Figure 2-24
Wazuh Architecture
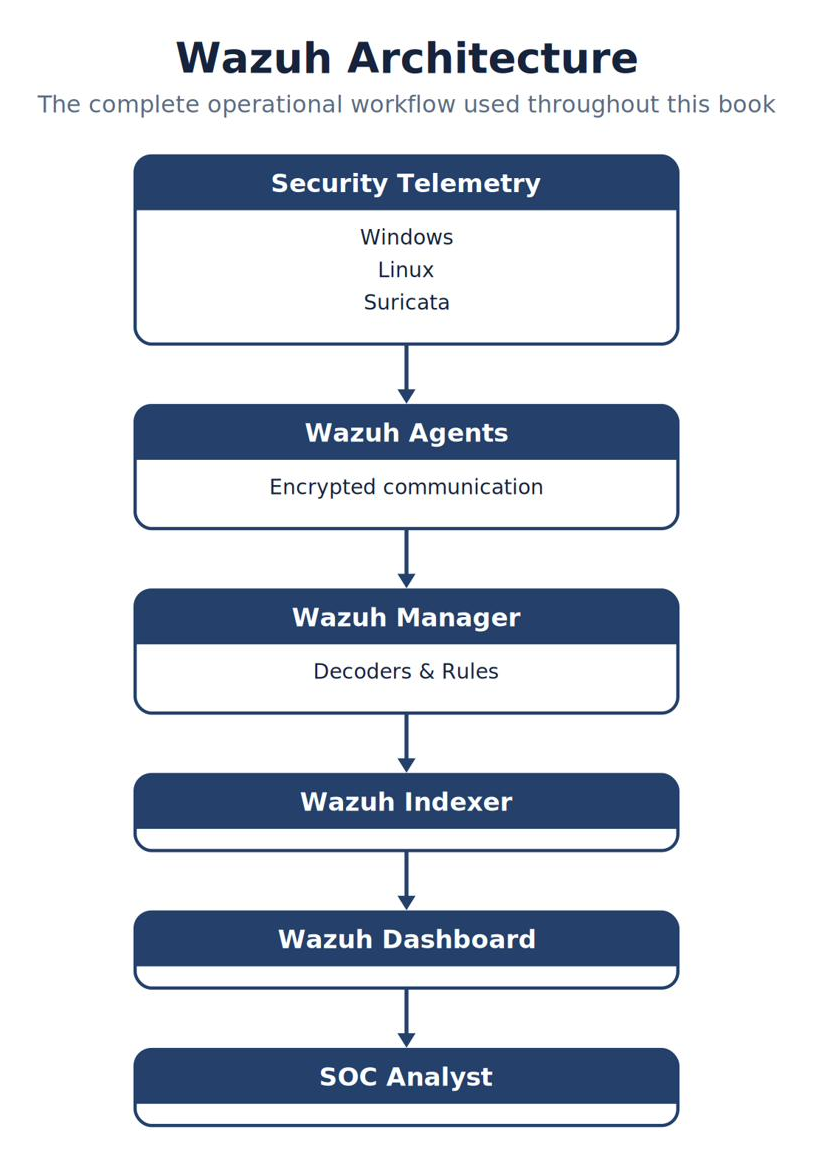
Note. The diagram identifies the primary components of wazuh Architecture and shows how they connect, exchange data, and support security operations.
The Wazuh Agent
The Wazuh Agent resides on monitored systems.
Examples include:
Windows workstations
Linux servers
Ubuntu desktops
Virtual machines
The Agent is responsible for collecting telemetry generated by the operating system and forwarding that information securely to the Wazuh Manager (Wazuh, Inc., n.d.-a). Think of the Agent as a field reporter. It observes activity locally and reports significant information back to headquarters. The Agent does not decide whether activity is malicious. Its responsibility is collection.
Information Collected by the Agent
Depending upon configuration, a Windows Agent may collect:
Windows Event Logs
Sysmon Events
Windows Defender —
Microsoft-Windows-Windows Defender/OperationalFile Integrity Monitoring — changes to monitored paths such as
%WINDIR%\System32Registry Monitoring — changes to keys such as
HKEY_LOCAL_MACHINE\SOFTWARESecurity Configuration Assessment — policy checks and failed-control findings
Vulnerability Information — installed software and versions correlated with known CVEs
A Linux Agent may collect:
Syslog — system events from sources such as
/var/log/syslogAuditd — Linux audit records from
/var/log/audit/audit.logFile Integrity Monitoring — changes to monitored paths such as
/etcAuthentication Logs — sign-in events from sources such as
/var/log/auth.logPackage Inventory — installed package names, versions, and architectures
Process Information — process IDs, names, executable paths, and users
Throughout this textbook you will learn precisely how to configure these capabilities.
The Wazuh Manager
The Manager is the intelligence center of the platform (Wazuh, Inc., n.d.-a). After receiving telemetry from Agents, the Manager performs several important functions.
It:
Validates messages.
Applies decoders.
Executes rules.
Generates alerts.
Performs active response.
Coordinates agent communication.
The Manager does not permanently store information. Its primary responsibility is analysis.
Analyst Tradecraft Tip
Processing is not storage.
The Manager processes; the Indexer stores.
The Wazuh Indexer
The Indexer stores security events. Think of it as a highly optimized database specifically designed for searching enormous amounts of information.
The Indexer enables analysts to:
Search millions of events.
Build dashboards.
Create visualizations.
Generate reports.
Perform historical investigations.
Without indexing, investigations would become painfully slow. Searching weeks of telemetry would require sequentially examining every stored event. Instead, the Indexer organizes information for rapid retrieval.
The Wazuh Dashboard
The Dashboard is the analyst’s workspace.
It allows investigators to:
Search alerts.
Build visualizations.
Review agent status.
Monitor system health.
Investigate incidents.
Create dashboards.
Execute threat hunting queries.
The Dashboard is intentionally separated from the detection engine. It displays information. It does not generate alerts.
Figure 2-25
Responsibilities of Each Component
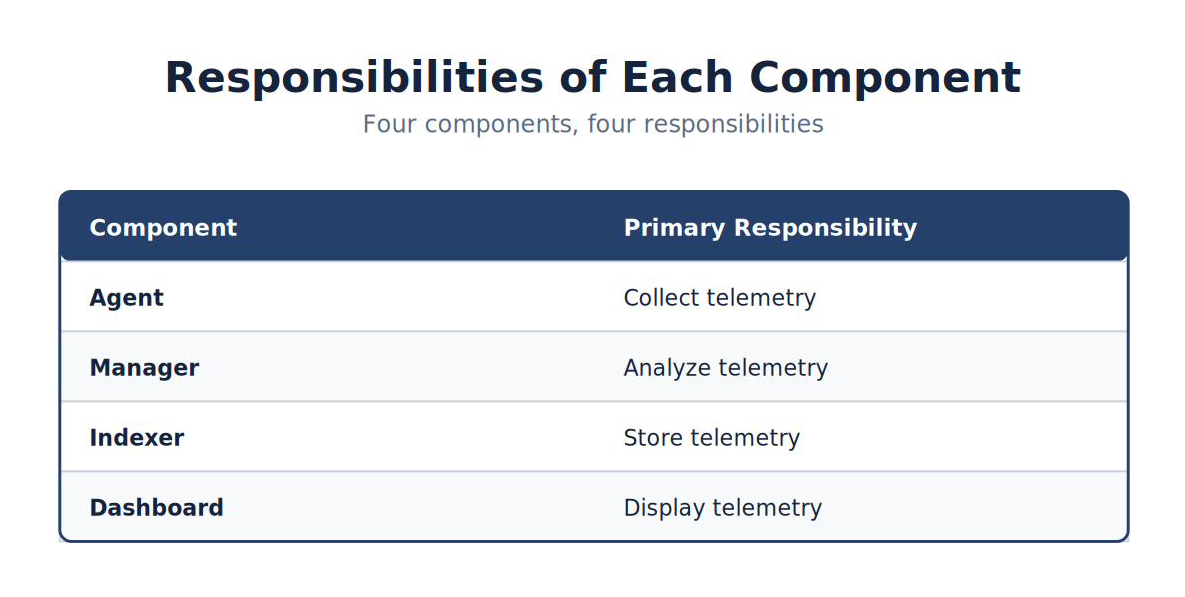
Note. The figure summarizes responsibilities of Each Component and highlights the relationships among its principal elements, evidence sources, and analytical outcomes.
| Component | Primary Responsibility |
|---|---|
| Agent | Collect telemetry |
| Manager | Analyze telemetry |
| Indexer | Store telemetry |
| Dashboard | Display telemetry |
Students who remember this simple table rarely become confused about the role of each component.
Wazuh Does Not Work Alone
One of the greatest strengths of Wazuh is its ability to integrate with other security technologies.
Throughout this textbook, Wazuh will receive telemetry from:
| Technology | Example Telemetry |
|---|---|
| Sysmon | Process creation, DNS queries, network connections |
| Suricata | Network IDS alerts |
| Windows Defender | Malware detections |
| Windows Event Logs | Authentication and operating system activity |
| Linux Syslog | Linux operating system events |
| Auditd | Linux audit events |
| File Integrity Monitoring | File changes |
| Vulnerability Detection | Installed software vulnerabilities |
Notice that Wazuh does not replace these products. Instead, it unifies them.
SIEM, XDR, or Both?
Chapter 1 defined Wazuh as both a SIEM and an Extended Detection and Response (XDR) platform. The distinction is now easy to see. The SIEM role is the centralized collection, normalization, correlation, and investigation you have studied throughout this chapter. The XDR role refers to Wazuh’s ability to act on endpoints directly—monitoring file integrity, assessing configuration and vulnerabilities, and executing automated response—rather than only analyzing telemetry after the fact. The same platform performs both roles, which is why Wazuh is frequently described using both terms.
File Integrity Monitoring (FIM) watches specified files and directories and generates an alert whenever one is created, modified, or deleted. FIM is central to the ransomware detection you will perform in Lab 4 and the capstone in Lab 8, because a sudden spike in file-modification alerts is one of the earliest signals of encryption activity.
Active Response allows Wazuh to execute a predefined action automatically when a rule fires—for example, blocking an IP address, disabling an account, or isolating a host. You will design and observe Active Response scenarios in Labs 3 and 8. Active Response is powerful, so production SOCs apply it deliberately, only after confirming that a trigger cannot be abused to cause a self-inflicted denial of service.
Figure 2-26
Wazuh as the Central Hub
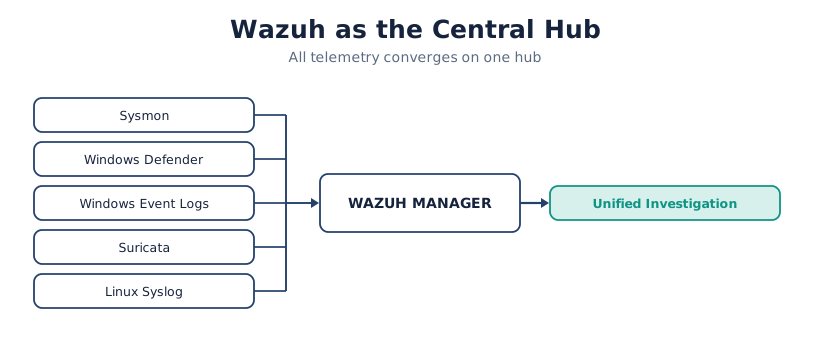
Note. The figure summarizes wazuh as the Central Hub and highlights the relationships among its principal elements, evidence sources, and analytical outcomes.
This centralized architecture dramatically simplifies investigations.
Wazuh in Our Laboratory
Throughout this textbook, our laboratory consists of four major systems.
| System | Hostname | Primary Function |
|---|---|---|
| Wazuh Server (all-in-one: Manager, Indexer, Dashboard) v4.14.5 | WAZUH-SRV | SIEM |
| Ubuntu 26.04 (dual-NIC) | UB2604 | Suricata Network Sensor + Wazuh Agent |
| Windows 11 Pro | WIN11 | Endpoint (Sysmon + Wazuh Agent) |
| Security Onion 14.04.5.2 | SO14 | Comparative Network Analysis |
As investigations become more sophisticated, additional telemetry sources will be added. However, the overall architecture remains unchanged. Every security product ultimately reports to Wazuh.
Best Practice
Students often focus exclusively on alerts. Professional analysts also monitor the health of the monitoring platform itself.
Every day they verify:
Manager running?
Indexer running?
Dashboard available?
Agents connected?
Suricata healthy?
Sysmon logging?
Defender operational?
Operational awareness is every bit as important as threat detection. A SIEM that is not collecting telemetry provides a dangerous false sense of security (Kent & Souppaya, 2006).
Common Student Mistake
Suppose the Dashboard stops displaying new alerts.
Students often assume:
“Wazuh has stopped working.” Experienced analysts investigate methodically.
Is the Agent connected?
Is the Manager running?
Is the Manager processing events?
Is the Indexer healthy?
Is disk space available?
Is the Dashboard communicating with the Indexer?
This systematic troubleshooting methodology is one of the most valuable habits you will develop during this course.
Analyst Tradecraft Tip
A working Dashboard does not prove a working SIEM.
Validate the evidence chain from source to screen.
Chapter Connection
You now understand how Wazuh implements the core functions of a modern SIEM. In the next section, we shift from architecture to operations by examining the daily responsibilities of analysts using Wazuh. You’ll learn how investigations begin, how dashboards support decision-making, how saved searches improve efficiency, and how Wazuh becomes the operational centerpiece of a Security Operations Center.
2.8 Operating a SIEM — From Monitoring to Investigation
Learning Objectives
After completing this section, you should be able to:
Describe the daily operational workflow of a SIEM.
Differentiate between monitoring and investigation.
Explain the role of dashboards, searches, and saved queries.
Understand the importance of operational health monitoring.
Develop a repeatable investigation methodology.
Introduction
Purchasing and installing a SIEM does not improve an organization’s security. Operating it effectively does. A Security Information and Event Management platform is similar to the flight instruments in an aircraft. The instruments continuously provide information. However, they do not fly the airplane. Likewise, a SIEM continuously presents security information. It does not investigate incidents. People do. Throughout this section, we shift from understanding how a SIEM works to understanding how analysts use it every day.
The Daily Operational Cycle
Most mature Security Operations Centers follow a structured daily workflow. Although organizations differ in size and staffing, the overall process remains remarkably consistent.
A typical shift follows this sequence:
Figure 2-27
From Begin Shift to Continuous Improvement
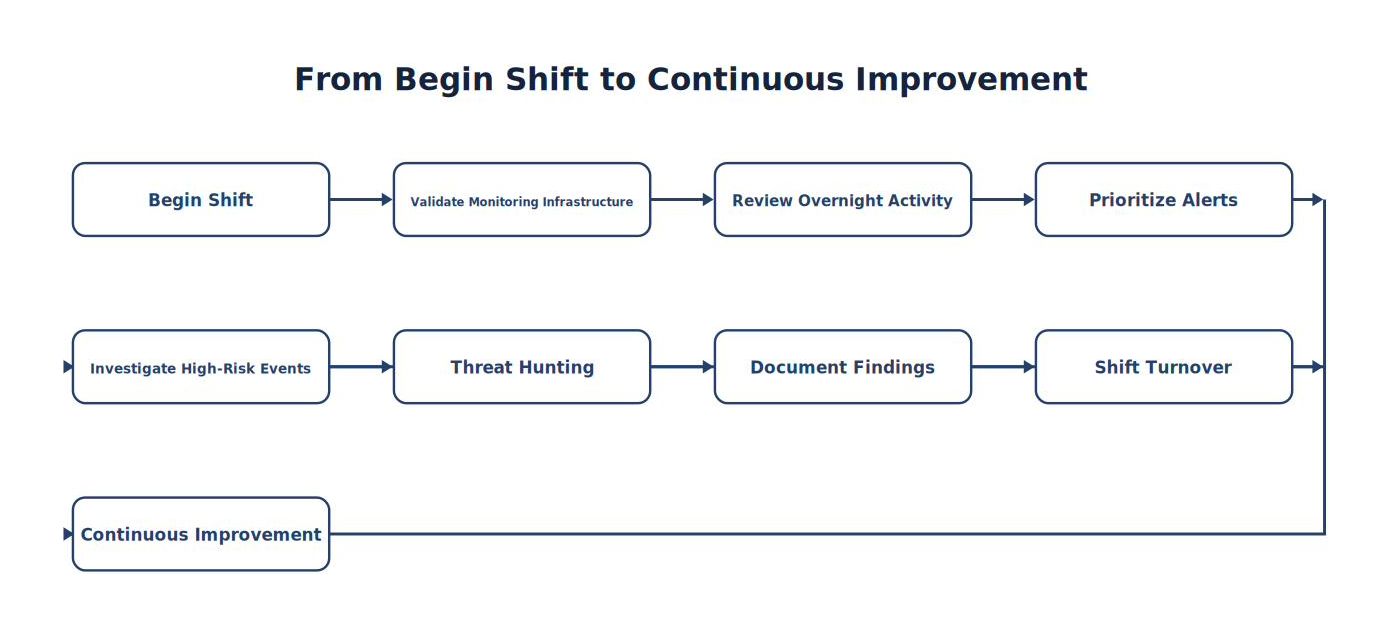
Note. The sequence traces how Begin Shift progresses to Continuous Improvement, emphasizing the intermediate evidence and processing steps.
This process repeats every shift. Notice that incident investigation represents only one portion of the analyst’s responsibilities.
Step 1 — Validate the Platform
The first responsibility of every analyst is confirming that the monitoring platform itself is healthy. Professional analysts never assume their monitoring systems are functioning correctly. Instead, they verify.
Daily operational checks include:
| Component | Verification |
|---|---|
| Wazuh Manager | Running |
| Wazuh Indexer | Healthy |
| Dashboard | Accessible |
| Agents | Connected |
| Suricata | Generating alerts |
| Sysmon | Logging events |
| Windows Defender | Operational |
| Disk Space | Sufficient |
| Time Synchronization | Accurate |
These checks require only a few minutes but prevent hours of unnecessary troubleshooting later in the day.
Analyst Tradecraft Tip
A healthy dashboard can hide unhealthy telemetry.
Validate the monitoring pipeline—not just the interface.
Step 2 — Review Platform Health
Before looking for attacks, analysts evaluate the health of the monitoring environment.
Questions include:
Which agents disconnected overnight?
Which systems stopped reporting?
Are event volumes consistent with yesterday?
Have alert rates changed significantly?
Did any critical services restart?
Were new rules deployed?
Did scheduled maintenance occur?
Unexpected changes often indicate operational problems that require attention before security investigations begin.
Figure 2-28
Operational Monitoring vs. Security Monitoring
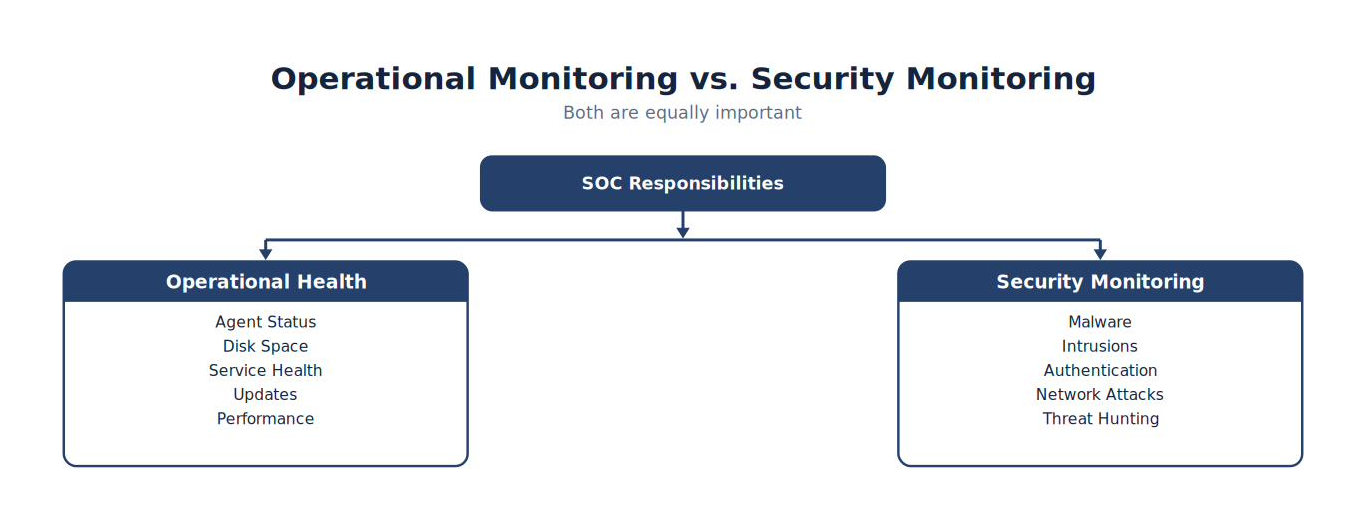
Note. The comparison highlights the operational differences represented by operational Monitoring vs. Security Monitoring and shows why the distinction matters during analysis.
Both sides are equally important. A SOC cannot investigate threats if its monitoring infrastructure is failing.
Step 3 — Prioritize Alerts
Rarely does a SOC investigate alerts in the order they appear. Instead, analysts prioritize based upon several factors.
Typical considerations include:
Severity
Confidence
Asset criticality
Business impact
User importance
Threat intelligence
Current campaigns
Organizational priorities
For example, a Medium severity alert affecting a domain controller may deserve more attention than a High severity alert on a student laboratory computer. Context matters.
Prioritization Matrix
| Priority | Example |
|---|---|
| Critical | Domain Controller Compromise |
| High | Ransomware Detection |
| High | Privilege Escalation |
| Medium | PowerShell Execution |
| Medium | Port Scan |
| Low | Failed Login |
| Informational | Service Started |
Notice that severity alone does not determine priority. Business impact also influences investigative order.
Analyst Tradecraft Tip
Investigate the alert posing the greatest organizational risk.
Cybersecurity exists to support the mission.
Step 4 — Begin the Investigation
Once priorities have been established, analysts begin gathering evidence. Rather than searching only for the alert, they expand the investigation.
Typical workflow:
Figure 2-29
From Alert to Conclusion
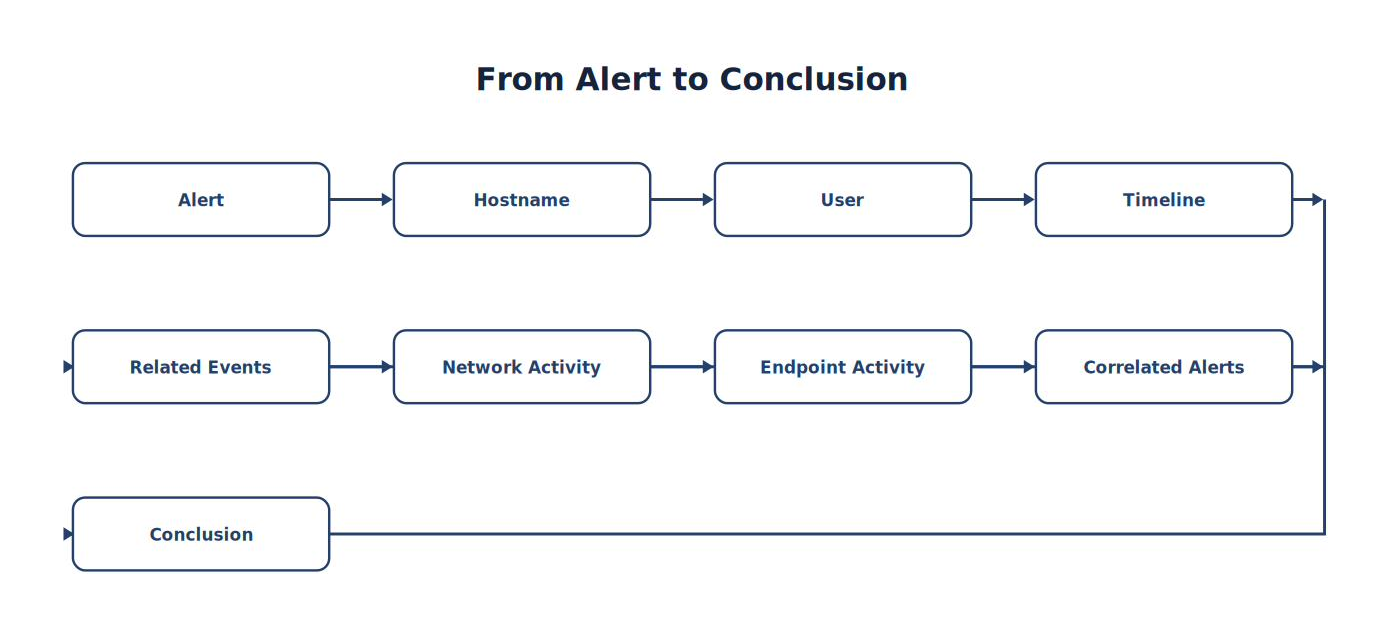
Note. The sequence traces how Alert progresses to Conclusion, emphasizing the intermediate evidence and processing steps.
Every investigation seeks to answer one fundamental question:
“What actually happened?”
Searching Efficiently
Professional analysts rely heavily on saved searches. Instead of manually building the same search every day, they create reusable investigative queries.
Examples include:
PowerShell Activity
New Administrator Accounts
Sysmon Event ID 1
Sysmon Event ID 22
Suricata Alerts
Defender Malware
Authentication Failures
USB Insertions
Saved searches improve both speed and consistency. Later chapters will demonstrate how to build these searches within Wazuh.
Dashboards Support Awareness
Dashboards provide analysts with situational awareness.
Common dashboard widgets include:
Top alert categories
Most active endpoints
Alert severity distribution
Geographic activity
Authentication failures
Malware detections
Agent health
Suricata alert trends
Dashboards help answer:
“What is happening right now?”
Searches answer:
“What exactly happened?” Understanding this distinction is important.
Figure 2-30
Dashboard vs. Investigation
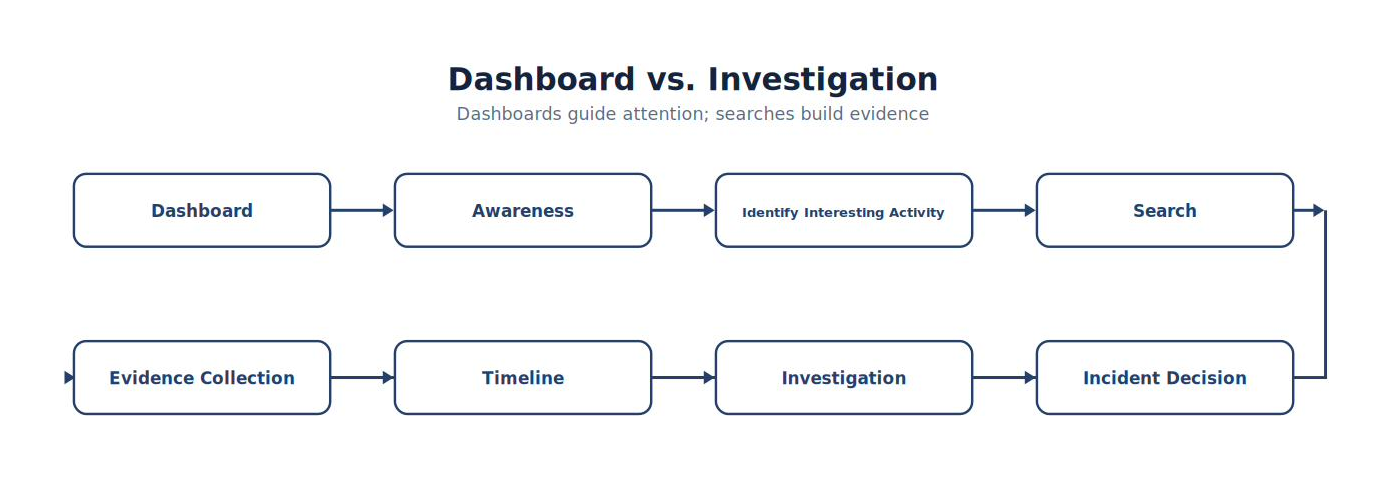
Note. The comparison highlights the operational differences represented by dashboard vs. Investigation and shows why the distinction matters during analysis.
Documentation
Every investigation should be documented.
Documentation includes:
Alert summary
Systems involved
Timeline
Evidence collected
Analysis performed
Conclusion
Response actions
Lessons learned
Good documentation serves several purposes.
It:
Supports incident response.
Enables peer review.
Preserves institutional knowledge.
Demonstrates due diligence.
Improves future investigations.
Common Student Mistake
Students often investigate an alert successfully but fail to document their findings. Weeks later, another analyst receives a similar alert. Because the previous investigation was poorly documented, the entire investigation must be repeated. Professional documentation saves time across the entire SOC.
Shift Turnover
Security operations rarely stop. Many SOCs operate continuously. Analysts therefore communicate important information during shift turnover.
Typical information includes:
Open investigations
Active incidents
Systems under observation
Outstanding alerts
Infrastructure issues
Rule modifications
Threat intelligence updates
Clear communication prevents investigations from being restarted unnecessarily.
Best Practice
A useful shift turnover document should answer three questions.
What happened?
What has already been investigated?
What still requires attention?
If the incoming analyst can answer these questions, the turnover was successful.
Continuous Improvement
The final responsibility of a mature SOC is improving itself.
After every investigation, analysts ask:
Could this alert have been detected sooner?
Was telemetry missing?
Should detection rules be improved?
Were false positives generated?
Can documentation be improved?
Is additional training required?
This feedback loop gradually improves both technology and analyst performance. The strongest Security Operations Centers treat every investigation as an opportunity to become better.
Figure 2-31
Continuous Improvement Cycle
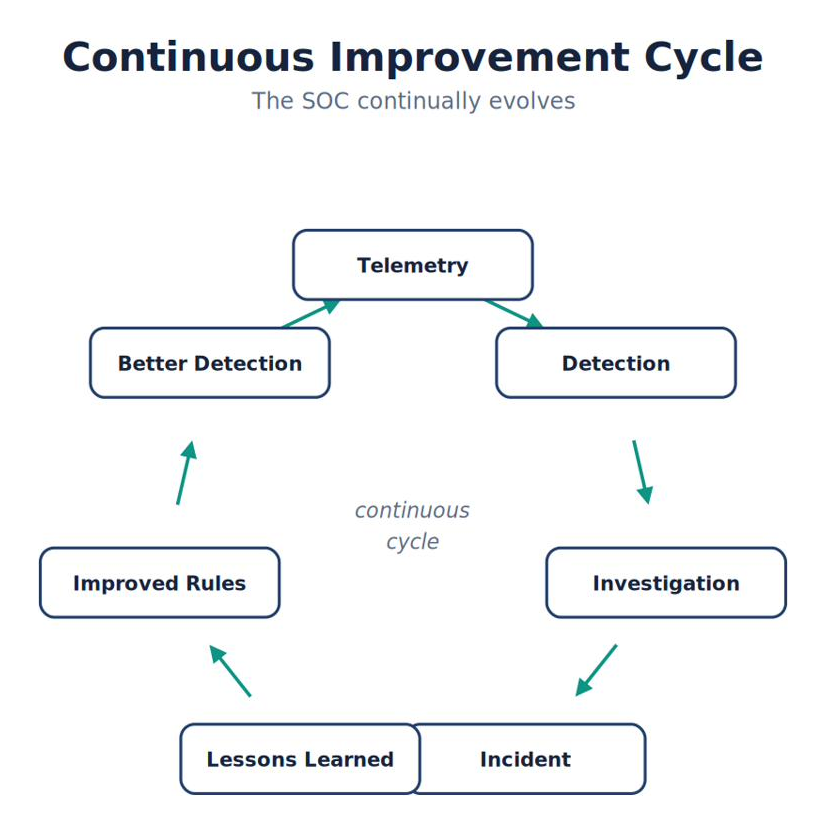
Note. The figure summarizes continuous Improvement Cycle and highlights the relationships among its principal elements, evidence sources, and analytical outcomes.
Notice that the cycle never ends. A SOC continually evolves as attackers, technologies, and organizational requirements change.
Analyst Tradecraft Tip
Do not merely close the alert. Improve the next investigation.
Validate, investigate, document, and learn.
Chapter Connection
You now understand:
Why SIEM platforms exist.
How security telemetry flows through a SIEM.
How events are normalized and enriched.
How correlation identifies meaningful relationships.
How detection rules generate alerts.
How analysts search and investigate.
How Wazuh implements an enterprise SIEM architecture.
How a SOC operates a SIEM on a daily basis.
In the remaining sections of this chapter, we will transition from theory to hands-on implementation, introducing the Wazuh interface, basic searches, dashboards, and the first laboratory exercises that prepare you to build your own operational Security Operations Center.
2.9 The Wazuh Dashboard — Your Window into the Security Operations Center
Learning Objectives
After completing this section, you should be able to:
Explain the purpose of the Wazuh Dashboard.
Identify the major areas of the Dashboard interface.
Differentiate between monitoring, searching, and investigating.
Understand how dashboards support operational awareness.
Develop efficient habits for working within the Wazuh interface.
Introduction
If the Wazuh Manager is the brain of the Security Operations Center, then the Wazuh Dashboard is its eyes. The Dashboard provides analysts with visibility into the health of the monitoring infrastructure and the security events occurring throughout the organization. It is the primary interface through which analysts interact with the SIEM.
However, an important principle should be understood immediately:
The Dashboard does not detect threats. It presents the results of telemetry collection, rule evaluation, and correlation already performed by the Wazuh platform. Think of the Dashboard as the instrument panel in an aircraft. The instruments do not fly the aircraft. They provide the information necessary for the pilot to make informed decisions. Likewise, the Dashboard provides the information analysts need to investigate security events.
The Dashboard Is Not Just a Dashboard
Beginning analysts often think the Dashboard exists only to display alerts. Professional analysts use it for much more.
The Dashboard allows analysts to:
Monitor infrastructure health
Review agent status
Search events
Investigate alerts
Analyze trends
Create reports
Build visualizations
Validate monitoring
Support threat hunting
Throughout this textbook, you will spend considerable time using the Dashboard—not simply to acknowledge alerts, but to answer investigative questions.
Figure 2-32
Dashboard Responsibilities
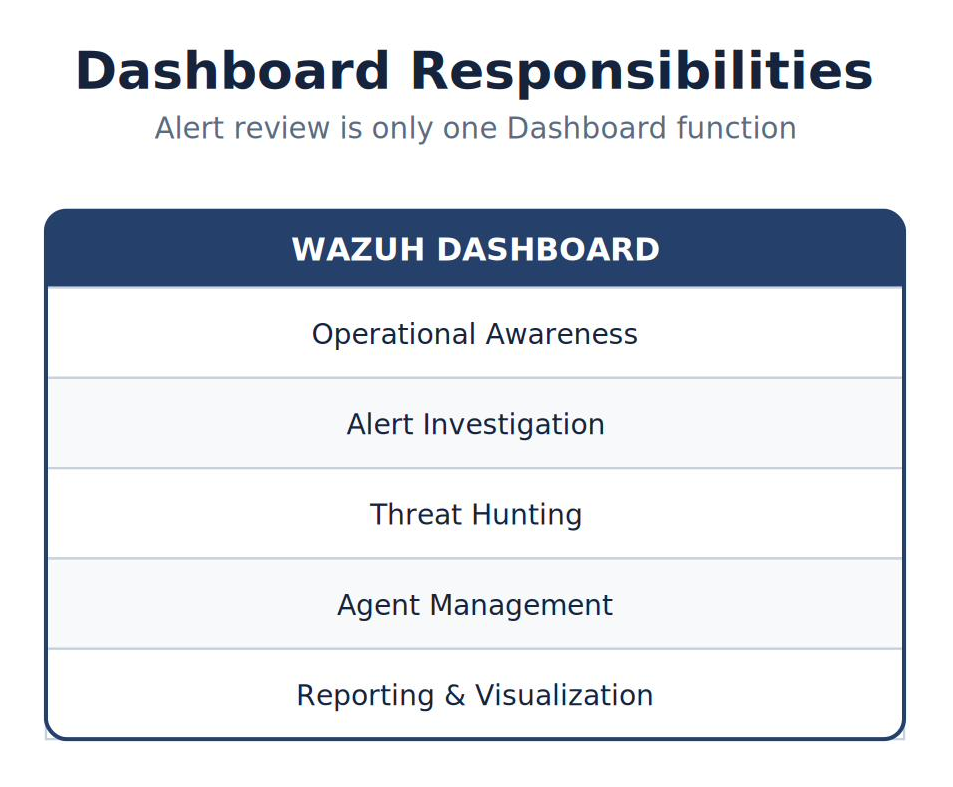
Note. The figure summarizes dashboard Responsibilities and highlights the relationships among its principal elements, evidence sources, and analytical outcomes.
Notice that alert review represents only one function of the Dashboard.
The Home Dashboard
When analysts begin their shift, the home dashboard provides a high-level operational overview.
Rather than focusing on individual alerts, the analyst first asks:
Is the platform healthy?
Are agents reporting?
Has alert volume changed?
Are there new critical alerts?
Are any monitored systems offline?
The Dashboard provides answers at a glance. This operational awareness allows analysts to identify abnormalities before beginning detailed investigations.
Operational Metrics
Typical operational metrics include:
| Metric | Why It Matters |
|---|---|
| Connected Agents | Confirms monitored systems are reporting |
| Active Alerts | Indicates current investigative workload |
| Alert Severity Distribution | Helps prioritize investigations |
| Agent Operating Systems | Confirms platform coverage |
| Recent Events | Verifies telemetry is current |
| Service Health | Detects operational problems |
These metrics answer an important question:
Can I trust my monitoring environment today?
Analyst Tradecraft Tip
Begin every shift by looking for change—including absence.
A silent sensor is not a secure network.
Alert Severity Overview
Most dashboards summarize alerts by severity.
Typical categories include:
| Severity | Color (Typical) | Example |
|---|---|---|
| Critical | Red | Active ransomware |
| High | Orange | Malware execution |
| Medium | Yellow | Suspicious PowerShell |
| Low | Blue | Failed login |
| Informational | Gray | Service started |
Severity helps analysts determine where to begin. However, severity alone never determines investigative priority. Business impact must also be considered.
Investigating Alerts
Selecting an alert should answer several questions immediately.
Which rule generated the alert?
Which endpoint generated the event?
Which user was involved?
When did it occur?
What evidence supports the alert?
What should I investigate next?
A good SIEM interface reduces the number of clicks required to answer these questions. The Dashboard should encourage investigation—not simply display notifications.
Figure 2-33
Alert Investigation Workflow
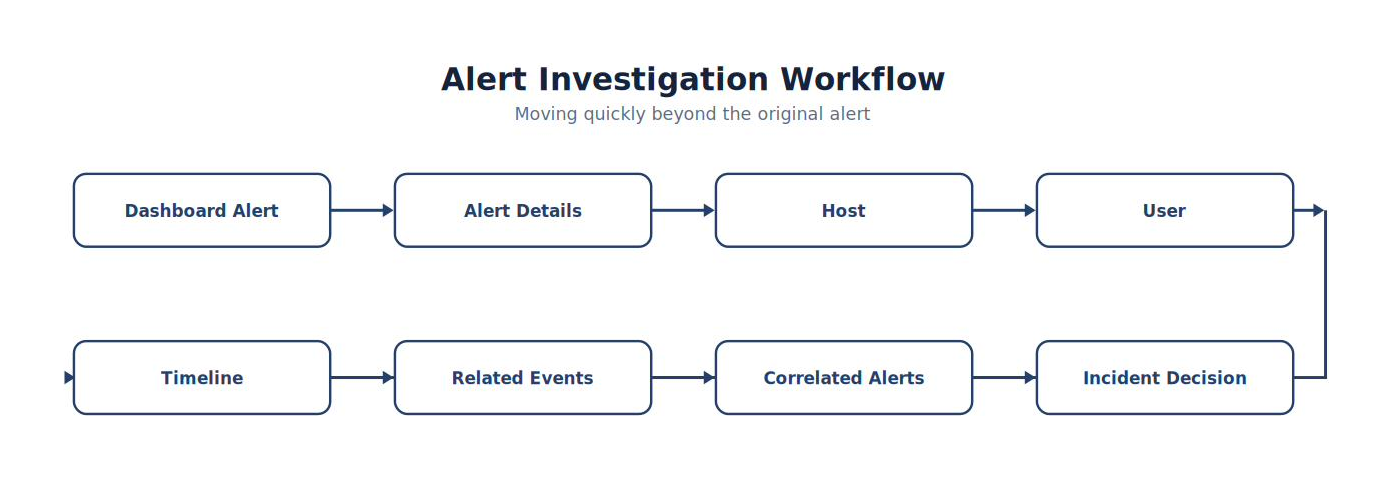
Note. The workflow presents the ordered stages of alert Investigation Workflow and highlights the validation and feedback steps that make the process repeatable.
Notice how quickly the analyst moves beyond the original alert.
Searching the Dashboard
Searching is one of the most frequently used Dashboard capabilities.
Analysts commonly search by:
Hostname
Username
IP address
Rule ID
Severity
Process name
Event ID
File name
Time range
These searches allow investigators to expand beyond the original alert and gather additional evidence.
Anatomy of a Wazuh Alert
When you open an alert in Explore → Discover, Wazuh presents its telemetry as structured fields. A handful of fields account for most investigative work, and you will use every one of them in Lab 0 and Labs 1–4:
| Field | Meaning |
|---|---|
| agent.name | The agent that produced the event (e.g., win11, u2604) |
| rule.id | The numeric identifier of the rule that fired |
| rule.level | The 0–15 severity level discussed in Section 2.5 |
| rule.description | The human-readable rule description |
| rule.groups | Rule categories used for filtering (e.g., sysmon, authentication_failed) |
| data.* | Decoded fields specific to the source (e.g., data.srcip, data.win.eventdata.image) |
| full_log | The original, unmodified log entry |
| decoder.name | The decoder that parsed the event |
Searches combine these fields with Boolean logic. For example, agent.name:“win11” and rule.level:>=7 returns medium-and-higher alerts from the Windows endpoint, and rule.groups:“authentication_failed” isolates login failures across every agent. Field names are case-sensitive, and—as Chapter 1 noted—so are the values, so agent.name:“win11” matches while agent.name:“WIN11” does not.
Finding Discover
Nearly every search in this textbook begins in the same place: from the Wazuh menu, choose Explore → Discover, then select the wazuh-alerts-* index pattern. The time picker in the upper-right corner controls the window of data displayed. Lab 1 walks through this navigation step by step; introducing it here means the interface will already be familiar when you reach the lab.
Search vs. Filter
Students often confuse searching with filtering. They serve different purposes.
Search
Search locates information matching specified criteria.
Example:
Show all activity involving WIN11.
Filter
Filters reduce the visible dataset without changing the search.
Example:
Display only High severity alerts. Searching discovers information. Filtering organizes information. Professional analysts use both continuously.
Time Windows
One of the most important Dashboard features is the time selector. Nearly every investigation depends on selecting an appropriate time range.
Common selections include:
| Time Range | Typical Use |
|---|---|
| Last 15 Minutes | Operational monitoring |
| Last Hour | Recent alerts |
| Last 24 Hours | Daily investigations |
| Last 7 Days | Trend analysis |
| Last 30 Days | Historical review |
| Custom Range | Incident investigations |
Students frequently choose a time window that is too narrow. As a result, they miss important context.
Analyst Tradecraft Tip
Expand the window. Expand the context.
Start 30 minutes before the alert and continue 30 minutes after it.
Saved Searches
One of the most powerful productivity features of the Dashboard is the ability to save frequently used searches.
Examples include:
| Saved Search | Purpose |
|---|---|
| Sysmon Process Creation | Process investigations |
| DNS Queries | Network investigations |
| Suricata Alerts | IDS review |
| Defender Malware | Malware investigations |
| Failed Authentication | Account monitoring |
| PowerShell Activity | Threat hunting |
| New Local Administrators | Privilege monitoring |
Saved searches provide consistency across investigations and reduce repetitive work.
Visualizations
Dashboards transform large amounts of telemetry into visual summaries.
Examples include:
Pie charts
Bar graphs
Line charts
Geographic maps
Heat maps
Trend graphs
Visualizations answer questions such as:
Are malware detections increasing?
Which hosts generate the most alerts?
Which rule fires most frequently?
Are attacks occurring during specific hours?
Visualizations complement investigations but never replace detailed analysis.
Common Student Mistake
A student notices a spike in malware detections on a dashboard and immediately concludes that malware infections are increasing. After investigation, the analyst discovers that an instructor distributed the EICAR antivirus test file during a laboratory exercise (EICAR, n.d.). The dashboard was accurate. The interpretation was incorrect. Always validate visual trends before drawing conclusions.
Building an Investigation Workspace
Professional analysts organize the Dashboard around their daily responsibilities.
A well-designed investigation workspace might include:
Recent High Severity Alerts
Connected Agent Status
Suricata Alert Trends
Sysmon Process Activity
Defender Malware Events
Authentication Failures
Event Volume by Host
Rule Frequency
This arrangement allows analysts to transition quickly from monitoring to investigation.
Best Practice
Customize dashboards to support your workflow, not to impress visitors. A useful dashboard answers operational questions quickly. An attractive dashboard that requires constant searching to find information is less valuable than a simple dashboard that immediately highlights important activity.
Analyst Tradecraft Tip
Silence is a signal—not proof of safety.
Validate sensor health before declaring the network quiet.
Chapter Connection
You now understand how analysts interact with the Wazuh Dashboard to monitor infrastructure, investigate alerts, perform searches, and maintain operational awareness. In the next section, we transition from understanding the interface to using it operationally. You will learn practical investigation techniques, dashboard navigation strategies, common search workflows, and the investigative habits that distinguish experienced SOC analysts from beginners.
2.10 Conducting a SIEM Investigation Using Wazuh
Learning Objectives
After completing this section, you should be able to:
Apply a structured methodology to every SIEM investigation.
Differentiate between observation, evidence, and conclusions.
Use Wazuh to collect supporting evidence from multiple telemetry sources.
Develop investigative hypotheses and test them using available data.
Document investigations using professional SOC practices.
Introduction
A SIEM provides access to an enormous amount of information. Knowing where to find that information is important. Knowing how to investigate it is even more important. Successful analysts do not randomly click through dashboards looking for interesting alerts. Instead, they follow a disciplined investigative methodology that can be repeated regardless of the technology being used. Whether the organization uses Wazuh, Microsoft Sentinel, Splunk Enterprise Security, IBM QRadar, Google SecOps, or Elastic Security, the investigative thought process remains remarkably similar. The software changes. The methodology does not.
The Scientific Method of Cybersecurity
Professional investigations closely resemble the scientific method. Scientists do not begin with conclusions. They begin with observations. SOC analysts follow exactly the same approach. The investigation begins with an observation. The analyst develops one or more hypotheses. Evidence is collected. The hypotheses are tested. Only after sufficient evidence has been gathered is a conclusion reached. This process minimizes bias and encourages objective analysis.
Figure 2-34
Investigation Methodology
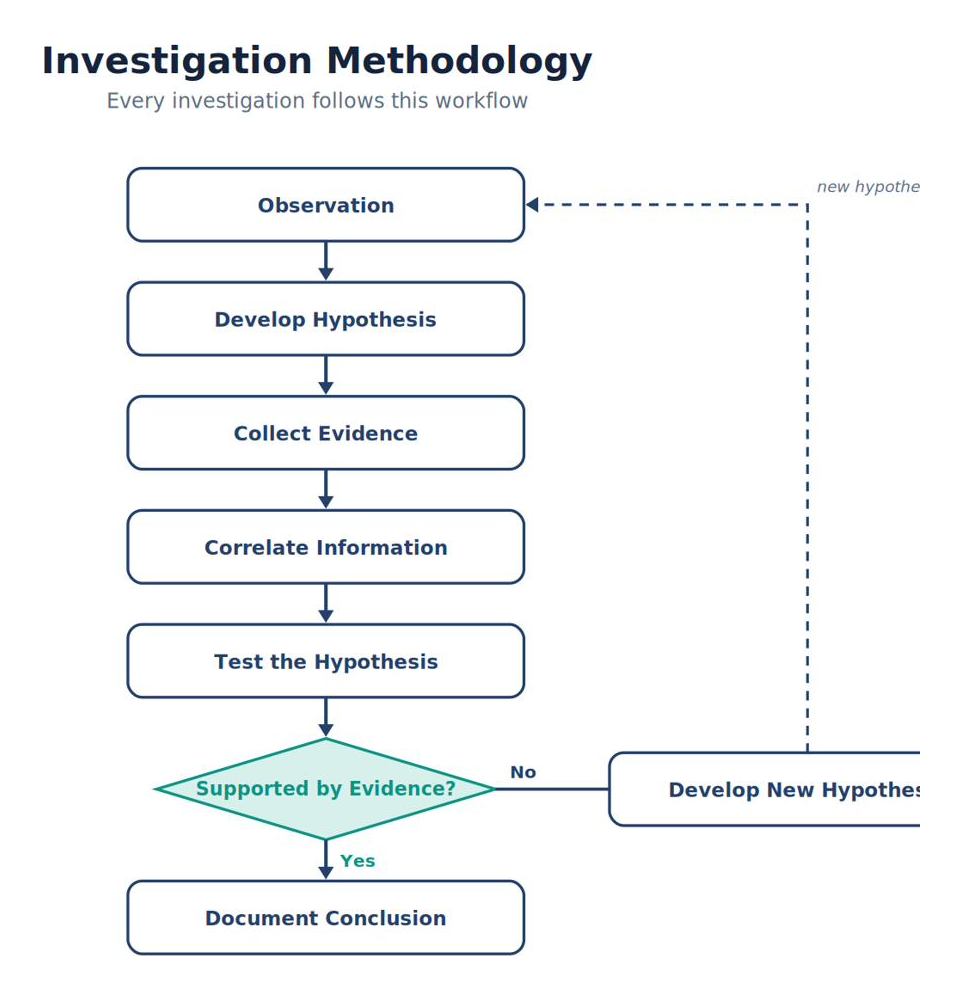
Note. The figure summarizes investigation Methodology and highlights the relationships among its principal elements, evidence sources, and analytical outcomes.
This methodology should become second nature. Every investigation throughout this textbook follows this workflow.
Step 1 — Observe
Every investigation begins with an observation.
Examples include:
A Wazuh alert
A Suricata signature
A Windows Defender detection
A user report
A threat intelligence notification
A vulnerability scan result
The observation simply tells us that something deserves attention. It does not prove malicious activity.
Example
Suppose Wazuh displays:
Suricata: ET SCAN Potential SSH Scan
What do we know?
Very little. We know only that Suricata observed behavior matching one of its detection signatures.
We do not yet know:
Who initiated the scan.
Whether the activity was authorized.
Which systems were affected.
Whether compromise occurred.
Those questions require investigation.
Step 2 — Develop a Hypothesis
A hypothesis is a possible explanation for the observed activity. For the SSH scan example, several hypotheses are reasonable.
Hypothesis A
An external attacker is scanning the network.
Hypothesis B
A vulnerability scanner performed a scheduled assessment.
Hypothesis C
A student executed an authorized Nmap scan during a laboratory exercise.
Hypothesis D
An administrator performed routine diagnostics. At this point, every hypothesis remains possible.
Analyst Tradecraft Tip
Challenge your favorite hypothesis first.
A sound conclusion survives attempts to disprove it.
Step 3 — Collect Evidence
The next step is gathering relevant telemetry. Notice the word relevant. Professional analysts do not collect everything. They collect information likely to support or refute the hypothesis.
Possible evidence includes:
| Source | Example Evidence |
|---|---|
| Suricata | Signature, Source IP, Destination IP |
| Sysmon | Process execution |
| Windows Event Logs | Authentication activity |
| Defender | Malware detection |
| Wazuh | Related alerts |
| DNS Logs | Name resolution |
| Firewall | Network connections |
The investigation expands outward from the original alert.
Step 4 — Correlate
Evidence from multiple sources is now combined.
Suppose we discover:
| Time | Source | Observation |
|---|---|---|
| 10:42 | Sysmon | Nmap Executed |
| 10:43 | Suricata | SSH Scan Detected |
| 10:43 | Firewall | Multiple Connections |
| 10:44 | Wazuh | Scan Rule Triggered |
The evidence tells a coherent story. Instead of isolated observations, the analyst sees a timeline.
Figure 2-35
Evidence Correlation
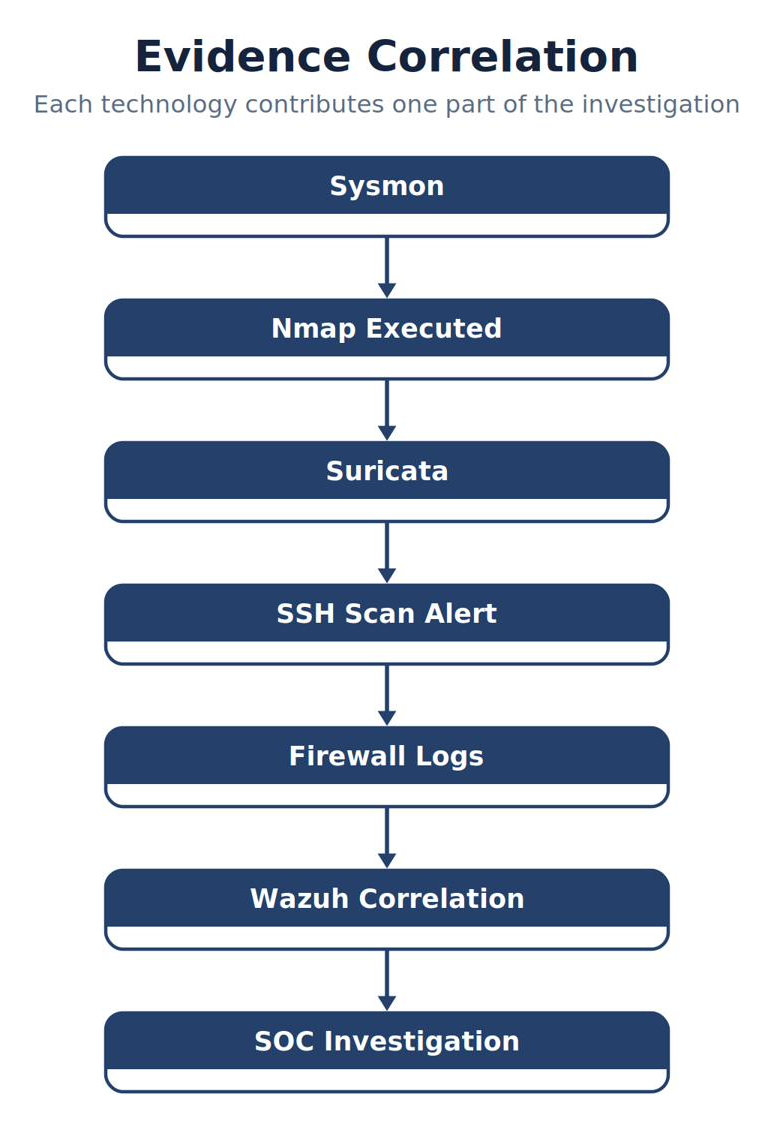
Note. The figure summarizes evidence Correlation and highlights the relationships among its principal elements, evidence sources, and analytical outcomes.
Notice how each technology contributes one part of the investigation.
Step 5 — Test the Hypothesis
Now compare the evidence against each hypothesis.
Was this an external attacker?
No. The source IP belongs to an internal laboratory workstation.
Was this scheduled vulnerability scanning?
No. The scheduled scanner was not operating.
Was this an instructor-directed laboratory exercise?
Yes. The instructor initiated an Nmap scan during class. The evidence supports this explanation.
Step 6 — Draw Conclusions
Only after testing the available evidence should the analyst reach a conclusion.
The investigation concludes:
Detection worked correctly.
Suricata generated an alert.
Wazuh received telemetry.
Dashboard displayed the alert.
Activity was expected.
No incident exists.
Notice how different this conclusion is from:
“Someone scanned the network.” Professional investigations are precise.
Avoiding Confirmation Bias
Confirmation bias occurs when analysts seek only evidence supporting their initial belief. Structured analytic techniques were developed within the intelligence community specifically to counter this tendency, and they apply directly to SOC investigations (Heuer, 1999).
Example:
Alert:
PowerShell Detected
The analyst immediately assumes malware. Every observation is interpreted as supporting compromise. Professional analysts deliberately search for alternative explanations.
Perhaps:
A system administrator executed PowerShell.
A software installation script ran.
A classroom demonstration occurred.
A management tool executed automatically.
Objectivity is essential.
Common Student Mistake
Students often confuse absence of evidence with evidence of absence.
For example:
“No Suricata alerts appeared.”
Does that mean no attack occurred?
Not necessarily.
Perhaps:
Suricata stopped.
HOME_NET is incorrect.
Rules failed to load.
eve.json is no longer updating.
The Wazuh Agent stopped monitoring the file.
Before concluding that no attack occurred, verify that the monitoring system was capable of detecting it.
The Investigation Notebook
Professional analysts maintain detailed notes during every investigation.
Typical documentation includes:
Date and time
Alert identifier
Initial observation
Systems involved
User accounts
Evidence collected
Timeline
Hypotheses considered
Final conclusion
Recommended actions
These notes become invaluable when investigations continue across multiple shifts or require peer review.
Best Practice
Document why you reached your conclusion—not just what your conclusion was. Future analysts should be able to reproduce your reasoning from the evidence you collected. This habit improves collaboration, supports legal defensibility, and helps organizations refine their detection capabilities over time.
You receive the following Wazuh alert:
Suspicious PowerShell Execution
Before touching the keyboard, write down three possible explanations.
Then ask:
What evidence would prove each explanation?
Which telemetry sources should I examine?
What additional information do I need?
Which hypothesis currently has the strongest support?
Only after answering those questions should you begin searching the Dashboard. That is how experienced analysts approach investigations.
Looking Ahead
You have now learned:
Why SIEM platforms exist.
How telemetry enters Wazuh.
How events are normalized.
How correlation identifies suspicious activity.
How rules generate alerts.
How analysts investigate evidence.
How Wazuh supports the complete investigative lifecycle.
The remainder of this chapter transitions from concepts to hands-on operations, where you will begin working directly with the Wazuh interface, learning the searches, dashboards, and operational techniques that will become routine throughout the remainder of this textbook.
2.11 Building an Investigation Mindset
Learning Objectives
After completing this section, you should be able to:
Think systematically during an investigation.
Avoid common analytical mistakes.
Distinguish facts from assumptions.
Develop repeatable investigative habits.
Understand why methodology is more important than memorizing commands.
The Most Valuable Skill in Cybersecurity
Students often ask:
“What command should I learn first?”
The better question is:
“How should I think?” Tools change. Operating systems change. Detection rules change. Attack techniques evolve. However, the ability to think logically, evaluate evidence objectively, and conduct a structured investigation remains valuable throughout an entire cybersecurity career. The purpose of this textbook is not merely to teach Wazuh. It is to teach you how professional SOC analysts think.
Investigations Begin With Questions
Beginning analysts often believe investigations begin with answers. Professional analysts know they begin with questions. Suppose Wazuh generates the following alert.
Possible Command-and-Control Communication
A beginner might ask:
“How do I block it?”
An experienced analyst asks:
Who initiated the connection?
Which endpoint is involved?
Is the destination known to be malicious?
Has this endpoint contacted the destination previously?
Did another security product observe related activity?
Was malware detected?
Did the user intentionally perform the activity?
Questions guide investigations. Assumptions end them prematurely.
Figure 2-36
Questions Drive Investigations
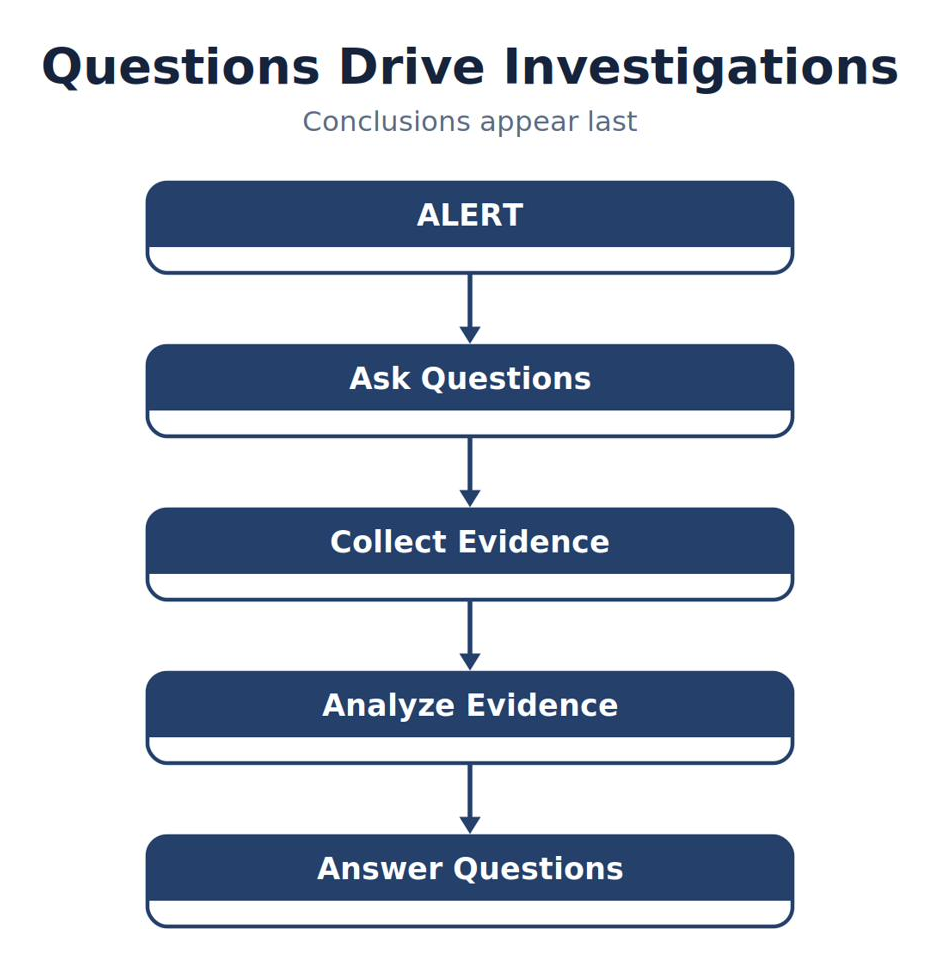
Note. The figure summarizes questions Drive Investigations and highlights the relationships among its principal elements, evidence sources, and analytical outcomes.
Notice that conclusions appear last.
Facts Versus Assumptions
One of the most important habits of experienced investigators is separating facts from assumptions. Consider the following alert.
Suricata: ET MALWARE Possible C2 Traffic
Which of the following are facts?
Suricata generated an alert.
The alert matched an Emerging Threats signature.
The destination IP address is 198.51.100.42.
The event occurred at 14:23.
These are facts because they are directly supported by telemetry. Now consider these statements.
Malware infected the workstation.
Data was stolen.
The attacker gained persistence.
The organization has been compromised.
These are assumptions. None can be supported until additional evidence is collected.
Analyst Tradecraft Tip
“Based on the available evidence…”
State confidence from evidence—not certainty from opinion.
Evidence Has Weight
Not all evidence carries equal value. Consider the following sources.
| Evidence | Reliability |
|---|---|
| Verified Sysmon Event | High |
| Suricata Alert | High |
| Windows Event Log | High |
| Threat Intelligence Feed | Medium to High |
| User Statement | Variable |
| Screenshot | Medium |
| Memory of Events | Low |
Whenever possible, conclusions should be based upon independently verifiable telemetry rather than recollection.
Corroboration
One piece of evidence is good. Two independent pieces are better.
Suppose Sysmon records:
powershell.exe
This is useful.
Now suppose:
Sysmon records PowerShell.
Suricata observes an outbound download.
Defender detects malware.
Three independent systems now support the same conclusion. Confidence increases significantly. This process is known as corroboration.
Figure 2-37
Corroborating Evidence
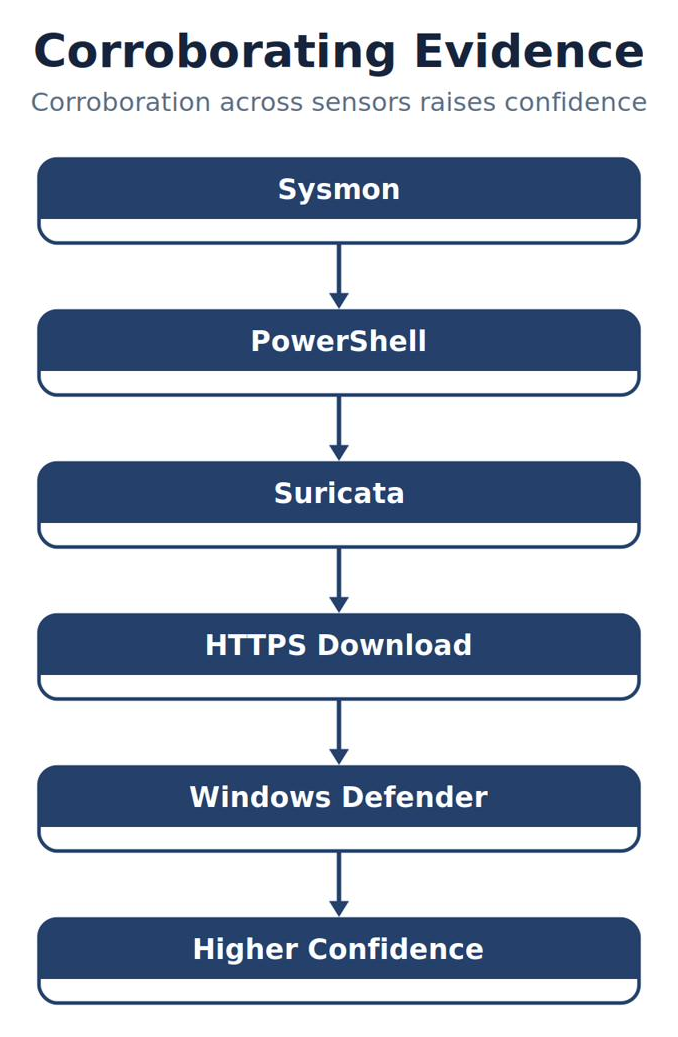
Note. The figure summarizes corroborating Evidence and highlights the relationships among its principal elements, evidence sources, and analytical outcomes.
Professional investigations seek corroboration whenever possible.
Avoid Tunnel Vision
Tunnel vision occurs when analysts become so focused on one alert that they overlook other important information.
Imagine receiving:
Possible Malware Download
A narrow investigation examines only the downloaded file.
A broader investigation also examines:
User logins
PowerShell history
Registry changes
Scheduled tasks
New services
Network connections
USB activity
DNS requests
Authentication logs
The broader investigation frequently uncovers persistence mechanisms or lateral movement that would otherwise remain hidden.
The Investigation Pyramid
Professional analysts gradually narrow their focus. They do not begin with the smallest detail.
Figure 2-38
From Entire Environment to Specific Event
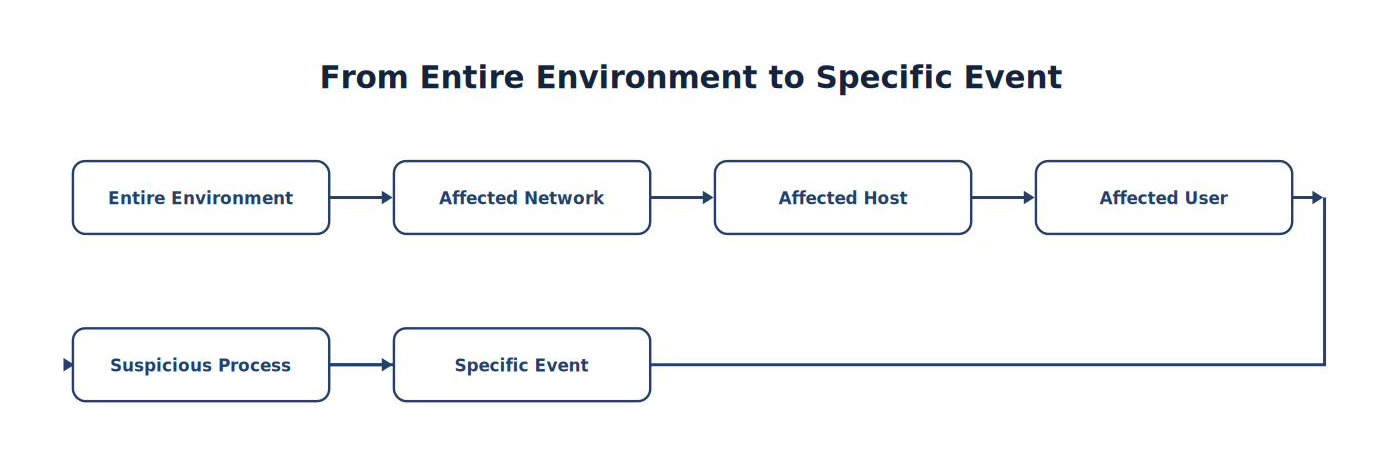
Note. The sequence traces how Entire Environment progresses to Specific Event, emphasizing the intermediate evidence and processing steps.
Beginning broadly helps ensure that important evidence is not overlooked.
Thinking in Timelines
Cybersecurity investigations are rarely about individual events. They are about sequences. Suppose the following occurred.
| Time | Activity |
|---|---|
| 09:00 | User Login |
| 09:04 | Email Opened |
| 09:05 | Word Document Opened |
| 09:05 | PowerShell Started |
| 09:06 | HTTPS Download |
| 09:06 | Defender Detection |
| 09:08 | User Logged Off |
Notice how the sequence explains the activity. Removing any single event makes the investigation more difficult. Professional analysts therefore think chronologically.
Analyst Tradecraft Tip
When the evidence becomes confusing, build the timeline.
Sequence reveals relationships that isolated events conceal.
Documentation Is Evidence
An undocumented investigation has limited value.
Professional documentation should answer:
What initiated the investigation?
What evidence was collected?
Which systems were examined?
Which hypotheses were considered?
What conclusion was reached?
What evidence supports that conclusion?
What recommendations were made?
Future investigators should be able to reconstruct your investigation without speaking to you.
Common Student Mistake
A student investigates an alert successfully.
Later, the instructor asks:
“Why did you conclude this was benign?”
The student replies:
“I don’t remember.” Professional analysts never rely on memory. They rely on documentation.
Best Practice
At the end of every investigation ask:
Could another analyst reproduce my work using only my notes?
If the answer is no, the documentation is incomplete.
Analyst Tradecraft Tip
Tools display evidence. Analysts investigate it.
Methodology outlasts every platform.
Chapter Transition
At this point, you have developed the conceptual foundation required to begin working with Wazuh as a professional SOC analyst. Beginning in the next chapter, the textbook shifts from understanding SIEM concepts to building the laboratory itself.
You will install, validate, configure, and troubleshoot each component of the environment, including:
The Wazuh Server
Ubuntu 26.04
Wazuh Agents
Windows 11
Sysmon
Suricata
Emerging Threats
The Wazuh Dashboard
Every configuration task will reinforce the investigative methodology established in Chapters 1 and 2.
2.12 SIEM Maturity — From Log Collection to Threat Hunting
Learning Objectives
After completing this section, you should be able to:
Explain the stages of SIEM maturity.
Distinguish between reactive and proactive security operations.
Understand how organizations evolve their SOC capabilities.
Recognize where the laboratory environment fits within the maturity model.
Develop realistic expectations for building and operating a SIEM.
Introduction
Installing a SIEM does not immediately create a mature Security Operations Center. Many organizations purchase sophisticated security platforms expecting them to automatically improve security. Unfortunately, technology alone rarely produces better outcomes. A mature SOC develops gradually. Processes become standardized. Detection rules improve. Analysts gain experience. Telemetry quality increases. Investigations become more efficient. Threat hunting becomes proactive rather than reactive. Understanding this progression is important because students often compare their first laboratory with highly mature enterprise SOCs. That comparison is neither realistic nor productive. Instead, think of SOC development as a journey.
Alerts to Answers SIEM Capability Progression
The five levels below are an instructional sequence for this textbook, not an official NIST or SANS maturity model. They organize the laboratory journey from collection through continuous improvement. Organizations may develop capabilities in a different order, operate at different levels across domains, or use a formal current/target profile instead of a single label.
Level 1 — Log Collection
At the first stage, organizations simply collect logs.
Typical characteristics include:
Basic event collection
Limited storage
Minimal alerting
Little standardization
Manual searches
No correlation
The primary question is:
“Can we collect security information?” Many organizations remain at this stage for years.
Figure 2-39
SIEM Maturity Level 1
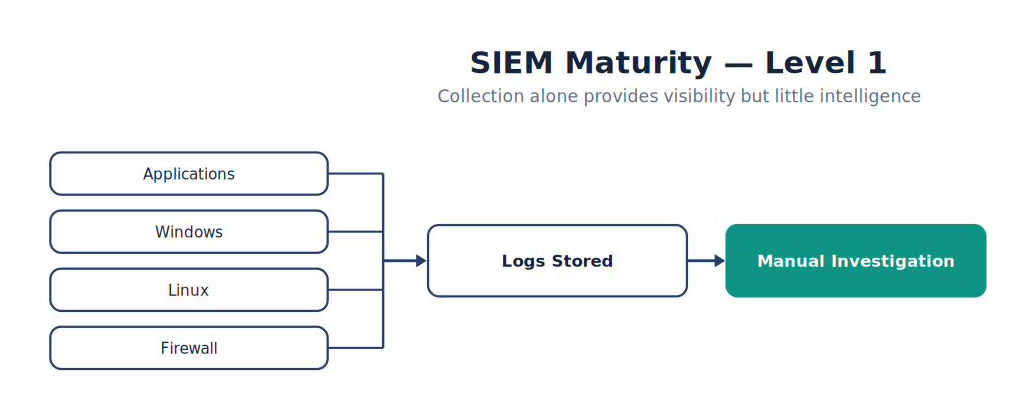
Note. The figure traces the progression represented by sIEM Maturity Level 1, showing how capabilities become more integrated, repeatable, and evidence driven.
Collection alone provides visibility but very little intelligence.
Level 2 — Centralized Monitoring
The next stage introduces centralized visibility.
Organizations now:
Aggregate logs
Deploy dashboards
Create alerts
Monitor infrastructure
Standardize telemetry
Instead of examining individual systems, analysts begin using a central console. This represents the first true Security Operations Center.
Characteristics
Organizations now ask:
Which systems generated alerts?
Which users authenticated?
Which agents disconnected?
Which endpoints reported malware?
Visibility improves dramatically.
Level 3 — Correlation
The third stage introduces meaningful relationships between events.
Rather than viewing events independently, the SIEM identifies:
Related users
Related hosts
Related IP addresses
Related timelines
Related attack techniques
Correlation significantly reduces analyst workload. Instead of investigating fifty unrelated alerts, the analyst investigates one correlated incident.
Figure 2-40
Correlation

Note. The figure summarizes correlation and highlights the relationships among its principal elements, evidence sources, and analytical outcomes.
Level 4 — Threat Hunting
Once organizations become comfortable responding to alerts, they begin proactively searching for threats. This process is called Threat Hunting (Knerler et al., 2022). Threat hunting begins with a different question.
Instead of asking:
“What generated an alert?”
Analysts ask:
“What malicious activity might exist that has not generated an alert?” Threat hunting represents one of the highest-value activities performed by mature SOCs.
Examples
Threat hunters may search for:
Rare PowerShell execution
Administrative tools executed by non-administrators
DNS tunneling
Long-running PowerShell sessions
Unsigned drivers
Scheduled task creation
Encoded command execution
Credential dumping behavior
These searches often reveal attacks before automated rules generate alerts.
Level 5 — Continuous Improvement
The most mature Security Operations Centers continuously improve themselves.
Every investigation results in questions such as:
Should a new detection rule be written?
Should existing rules be tuned?
Was telemetry missing?
Were analysts delayed?
Should documentation be improved?
Should automation be added?
The SOC gradually becomes:
Faster
More accurate
More efficient
Better documented
Easier to operate
Security becomes an iterative process rather than a fixed configuration.
Figure 2-41
Continuous Improvement
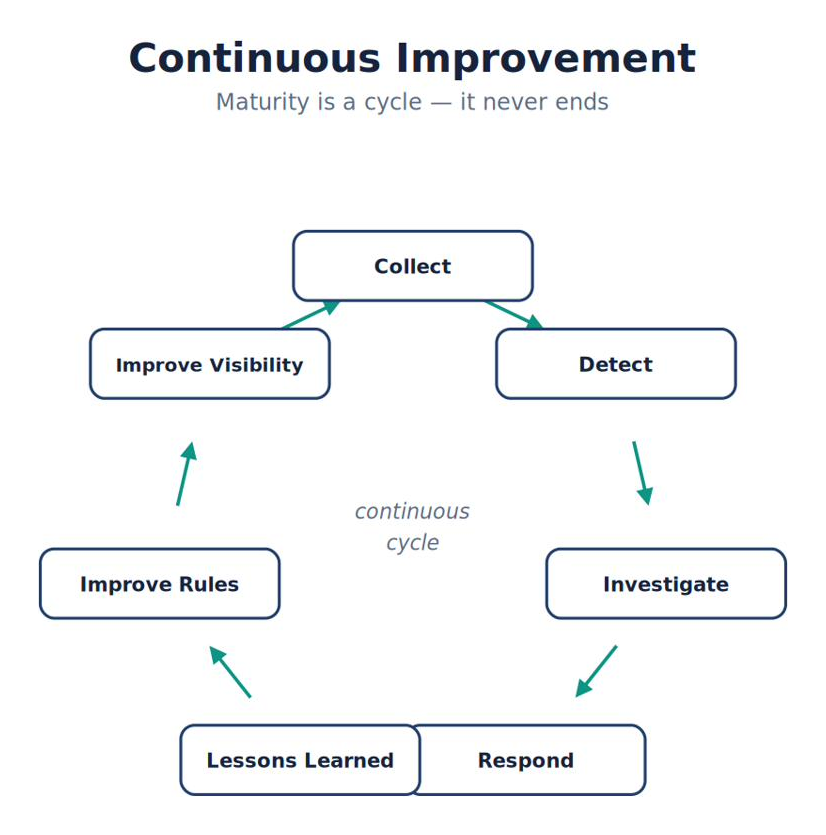
Note. The figure summarizes continuous Improvement and highlights the relationships among its principal elements, evidence sources, and analytical outcomes.
Notice that maturity is a cycle. It never ends.
Where Does Our Laboratory Fit?
The laboratory used throughout this textbook intentionally includes capabilities from multiple maturity levels.
Students will learn:
Level 1
Collect logs
Validate telemetry
Configure agents
Level 2
Monitor dashboards
Review alerts
Validate infrastructure
Level 3
Correlate Sysmon
Correlate Suricata
Correlate Defender
Investigate timelines
Level 4
Perform threat hunting
Search historical telemetry
Develop hypotheses
Level 5
Tune Wazuh rules
Write custom rules
Improve Suricata signatures
Validate detections
Measure SOC performance
By the end of this textbook, students will have experienced every stage of SIEM maturity.
Analyst Tradecraft Tip
The goal is not perfection.
The goal is continuous improvement.
Leave the SOC stronger after every investigation.
Building Your Professional Habits
Regardless of technology, professional analysts develop consistent habits.
Every morning they ask:
Are my sensors healthy?
Are my agents connected?
Has telemetry changed?
Which alerts require attention?
What changed overnight?
Every investigation follows the same disciplined process. Every conclusion is supported by evidence. Every incident becomes a learning opportunity. These habits matter far more than memorizing commands.
Common Student Mistake
Students often compare themselves to analysts with ten years of experience. Instead, compare yourself to who you were yesterday. Professional growth occurs through repetition.
Each investigation teaches:
Better searches.
Better questions.
Better documentation.
Better detection logic.
Eventually, good habits become automatic.
Best Practice
Never ask:
“Have I finished learning Wazuh?”
Instead ask:
“Am I becoming a better investigator?” The SIEM is simply a tool. Your analytical ability is what ultimately determines the quality of your investigations.
Analyst Tradecraft Tip
Technology enables capability; people create it.
A SIEM matures only when its people and practices mature with it.
Preparing for Part II
The first two chapters established the conceptual foundation for Security Operations.
You now understand:
Why SOCs exist.
How security telemetry is generated.
How SIEM platforms process information.
How Wazuh implements SIEM architecture.
How analysts investigate evidence.
How mature SOCs evolve.
Beginning with Chapter 3, the focus shifts from theory to implementation. You will begin constructing the laboratory one component at a time, validating every stage of the telemetry pipeline, and learning to troubleshoot problems exactly as a professional SOC analyst would.
Throughout the remainder of this book, every command, every configuration file, every alert, and every laboratory exercise will reinforce a single guiding principle established in the opening chapters:
Trust evidence. Validate telemetry. Think systematically. Those three habits form the foundation of every successful Security Operations Center.
Case Study 2-1 — Following the Evidence (Chapter 2 Capstone)
Learning Objectives
After completing this case study, you should be able to:
Apply the complete SIEM investigation methodology introduced in this chapter.
Distinguish observations from conclusions.
Correlate telemetry from multiple security technologies.
Build an investigative timeline.
Determine whether an alert represents an incident.
Develop professional documentation habits.
Background
It is 9:15 AM on a Tuesday morning. You have just begun your shift as a Tier 1 SOC analyst. The overnight analyst reports that the monitoring infrastructure is healthy.
You verify:
✓ Wazuh Manager operational
✓ Indexer healthy
✓ Dashboard responding
✓ Ubuntu Agent connected
✓ Windows Agent connected
✓ Suricata generating telemetry
✓ Sysmon logging correctly
✓ Windows Defender operational
Only after confirming the health of the monitoring infrastructure do you begin reviewing new alerts.
This immediately demonstrates one of the central themes of this textbook:
Always validate telemetry before investigating alerts.
Initial Alert
The Wazuh Dashboard displays the following alert.
Rule:
Suspicious PowerShell Execution
Severity:
Medium
Host:
WIN11
Time:
09:11:43
This is all you know. Nothing more. Nothing less.
What Do You Actually Know?
Many beginning analysts immediately conclude:
Malware. Professional analysts pause. Let’s separate facts from assumptions.
Facts
Wazuh generated an alert.
A detection rule matched.
PowerShell executed.
The alert originated from WIN11.
The event occurred at 09:11.
Everything above is supported by telemetry.
Assumptions
The following are NOT supported by evidence.
Malware executed.
The workstation is compromised.
An attacker gained access.
Data was stolen.
Ransomware exists.
These remain hypotheses.
Step 1
Expand the Time Window
Rather than examining one event, the analyst expands the search window.
Current investigation:
08:45 → 09:30
Immediately, additional activity appears.
Timeline
| Time | Source | Event |
|---|---|---|
| 09:03 | Windows | User Login |
| 09:08 | Word Started | |
| 09:11 | Sysmon | PowerShell Started |
| 09:11 | Sysmon | DNS Query |
| 09:12 | Suricata | HTTP Alert |
| 09:13 | Windows Defender | Malware Quarantined |
Interesting. Now we have a sequence.
Step 2
Ask Better Questions
Instead of asking, “Was PowerShell malicious?”, the analyst asks:
What started PowerShell?
What command line was executed?
Did network communication follow?
Did Defender detect anything?
Did another endpoint behave similarly?
Did the user intentionally perform this action?
Notice how the investigation becomes much broader.
Step 3
Examine Sysmon
Sysmon reports:
Process:
powershell.exe
Parent:
WINWORD.EXE
Immediately, this deserves additional attention. Microsoft Word rarely launches PowerShell during routine office work.
Analyst Tradecraft Tip
Suspicious is not the same as proven.
One event rarely proves compromise.
Step 4 — Examine DNS Activity
Sysmon Event ID 22 shows:
example-download-site.com
Question:
Was this domain expected?
The analyst searches historical data.
Result:
No previous communication. Interesting.
Step 5
Examine Suricata
Suricata reports:
ET POLICY
Executable Download
HTTP
Now the investigation has expanded.
We now know:
PowerShell executed.
DNS resolved.
HTTP download occurred.
Still, we do not know whether malware executed.
Step 6
Windows Defender
Defender reports
Threat Detected
Trojan:Script
Quarantined
Notice the wording. Quarantined. This means Defender prevented execution. That changes the investigation.
Correlating the Evidence
Instead of examining five alerts, the analyst builds one timeline.
Figure 2-42
From User Login to Alert
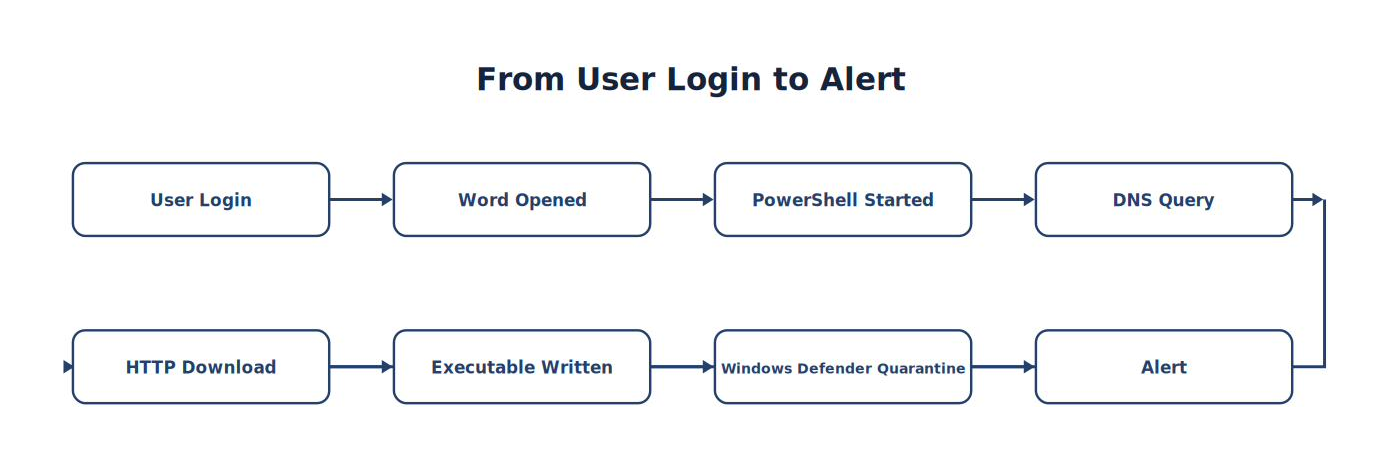
Note. The sequence traces how User Login progresses to Alert, emphasizing the intermediate evidence and processing steps.
Now the investigation makes sense.
Investigation Notes
Current observations:
✓ Word launched PowerShell. ✓ PowerShell resolved DNS. ✓ HTTP download occurred. ✓ Defender quarantined file. ✓ No additional systems involved.
Hypothesis Review
Hypothesis 1
Malware successfully compromised the workstation.
Evidence?
Not yet. Defender quarantined the file before execution.
Hypothesis 2
Attempted malware infection successfully prevented.
Evidence?
Supported. Current evidence strongly supports this explanation.
Investigation Outcome
At this stage, the analyst concludes:
Detection pipeline operated correctly.
Sysmon captured endpoint activity.
Suricata detected network activity.
Defender prevented execution.
Wazuh correlated telemetry.
No evidence of successful compromise.
Incident severity:
Low
Reason:
Attempted compromise prevented by endpoint protection.
Lessons Learned
This investigation demonstrates several important principles. The first alert never told the entire story.
Instead, the analyst correlated telemetry from:
Sysmon
Suricata
Windows Defender
Windows Logs
Wazuh
Only after combining information from every source could the analyst accurately describe what happened.
SOC Lessons
Remember the core SOC lessons: alerts are starting points, not conclusions; evidence outweighs assumptions; validate telemetry before investigating; think in timelines; correlate multiple sources; and document why you reached your conclusion.
End-of-Chapter Practical Exercise
Prerequisite: Like Hands-On Exercise 2-1, this exercise uses your own laboratory and is intended for completion after Chapter 3 and Lab 0. Students working ahead can answer the observational questions inside the pre-built Vendor Lab 1 environment. Open your Wazuh Dashboard and answer the following questions using your own laboratory.
How many Wazuh Agents are currently connected?
Which operating systems are reporting telemetry?
Generate a PowerShell event on the Windows workstation.
Verify the event appears in Sysmon.
Verify the Wazuh Agent forwards the event.
Locate the event in the Wazuh Dashboard.
Identify the Rule ID.
Determine the alert severity.
Expand the timeline to include events occurring 30 minutes before and after.
Record every additional security event you observe.
Determine whether the activity represents:
An event
An alert
An incident
Write a one-page investigation summary explaining your conclusion and supporting it with evidence from multiple telemetry sources.
Chapter 2 Closing Thoughts
At the beginning of this chapter, you learned that a SIEM is far more than a centralized log repository. By the end of the chapter, you have followed the complete investigative lifecycle:
You understand how telemetry is generated.
You understand how Wazuh collects, normalizes, enriches, and correlates that telemetry.
You understand how rules transform events into alerts.
You understand how analysts investigate alerts using structured methodology.
You understand that evidence—not assumptions—drives professional cybersecurity investigations.
As you move into the next chapter, we leave theory behind and begin building the laboratory itself. Every installation, configuration change, and validation exercise will reinforce the principles established in these opening chapters.
Remember the central philosophy of this textbook:
Observe objectively. Validate continuously. Correlate intelligently. Investigate systematically. These habits—not any particular software product—are what define an effective Security Operations Center analyst.
2.13 Chapter Summary
Throughout this chapter, you learned that a Security Information and Event Management (SIEM) platform is far more than a centralized log repository. Modern organizations generate millions of security events every day from operating systems, network devices, endpoint protection software, cloud platforms, and security monitoring tools. Individually, these systems provide only a partial view of organizational activity. A SIEM combines this information into a single investigative platform.
The chapter began by examining the historical challenges organizations faced before SIEM technology became widely available. Analysts often spent more time locating information than actually investigating incidents. Centralized log collection solved part of this problem, but true operational improvement occurred only when SIEM platforms introduced normalization, correlation, enrichment, and automated detection.
You learned that every security event follows a predictable lifecycle. User activity generates telemetry that is collected by sensors such as Sysmon, Suricata, Windows Defender, and Windows Event Logs. The Wazuh Agent securely forwards this telemetry to the Wazuh Manager, where decoders normalize the data, detection rules evaluate it, and alerts are generated. The Indexer stores the processed information, while the Dashboard provides analysts with a unified investigative interface.
A recurring theme throughout this chapter has been the importance of correlation. Individual events rarely provide sufficient evidence to determine whether malicious activity has occurred. By combining observations from multiple security products and arranging them chronologically, analysts develop a comprehensive understanding of what actually happened.
The chapter also emphasized that professional investigations begin with questions, not conclusions. Analysts collect evidence, test hypotheses, avoid confirmation bias, and document findings. The investigative methodology presented here forms the foundation for every laboratory exercise in the remainder of this textbook.
Finally, you examined Wazuh as an enterprise SIEM platform and learned how mature Security Operations Centers evolve from simple log collection to proactive threat hunting and continuous improvement. The concepts introduced in this chapter will guide every configuration, investigation, and laboratory exercise throughout the remainder of the book.
Chapter 2 Key Terms
| Term | Definition |
|---|---|
| Wazuh Agent | Lightweight software installed on a monitored endpoint that collects local telemetry and forwards it over an encrypted channel to the Wazuh Manager. |
| Alert | An event, or collection of related events, that satisfies detection logic and therefore requires analyst attention. |
| Active Response | A Wazuh capability that automatically executes a predefined action or script — such as blocking an IP address or isolating a host — when a rule of a chosen ID, level, or group fires. |
| Baseline | A documented record of an environment's normal activity, against which anomalies are measured. |
| Correlation | Associating multiple related events — across time, host, user, or network, and often from multiple telemetry sources — into a single coherent picture that identifies meaningful activity. |
| Dashboard | The analyst interface used to search, monitor, and investigate security telemetry. |
| Decoder | A Wazuh Manager component that parses a raw log line and extracts its fields into a structured form before rules evaluate it. |
| Detection Rule | Manager-side logic that evaluates decoded fields and, when its conditions match, assigns a severity level and generates an alert. |
| Enrichment | Adding contextual information to a security event or indicator — such as asset, identity, geolocation, or threat-intel reputation. |
| Extended Detection and Response (XDR) | A platform approach that unifies detection and response across endpoints, networks, and cloud workloads. |
| File Integrity Monitoring (FIM) | Wazuh's syscheck capability: monitoring of specified files and directories that generates an alert when a monitored item is created, modified, or deleted. |
| Event | Any recorded activity generated by a system, application, or device. |
| Indexer | Component responsible for storing and indexing security events. |
| Investigation | The process of collecting evidence to determine whether an incident occurred. |
| Log Normalization | Converting differently-formatted logs into a common structured schema the SIEM can query uniformly. |
| Rule Level | The numeric severity Wazuh assigns to each rule, from 0 (ignored — never alerts) to 15 (severe attack). |
| Rule Tuning | Improving detection quality by reducing false positives and enhancing useful alerts. |
| Security Information and Event Management (SIEM) | A platform that centralizes security telemetry collection, normalization, correlation, analysis, and investigation. |
| Security Telemetry | Security-related data (logs, events, alerts) generated by monitored systems, applications, networks, and security products. |
| Threat Hunting | Proactively searching for evidence of adversary activity that has not generated an automated alert. |
| Wazuh Manager | The central Wazuh server component that receives agent data, applies decoders and rules, generates alerts, and coordinates the platform. |
Key Takeaways
By the end of this chapter, you should understand the following principles:
✓ SIEM platforms collect data—they do not replace investigators. ✓ Every alert begins as telemetry. ✓ Events become alerts through detection rules. ✓ Correlation transforms individual observations into meaningful investigations. ✓ Dashboards support investigations but do not perform them. ✓ Analysts investigate timelines rather than isolated events. ✓ Evidence—not assumptions—drives professional cybersecurity investigations. ✓ Continuous improvement is the hallmark of a mature Security Operations Center.
Knowledge Check
1. What primary problem was SIEM technology designed to solve?
A. Antivirus deployment
B. Firewall management
C. Password management
D. Centralized collection and investigation of security telemetry
2. Which Wazuh component stores indexed security data?
A. Indexer
B. Agent
C. Dashboard
D. Decoder
3. Which component collects telemetry from monitored systems?
A. Dashboard
B. Indexer
C. Wazuh Agent
D. Decoder
4. Which process converts different vendor log formats into common searchable fields?
A. Encryption
B. Normalization
C. Compression
D. Replication
5. Correlation primarily helps analysts by:
A. Combining related events into meaningful investigations
B. Deleting duplicate logs
C. Encrypting telemetry
D. Reducing storage requirements
6. Which statement best describes a detection rule?
A. A Windows Event Log
B. A firewall policy
C. A malware signature database
D. Logic that evaluates events and determines whether an alert should be generated
7. Which component presents information to the analyst?
A. Manager
B. Dashboard
C. Agent
D. Decoder
8. Which statement represents good investigative practice?
A. Trust every alert immediately. B. Begin with conclusions. C. Collect evidence before reaching conclusions. D. Investigate only the triggering event.
9. What should an analyst verify before beginning an investigation?
A. Windows Updates
B. Browser history
C. User passwords
D. Telemetry and monitoring infrastructure
10. Which of the following best describes SIEM maturity?
A. Continuous improvement of people, processes, and technology
B. Purchasing additional hardware
C. Installing more antivirus software
D. Increasing log retention
11. In Wazuh, what does a rule level of 0 indicate?
A. The most severe possible attack
B. A rule that matched but is intentionally ignored, generating no alert
C. A rule that failed to load
D. An event from a disconnected agent
Chapter Discussion Questions
Why is centralized visibility essential for modern Security Operations Centers?
Explain why a SIEM is only as effective as the telemetry it receives.
Describe the complete lifecycle of an event from endpoint to analyst.
Why is correlation more valuable than examining isolated events?
Explain the relationship between Sysmon, Suricata, Windows Defender, and Wazuh.
Why is normalization necessary in heterogeneous environments?
How does rule tuning improve analyst productivity?
Explain the difference between monitoring and investigation.
Why should analysts avoid confirmation bias?
Describe how a mature SOC continuously improves its detection capabilities.
Explain how Wazuh rule levels help an analyst prioritize alerts, and why a level-0 rule can still be operationally useful.
A Note on the Labs Ahead
Two kinds of laboratory exercises accompany this textbook, and both reinforce the concepts in this chapter. Vendor Labs 1–4 are guided exercises hosted in a pre-built cloud environment; they require no local build and can be completed as soon as you finish this chapter. Lab 1 (SIEM Familiarization) and Lab 2 (Configuration and Attack Analysis) map directly onto Sections 2.1–2.9—dashboard navigation, the wazuh-alerts-* index in Discover, rule groups, and time-based analysis—while Lab 3 (Analyst Use-Case Walkthrough) and Lab 4 (Ransomware) exercise the correlation, baseline, FIM, and Active Response concepts introduced here. The Hands-On Exercise below, by contrast, uses your own laboratory and should be completed after you build it in Chapter 3 and validate it with Lab 0.
Chapter Exercise 2.1 — Exploring the Wazuh Dashboard
Prerequisite: This exercise requires your own Wazuh Server, Windows endpoint, and Ubuntu sensor. Complete it after Chapter 3 and Lab 0. If you have not yet built the laboratory, perform the equivalent navigation inside the pre-built Vendor Lab 1 environment instead.
Estimated Time: 45–60 minutes
Learning Objectives
By the end of this lab, students will be able to:
Navigate the Wazuh Dashboard.
Identify the major Dashboard components.
Locate connected agents.
Perform basic searches.
Filter alerts by severity.
Expand investigation timelines.
Identify the telemetry source of an alert.
Student Tasks
Log into the Wazuh Dashboard.
Identify all connected agents.
Record the operating system for each agent.
Locate the Security Events module.
Filter alerts to Last 24 Hours.
Record:
Total alerts
Critical alerts
High alerts
Medium alerts
Search for:
Your Windows workstation
Your Ubuntu sensor
Locate a Suricata alert.
Locate a Sysmon event.
Compare the fields available in both event types.
Expand the time range by 30 minutes.
Record any additional related events.
Worked Exercise
Have students perform the following live:
Generate a Sysmon Event ID 1 (PowerShell).
Generate a Sysmon Event ID 22 (DNS).
Generate a Suricata Port Scan alert.
Generate an EICAR detection.
Trace each event through the Wazuh Dashboard.
This exercise reinforces the complete telemetry pipeline introduced in Chapters 1 and 2.
Preparing for Chapter 3
In the next chapter, students transition from theory to implementation. Rather than discussing architecture conceptually, they will begin constructing the laboratory used throughout the remainder of the textbook.
Chapter 3 begins with:
Building the Security Operations Center Laboratory
Students will learn to:
Understand the complete lab topology.
Install and validate the Wazuh Server.
Configure Ubuntu 26.04.
Install Wazuh Agents.
Configure Windows 11.
Install and validate Sysmon.
Deploy Suricata.
Configure Emerging Threats Open rules.
Validate the complete telemetry pipeline.
Further Resources
Wazuh — Architecture (https://documentation.wazuh.com/current/getting-started/architecture.html) — How Agents, Manager, Indexer, and Dashboard interconnect.
Wazuh — User Manual: Ruleset (https://documentation.wazuh.com/current/user-manual/ruleset/index.html) — How decoders and rules turn raw logs into alerts.
Wazuh — Rules Classification (https://documentation.wazuh.com/current/user-manual/ruleset/rules/rules-classification.html) — The 0–15 rule level scale referenced in Section 2.5.
NIST SP 800-92 — Guide to Computer Security Log Management (https://csrc.nist.gov/pubs/sp/800/92/final) — The foundational guidance behind enterprise log collection.
Sysmon (Microsoft Learn) (https://learn.microsoft.com/en-us/sysinternals/downloads/sysmon) — Event IDs and configuration reference for endpoint telemetry.