
Purpose
This appendix provides step-by-step instructions for building the laboratory environment used throughout this textbook.
By completing this appendix, you will have a fully functional Security Operations Center (SOC) consisting of:
- Wazuh Server
- Windows 11 Endpoint
- Ubuntu 26.04 Sensor
- Security Onion 14.04.5.2 (hostname
SO14) - Sysmon
- Suricata
- Wazuh Agents
Every lab in this textbook assumes this environment has been successfully deployed.
Estimated Build Time
| Experience | Estimated Time |
|---|---|
| Beginner | 6–8 hours |
| Intermediate | 4–6 hours |
| Experienced | 2–4 hours |
Learning Objectives
After completing this appendix, you will be able to:
- Build a multi-system cybersecurity lab.
- Install Wazuh.
- Deploy Windows and Linux agents.
- Install Sysmon.
- Install Suricata.
- Verify security telemetry.
- Validate communication between all systems.
- Troubleshoot common installation problems.
A.1 Laboratory Architecture
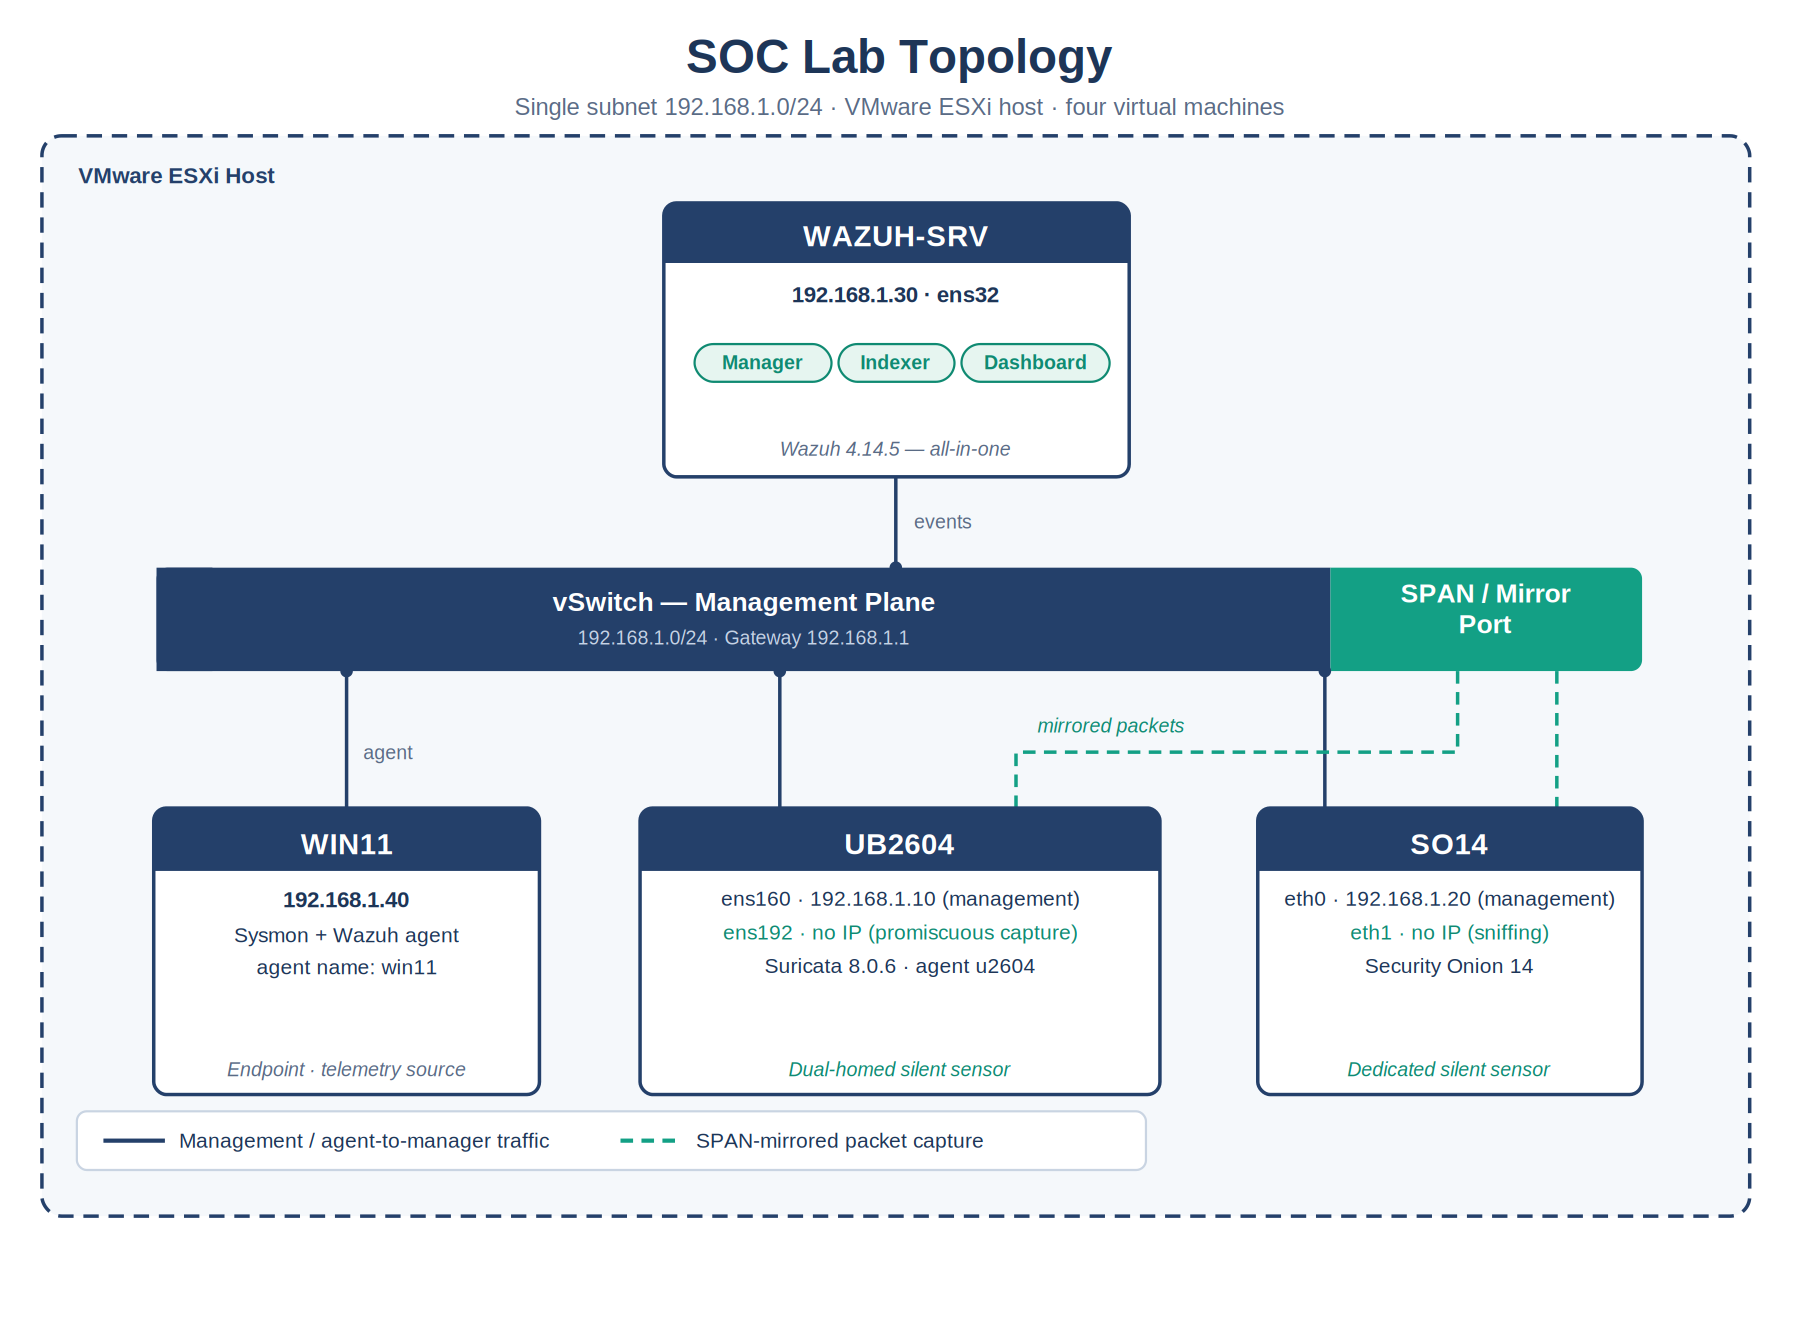
The laboratory consists of four virtual machines connected to the same virtual network.
| System | Hostname | Agent Name | IP Address | Purpose |
|---|---|---|---|---|
| Wazuh Server (Amazon Linux 2023) | WAZUH-SRV | — | 192.168.1.30 | SIEM Platform (Manager, Indexer, Dashboard) |
| Security Onion 14.04.5.2 | SO14 | — | 192.168.1.20 (eth0); eth1 no IP (sniffing) | Network Security Monitoring |
| Ubuntu 26.04 | UB2604 | u2604 | 192.168.1.10 (ens160); no IP (ens192) | Suricata Sensor / Wazuh Agent |
| Windows 11 Pro | WIN11 | win11 | 192.168.1.40 | Endpoint Monitoring |
Hostnames are uppercase (WAZUH-SRV, UB2604, WIN11, SO14); Wazuh agent names are lowercase (u2604, win11) and are set at enrollment. Because Dashboard queries are case-sensitive, this distinction matters whenever you search for events. The Ubuntu sensor carries two interfaces — ens160 (192.168.1.10, management) and ens192 (no IP, promiscuous capture) — the silent sensor design; Security Onion’s eth1 uses the same design. Both are introduced in Chapter 1 and configured later in this appendix.
Network Diagram
Enterprise SOC Laboratory — 192.168.1.0/24Figure A-1
Enterprise SOC Laboratory Topology
A.2 Hardware Requirements
Minimum
| Resource | Requirement |
|---|---|
| CPU | Quad Core (Intel i5 / Ryzen 5) |
| Memory | 32 GB RAM |
| Storage | 500 GB SSD |
| Virtualization | Intel VT-x / AMD-V Enabled |
Recommended
| Resource | Requirement |
|---|---|
| CPU | 8 Cores or Greater |
| Memory | 64 GB RAM |
| Storage | 1 TB NVMe SSD |
| Network | Gigabit Ethernet |
A.3 Software Requirements
Download the following software before beginning.
| Software | Version |
|---|---|
| VMware Workstation Pro | Current Release |
| Ubuntu Desktop | 26.04 LTS |
| Windows 11 Pro | Current Release |
| Security Onion | 14 |
| Wazuh | 4.14.5 |
| Sysmon | Current Release |
| Suricata | Current Release |
| PowerShell 7 | Current Release |
A.4 Before You Begin
Verify the following before starting.
□ VMware installs successfully.
□ Virtualization is enabled in BIOS.
□ Internet access is available.
□ Minimum hardware requirements are met.
□ All installation media has been downloaded.
A.5 Create the Virtual Machines
Create the following virtual machines before installing any operating systems.
| VM | vCPU | RAM | Disk |
|---|---|---|---|
| Wazuh Server | 4 | 12 GB | 150 GB |
| Security Onion | 4 | 8 GB | 200 GB |
| Ubuntu Sensor | 2 | 4 GB | 60 GB |
| Windows 11 | 4 | 8 GB | 100 GB |
Validation
Verify all four virtual machines exist before proceeding.
Your VMware inventory should contain:
□ Wazuh Server
□ Security Onion
□ Ubuntu Sensor
□ Windows 11
If all four virtual machines have been created, continue to the next section.
A.6 Configure Virtual Networking
Configure every virtual machine to use the same virtual network.
Example:
| VM | Network Adapter |
|---|---|
| Wazuh | VMnet2 |
| Security Onion | VMnet2 |
| Ubuntu | VMnet2 |
| Windows | VMnet2 |
Use Bridged or a dedicated Custom VMnet depending on your lab design. All systems must be able to communicate with each other.
Validation
After all operating systems have been installed, verify connectivity.
From each Linux system:
VMware host · Terminal
ping 192.168.1.30Expected result:
VMware host · Expected output
64 bytes from 192.168.1.30icmp_seq=1 ttl=64 time=0.4 ms
Repeat for each system until all hosts respond successfully.
End of Section Checklist
Before continuing, verify:
✓ Four virtual machines created
✓ Hardware resources assigned
✓ Virtual networking configured
✓ Installation media available
✓ All systems connected to the same virtual network
Next Section
A.7 Installing Ubuntu 26.04 LTS
Objective
Install Ubuntu Desktop 26.04 LTS and configure it for use as the Suricata sensor and Wazuh agent.
Estimated Time
30–45 minutes
Before You Begin
Verify:
- Ubuntu 26.04 ISO downloaded
- Ubuntu virtual machine created
- VM has at least:
- 2 vCPUs
- 4 GB RAM
- 60 GB virtual disk
- Network adapter connected
Step 1 — Power On the Virtual Machine
- Open VMware Workstation.
- Select Ubuntu Sensor.
- Click Power on this virtual machine.
The Ubuntu installer should start.
Step 2 — Begin Installation
Select:
Install Ubuntu
Click Next.
Step 3 — Keyboard Layout
Select your preferred keyboard layout.
Example:
English (US)
Click Continue.
Step 4 — Connect to the Network
If prompted, connect to your network.
If using DHCP, Ubuntu should automatically obtain an IP address.
Step 5 — Installation Type
Select:
Normal Installation
Enable:
✓ Download updates while installing Ubuntu
✓ Install third-party software
Click Continue.
Step 6 — Disk Configuration
Select:
Erase disk and install Ubuntu
Note: This erases only the virtual disk attached to the VM. It does not affect your physical computer.
Click Install Now.
Click Continue when prompted.
Step 7 — Time Zone
Select your time zone.
Example:
America/Detroit
Click Continue.
Step 8 — Create the User Account
Use the following values throughout this textbook.
| Setting | Value |
|---|---|
| Your Name | Student |
| Computer Name | UB2604 |
| Username | student |
| Password | Choose a strong password |
Record your password. You will need it throughout the labs.
Click Continue.
Step 9 — Complete Installation
The installation typically requires 10–20 minutes.
When prompted, select:
Restart Now
Remove the ISO if VMware prompts you.
Step 10 — Log In
Log in using the account created during installation.
The Ubuntu desktop should appear.
Step 11 — Open Terminal
Select:
Applications → Terminal
You should see a prompt similar to:
student@UB2604:~$
Step 12 — Update Ubuntu
Run:
Ubuntu VM · Terminal
sudo apt updateEnter your password when prompted.
Expected output:
Ubuntu VM · Expected output
Reading package lists... Done
Building dependency tree... Done
Next, upgrade installed packages.
Ubuntu VM · Terminal
sudo apt upgrade -yDepending on your Internet connection, this may take several minutes.
Step 13 — Verify the Ubuntu Version
Run:
Ubuntu VM · Terminal
lsb_release -aExpected output:
Distributor ID: Ubuntu
Description: Ubuntu 26.04 LTS Release: 26.04
Step 14 — Verify the Hostname
Run:
Ubuntu VM · Terminal
hostnamectlExpected output should include:
Static hostname: UB2604
Operating System: Ubuntu 26.04 LTS
If the hostname is different, change it.
Example:
Ubuntu VM · Terminal
sudo hostnamectl set-hostname UB2604Verify again.
Step 15 — Verify the IP Address
Run:
Ubuntu VM · Terminal
ip addr showLocate your primary network interface.
Example:
inet 192.168.1.10/24
Record this address.
You will use it later when installing the Wazuh Agent.
Step 16 — Test Network Connectivity
Verify Internet connectivity.
Ubuntu VM · Terminal
ping -c 4 google.comExpected output:
Ubuntu VM · Expected output
4 packets transmitted4 received
0% packet loss
Next, verify communication with the Wazuh server (after it has been installed).
Ubuntu VM · Terminal
ping -c 4 192.168.1.30Expected output:
Ubuntu VM · Expected output
64 bytes from 192.168.1.30If the Wazuh server has not yet been installed, you can skip this step and return to it later.
Validation Checklist
Verify the following before continuing.
✓ Ubuntu installs successfully.
✓ You can log in.
✓ Terminal opens.
✓ sudo works.
✓ Ubuntu updates successfully.
✓ Hostname is UB2604.
✓ IP address is assigned.
✓ Internet connectivity is available.
Troubleshooting
| Problem | Solution |
|---|---|
| No IP address | Verify the VM network adapter is connected and configured correctly. |
| Cannot reach the Internet | Check VMware networking and confirm the virtual switch is functioning. |
| sudo command fails | Verify you are logged in with the account created during installation. |
| Hostname incorrect | Run sudo hostnamectl set-hostname UB2604 and reboot if necessary. |
| Updates fail | Verify DNS resolution and Internet connectivity, then rerun sudo apt update. |
Section Summary
You have successfully:
- Installed Ubuntu 26.04 LTS
- Created a local administrator account
- Updated the operating system
- Verified the hostname
- Verified the network configuration
- Confirmed Internet connectivity
The Ubuntu system is now ready for the installation of the Wazuh Agent and Suricata.
Next Section
A.8 Installing the Wazuh Server
Objective
Install the Wazuh Server, Indexer, and Dashboard on a single Ubuntu server.
Estimated Time
45–60 minutes
Before You Begin
Verify:
- Ubuntu Server is installed.
- Static IP address configured.
- Internet connectivity available.
- Minimum 12 GB RAM.
- At least 150 GB free disk space.
Step 1 — Update Ubuntu
Log in to the Wazuh server.
Update the operating system.
WAZUH-SRV · Terminal
sudo apt update
sudo apt upgrade -y
When complete, reboot if prompted.
WAZUH-SRV · Terminal
sudo rebootStep 2 — Verify the Hostname
Verify the hostname.
WAZUH-SRV · Terminal
hostnamectlExpected output:
Static hostname: WAZUH-SRV
Operating System: Ubuntu 26.04 LTS
If necessary, change it.
WAZUH-SRV · Terminal
sudo hostnamectl set-hostname WAZUH-SRVStep 3 — Verify the IP Address
Run:
WAZUH-SRV · Terminal
ip addr showExample:
inet 192.168.1.30/24
Record this address.
Step 4 — Download the Wazuh Installer
Download the installation assistant.
WAZUH-SRV · Terminal
curl -sO https://packages.wazuh.com/4.14/wazuh-install.shMake the script executable.
WAZUH-SRV · Terminal
chmod +x wazuh-install.shStep 5 — Install Wazuh
Run the installer.
WAZUH-SRV · Terminal
sudo ./wazuh-install.sh -aThis installs:
- Wazuh Manager
- Wazuh Indexer
- Wazuh Dashboard
- Filebeat
- Required certificates
The installation typically requires 20–40 minutes.
Step 6 — Save the Administrator Password
Near the end of the installation, the installer displays the administrator password.
Example:
User: admin
Password: xxxxxxxxxxxxxxxx
Record this password.
You will need it to log in to the dashboard.
Step 7 — Verify the Services
Check the Wazuh Manager.
WAZUH-SRV · Terminal
sudo systemctl status wazuh-managerExpected:
Active: active (running)
Check the Indexer.
WAZUH-SRV · Terminal
sudo systemctl status wazuh-indexerExpected:
Active: active (running)
Check the Dashboard.
WAZUH-SRV · Terminal
sudo systemctl status wazuh-dashboardExpected:
Active: active (running)
Step 8 — Verify Listening Ports
Run:
Wazuh Dashboard · Discover query
sudo ss -tulnpExpected ports include:
| Port | Service |
|---|---|
| 443 | Dashboard |
| 1514 | Wazuh Agent Communication |
| 1515 | Agent Registration |
| 55000 | Wazuh API |
| 9200* | Indexer (internal use) |
*Port availability may vary depending on the installation and security configuration.
Step 9 — Open the Dashboard
From your Windows 11 workstation, open a web browser.
Browse to:
Replace the IP address with your server’s address if different.
Ignore the browser certificate warning.
Select Advanced and continue to the site.
Step 10 — Log In
Username:
admin
Password:
Use the password displayed during installation.
The Wazuh Dashboard should open.
Step 11 — Verify the Dashboard
Confirm the Dashboard loads successfully.
You should see:
- Overview page
- Menu on the left
- Wazuh application
- No connected agents (yet)
At this point the environment is operating correctly.
Validation Checklist
Verify:
✓ Wazuh Manager running
✓ Wazuh Indexer running
✓ Wazuh Dashboard running
✓ Dashboard opens in a browser
✓ Administrator login successful
✓ No service errors reported
Troubleshooting
| Problem | Solution |
|---|---|
| Dashboard will not open | Verify the wazuh-dashboard service is running and check firewall settings. |
| Login fails | Confirm you are using the password displayed during installation. |
| Manager service not running | Review the service status with sudo systemctl status wazuh-manager and inspect the logs. |
| Installer fails | Verify Internet connectivity and ensure the script completed without errors. |
| Browser certificate warning | This is expected when using the default self-signed certificate in a lab environment. |
Section Summary
You have successfully:
- Installed the Wazuh platform
- Installed the Indexer
- Installed the Dashboard
- Verified all services
- Accessed the Wazuh web interface
The Wazuh server is now ready to receive endpoint agents.
A.8a Installing the Wazuh Agent on Ubuntu 26.04
Objective
Install and register the Wazuh Agent on the Ubuntu sensor so it reports as a monitored Linux endpoint, in addition to the network-sensor role it will take on in Section A.12. This step must be completed before Section A.13, which assumes the Ubuntu agent is already installed and connected.
Estimated Time
10–15 minutes
Step 1 — Import the Wazuh GPG Key and Repository
On the Ubuntu machine, add the official Wazuh package signing key and repository:
UB2604 · Terminal
curl -s https://packages.wazuh.com/key/GPG-KEY-WAZUH | sudo gpg --no-default-keyring --keyring gnupg-ring:/usr/share/keyrings/wazuh.gpg --import
sudo chmod 644 /usr/share/keyrings/wazuh.gpg
UB2604 · Terminal
echo "deb [signed-by=/usr/share/keyrings/wazuh.gpg] https://packages.wazuh.com/4.x/apt/ stable main" | sudo tee /etc/apt/sources.list.d/wazuh.listUB2604 · Terminal
sudo apt-get updateStep 2 — Install the Agent, Registering the Manager
Set the WAZUH_MANAGER environment variable to the Wazuh Server’s IP address and install the package in the same command:
UB2604 · Terminal
sudo WAZUH_MANAGER="192.168.1.30" WAZUH_AGENT_NAME="u2604" apt-get install -y wazuh-agentStep 3 — Enable and Start the Agent
UB2604 · Terminal
sudo systemctl daemon-reload
sudo systemctl enable wazuh-agent
sudo systemctl start wazuh-agent
Step 4 — Verify the Agent Service
UB2604 · Terminal
sudo systemctl status wazuh-agentExpected:
Active: active (running)
Step 5 — Verify Registration in the Dashboard
Open the Wazuh Dashboard and navigate to Wazuh → Agents. Confirm that the agent u2604 appears with status Active.
If the agent does not appear, verify network connectivity to the Wazuh Server on TCP 1514 and 1515 before continuing:
nc -vz 192.168.1.30 1514
nc -vz 192.168.1.30 1515
Best Practice
If WAZUH_MANAGER was set incorrectly or omitted during installation, do not reinstall the package. Instead, edit the
field inside /var/ossec/etc/ossec.conf directly and restart the agent with sudo systemctl restart wazuh-agent.Next Section
A.9 Installing the Wazuh Agent on Windows 11
Objective
Install the Wazuh Agent on the Windows 11 workstation and verify communication with the Wazuh Server.
Estimated Time
20–30 minutes
Before You Begin
Verify:
- Windows 11 is installed.
- Wazuh Server is running.
- Dashboard is accessible.
- Windows can communicate with the Wazuh Server.
- You are logged in as a local administrator.
Step 1 — Open the Wazuh Dashboard
From the Windows 11 computer, open a web browser.
Browse to:
Log in using the administrator account.
Step 2 — Open the Agent Deployment Wizard
From the Dashboard:
- Select Wazuh.
- Select Agents.
- Click Deploy new agent.
The deployment wizard opens.
Step 3 — Configure the Agent
Select the following:
| Setting | Value |
|---|---|
| Operating System | Windows |
| Wazuh Server Address | 192.168.1.30 |
| Group | default |
The wizard generates a PowerShell installation command.
Step 4 — Copy the Installation Command
The generated command will look similar to:
WIN11 · PowerShell
Invoke-WebRequest -Uri https://packages.wazuh.com/4.x/windows/wazuh-agent-4.14.5-1.msi -OutFile $env:tmp\wazuh-agent.msi
msiexec.exe /i $env:tmp\wazuh-agent.msi /q WAZUH_MANAGER="192.168.1.30" WAZUH_AGENT_NAME="win11"
NET START WazuhSvc
Note: The exact version number may differ. Always use the command generated by your Wazuh Dashboard.
Step 5 — Open PowerShell
Right-click PowerShell.
Select:
Run as Administrator
Step 6 — Install the Agent
Paste the command copied from the Dashboard.
Press Enter.
The installation may take several minutes.
Step 7 — Verify the Service
Run:
WIN11 · PowerShell (Administrator)
Get-Service WazuhSvcExpected output:
WIN11 · PowerShell
Status Name DisplayName
Running WazuhSvc Wazuh Agent
If the service is not running, start it.
WIN11 · PowerShell
Start-Service WazuhSvcStep 8 — Verify the Agent Locally
Run:
WIN11 · PowerShell
& "C:\Program Files (x86)\ossec-agent\agent-auth.exe" -VExpected output:
WIN11 · Expected output
Wazuh Agent 4.x.xStep 9 – Verify the Agent in the Dashboard
Return to the Dashboard.
Select:
Wazuh → Agents
Within one to two minutes, the Windows system should appear.
Example:
| Name | Status |
|---|---|
| win11 | Active |
Step 10 — Verify Agent Details
Click the Windows agent.
Verify:
- Status: Active
- Operating System: Windows 11
- IP Address: 192.168.1.40
- Last Keep Alive: Current
Step 11 — Generate a Test Event
Open Command Prompt.
Run:
hostname
Although this command may not generate a security alert, it confirms the endpoint is operational and communicating with the manager.
Later chapters will configure additional telemetry such as Sysmon.
Validation Checklist
Verify:
✓ Windows Agent installed
✓ Wazuh service running
✓ Agent appears in Dashboard
✓ Agent status is Active
✓ Hostname displayed correctly
✓ IP address displayed correctly
Troubleshooting
| Problem | Solution |
|---|---|
| Agent does not appear | Verify the server IP entered during installation. |
| Service will not start | Restart Windows and try again. Check Windows Event Viewer for service errors. |
| Agent status is “Disconnected” | Verify the Wazuh Manager is running and confirm network connectivity. |
| Installation fails | Run PowerShell as Administrator and verify the downloaded MSI is not blocked. |
| Firewall blocks communication | Allow outbound connections to the Wazuh Manager on port 1514/TCP. |
Section Summary
You have successfully:
- Installed the Windows Wazuh Agent
- Connected the agent to the Wazuh Server
- Verified communication with the Dashboard
- Confirmed the endpoint is ready for telemetry collection
At this stage, the Wazuh infrastructure is operational. The next step is to install Sysmon, which provides the detailed Windows event telemetry used throughout the remainder of this textbook.
Next Section
A.10 Installing and Configuring Sysmon
Objective
Install Sysmon on Windows 11 using the SwiftOnSecurity Sysmon configuration and verify that it is generating the security events used throughout this textbook.
The SwiftOnSecurity configuration is a widely used community-maintained configuration that balances useful security visibility with manageable event volume. Throughout this textbook, it provides the telemetry used for Detection Engineering, Threat Hunting, Digital Forensics, and Incident Response.
Estimated Time
20–30 minutes
Before You Begin
Verify:
- Windows 11 is running.
- The Wazuh Agent is installed and connected.
- You are logged in as a local administrator.
- Internet connectivity is available.
Step 1 — Download Sysmon
Download Sysmon from the Microsoft Sysinternals website.
Create C:\Sysmon, then extract the ZIP file to:
C:\Sysmon
The folder should contain files similar to:
Sysmon.exe
Sysmon64.exe Eula.txt
Step 2 — Download the SwiftOnSecurity Configuration
Download the latest Sysmon configuration from:
https://github.com/SwiftOnSecurity/sysmon-config/blob/master/sysmonconfig-export.xml
Save the configuration file as:
WIN11 · PowerShell
C:\Sysmon\sysmonconfig-export.xmlThe C:\Sysmon folder should now contain Sysmon64.exe and sysmonconfig-export.xml.
Step 3 — Open PowerShell
Right-click PowerShell and select:
Run as Administrator
Change to the Sysmon directory.
WIN11 · PowerShell
Set-Location C:\Sysmon
Get-ChildItem
Verify the files exist.
dir
Expected output:
WIN11 · PowerShell
Directory: C:\SysmonSysmon64.exe sysmonconfig-export.xml
Step 4 — Install Sysmon
Run:
WIN11 · PowerShell
.\Sysmon64.exe -accepteula -i .\sysmonconfig-export.xmlExpected output:
WIN11 · PowerShell
System Monitor installed.
System Monitor configuration updated.
Step 5 — Verify the Service
Run:
WIN11 · PowerShell
Get-Service Sysmon64Expected output:
WIN11 · PowerShell
Status Name DisplayName
Running Sysmon64 Sysmon64
Step 6 — Verify the Configuration
Display the active configuration.
WIN11 · PowerShell
.\Sysmon64.exe -cExpected output begins with:
System Monitor configuration:
This confirms that the XML configuration was successfully loaded.
Step 7 — Verify the Driver
Run:
driverquery | findstr Sysmon
Expected output:
WIN11 · PowerShell
SysmonDrvStep 8 — Verify Event Logging
Open Event Viewer.
Navigate to:
Applications and Services Logs
Microsoft Windows
Sysmon Operational
The Operational log should already contain several events.
Step 9 — Generate Test Events
Generate a Process Creation event.
Open Command Prompt and run:
notepad
Close Notepad.
This generates Sysmon Event ID 1.
Generate a DNS Query event.
Open PowerShell and run:
WIN11 · PowerShell
Resolve-DnsName www.microsoft.comThis generates Sysmon Event ID 22.
Generate a Network Connection event.
Open PowerShell and run:
WIN11 · PowerShell
Invoke-WebRequest https://www.microsoft.comThis generates Sysmon Event ID 3.
Step 10 — Verify the Required Event IDs
Return to the Sysmon Operational log.
Verify that the following events appear.
| Event ID | Description |
|---|---|
| 1 | Process Creation |
| 3 | Network Connection |
| 11 | File Creation |
| 22 | DNS Query |
Note: Event ID 8 (CreateRemoteThread) is included in the configuration but is generated only by specific software behaviors. It may not appear during normal operation.
Step 11 — Verify Sysmon Events in Wazuh
Open the Wazuh Dashboard.
Navigate to:
Security Events
Filter on the Windows agent.
Within one to two minutes, Sysmon events should begin appearing.
Verify that at least the following events are received:
- Event ID 1
- Event ID 3
- Event ID 22
Validation Checklist
Verify:
✓ Sysmon installed successfully
✓ Sysmon service running
✓ SwiftOnSecurity configuration loaded
✓ Event ID 1 generated
✓ Event ID 3 generated
✓ Event ID 22 generated
✓ Events visible in Event Viewer
✓ Events forwarded to Wazuh
Troubleshooting
| Problem | Solution |
|---|---|
| Sysmon service not running | Reinstall Sysmon using the installation command. |
| Configuration not loaded | Verify sysmonconfig-export.xml is in C:\Sysmon\ and rerun the installation command. |
| Event ID 22 missing | Confirm Internet connectivity and rerun Resolve-DnsName. |
| No events in Wazuh | Verify the Wazuh Agent is configured to collect the Microsoft-Windows-Sysmon/Operational event log (Section A.11). |
| Installation reports an error | Ensure PowerShell is running as Administrator. |
Section Summary
You have successfully:
- Downloaded Sysmon from Microsoft Sysinternals.
- Downloaded the official SwiftOnSecurity Sysmon configuration.
- Installed Sysmon.
- Loaded the SwiftOnSecurity configuration.
- Verified Process Creation, Network Connection, and DNS Query events.
- Confirmed that Sysmon telemetry is available for collection by the Wazuh Agent.
The Windows endpoint is now generating the endpoint telemetry used throughout the Detection Engineering, Threat Hunting, Digital Forensics, and Incident Response labs later in this textbook.
Tip: Rather than saving from the GitHub blob (web) page, download the Raw version of the XML file directly. GitHub occasionally changes its page layout, but the repository location remains stable, and using the Raw file avoids accidentally saving the HTML page instead of the configuration. The raw URL for the SwiftOnSecurity configuration is https://raw.githubusercontent.com/SwiftOnSecurity/sysmon-config/master/sysmonconfig-export.xml.
A.11 Configuring the Wazuh Agent to Collect Sysmon Events
Objective
Configure the Windows Wazuh Agent to collect the Microsoft-Windows-Sysmon/Operational event log and verify that Sysmon events are forwarded to the Wazuh Server.
Estimated Time
15–20 minutes
Before You Begin
Verify the following:
- The Wazuh Agent is installed and connected.
- Sysmon is installed using the SwiftOnSecurity configuration (Section A.10).
- The Wazuh Dashboard is accessible.
- You are logged into Windows as a local administrator.
Step 1 — Verify Sysmon Is Logging Events
Before configuring Wazuh, confirm that Sysmon is generating events locally.
Open Event Viewer.
Navigate to:
Applications and Services Logs
Microsoft Windows
Sysmon Operational
You should already see multiple Sysmon events.
If no events are present, return to Section A.10 before continuing.
Step 2 — Locate the Wazuh Configuration File
Open File Explorer.
Navigate to:
WIN11 · PowerShell
C:\Program Files (x86)\ossec-agent\Locate:
ossec.conf
Step 3 — Edit ossec.conf
Open Notepad as Administrator.
Open:
WIN11 · PowerShell (Administrator)
C:\Program Files (x86)\ossec-agent\ossec.confLocate the existing entries.
Add the following block if it does not already exist.
WIN11 · PowerShell (Administrator)
<localfile>
  <location>Microsoft-Windows-Sysmon/Operational</location>
  <log_format>eventchannel</log_format>
</localfile>

<localfile>
  <location>Microsoft-Windows-Windows Defender/Operational</location>
  <log_format>eventchannel</log_format>
</localfile>
Save the file.
Important
Only one Sysmon entry should exist. Duplicate entries may result in duplicate events.
Step 4 — Restart the Wazuh Agent
Open PowerShell as Administrator.
Restart the agent.
WIN11 · PowerShell (Administrator)
Restart-Service WazuhSvcWait approximately 30 seconds.
Step 5 — Verify the Agent Service
Run:
WIN11 · PowerShell (Administrator)
Get-Service WazuhSvcExpected output:
WIN11 · PowerShell
Status Name DisplayName
Running WazuhSvc Wazuh Agent
Step 6 — Generate New Sysmon Events
Generate several new events so Wazuh has fresh telemetry to collect.
Process Creation (Event ID 1)
Open Command Prompt.
Run:
notepad
Close Notepad.
DNS Query (Event ID 22)
Open PowerShell.
Run:
WIN11 · PowerShell
Resolve-DnsName www.microsoft.comNetwork Connection (Event ID 3)
Run:
WIN11 · PowerShell
Invoke-WebRequest https://www.microsoft.comStep 7 — Verify Events in Event Viewer
Return to:
Applications and Services Logs
Microsoft Windows
Sysmon Operational
Verify that the following events appear:
| Event ID | Description |
|---|---|
| 1 | Process Creation |
| 3 | Network Connection |
| 22 | DNS Query |
These events confirm that Sysmon is functioning correctly.
Step 8 – Verify Events in the Wazuh Dashboard
Log in to the Wazuh Dashboard.
Navigate to:
Security Events
Filter on the Windows agent.
Within one to two minutes you should see Sysmon events similar to:
| Event ID | Description |
|---|---|
| 1 | Process Creation |
| 3 | Network Connection |
| 22 | DNS Query |
Step 9 — Inspect an Event
Open one of the Event ID 1 entries.
Verify fields similar to:
Event ID: 1
Image: C:\Windows\System32\WindowsPowerShell\v1.0\powershell.exe
Parent Image: C:\Windows\System32\cmd.exe
User: WIN11
Open an Event ID 22 entry.
Verify fields similar to:
Query Name:
Image: powershell.exe
Validation Checklist
Verify:
✓ Sysmon Operational log contains events
✓ Wazuh Agent restarted successfully
✓ Event ID 1 visible in Event Viewer
✓ Event ID 3 visible in Event Viewer
✓ Event ID 22 visible in Event Viewer
✓ Event ID 1 visible in Wazuh
✓ Event ID 3 visible in Wazuh
✓ Event ID 22 visible in Wazuh
Troubleshooting
| Problem | Possible Cause | Solution |
|---|---|---|
| No Sysmon events in Event Viewer | Sysmon not installed or configuration not loaded | Repeat Section A.10 and verify Sysmon64.exe -c. |
| Events appear in Event Viewer but not Wazuh | Wazuh Agent not collecting the Sysmon log | Verify the entry in ossec.conf and restart the agent. |
| Wazuh Agent service will not start | Configuration error in ossec.conf | Check the XML syntax and correct any errors. |
| Duplicate Sysmon alerts | Multiple Sysmon entries | Remove duplicate entries and restart the agent. |
| Event ID 22 not generated | No DNS query performed | Run Resolve-DnsName www.microsoft.com again. |
| Event ID 3 not generated | No outbound network connection | Run Invoke-WebRequest https://www.microsoft.com again. |
Section Summary
You have successfully:
- Verified that Sysmon is generating events locally.
- Configured the Wazuh Agent to collect the Sysmon Operational event log.
- Restarted the Wazuh Agent.
- Verified Process Creation (Event ID 1), Network Connection (Event ID 3), and DNS Query (Event ID 22) events in both Event Viewer and the Wazuh Dashboard.
Your Windows endpoint is now fully configured for the Detection Engineering, Threat Hunting, Digital Forensics, and Incident Response labs presented throughout the remainder of this textbook.
Implementation Tip
Before moving to the Suricata installation, have students demonstrate all three event types in the Wazuh Dashboard:
- Event ID 1 – Process Creation (notepad.exe)
- Event ID 3 – Network Connection (Invoke-WebRequest)
- Event ID 22 – DNS Query (Resolve-DnsName)
If these three events are visible in Wazuh, the endpoint telemetry is correctly configured and the class is ready to proceed to the network monitoring portion of the lab. This serves as an excellent checkpoint before introducing Suricata.
A.12 Installing Suricata on Ubuntu 26.04
Objective
Install Suricata on Ubuntu 26.04, update the Emerging Threats (ET Open) rule set, verify packet capture, and confirm that eve.json is being generated.
Estimated Time
20–30 minutes
Before You Begin
Verify:
- Ubuntu 26.04 is installed.
- Internet connectivity is available.
- Ubuntu Wazuh Agent is installed.
- You are logged in as a user with sudo privileges.
Step 1 — Update Ubuntu
Open a terminal.
Update the package list.
UB2604 · Terminal
sudo apt updateUpgrade installed packages.
UB2604 · Terminal
sudo apt upgrade -yStep 2 — Install Suricata
Install Suricata.
UB2604 · Terminal
sudo apt install suricata -yVerify the installation.
UB2604 · Terminal
suricata --build-infoExpected output begins with:
This is Suricata version …
Step 3 — Verify the Network Interface
Determine the interface Suricata will monitor.
Run:
UB2604 · Terminal
ip addrExample:
ens192
Note: Replace ens192 with your interface name throughout the remainder of this appendix. In this laboratory, ens192 is a silent capture interface — it carries no IP address and runs in promiscuous mode (the silent-sensor design from Chapter 1). Security Onion’s eth1 is configured the same way.
Step 4 — Configure the Monitoring Interface
Edit the Suricata configuration.
UB2604 · Terminal
sudo nano /etc/suricata/suricata.yamlLocate the af-packet section and update the capture interface. Example:
UB2604 · YAML configuration
af-packet:
  - interface: ens192
Save the file.
Exit Nano.
Step 5 — Update ET Open Rules
Update the Emerging Threats rule set.
UB2604 · Terminal
sudo suricata-updateExpected output:
UB2604 · Expected output
Loaded Suricata configuration
No errors detected
Writing rules…
Step 6 — Enable the Service
Enable Suricata to start automatically.
UB2604 · Terminal
sudo systemctl enable suricataStart the service.
UB2604 · Terminal
sudo systemctl restart suricataStep 7 — Verify the Service
Check the service status.
UB2604 · Terminal
sudo systemctl status suricataExpected:
Active: active (running)
Press q to exit.
Step 8 — Enable the Suricata Command Socket
Suricata can be queried while it is running through a unix command socket, using the suricatasc utility. The stock Ubuntu package does not enable this. The packaged service starts Suricata as root, and Suricata then drops to the unprivileged suricata account — but by the time it tries to create the socket, it no longer has permission to write into the root-owned /run directory.
The symptom is a pair of messages in the service log:
UB2604 · Expected output
E: unix-manager: failed to create socket directory /var/run/suricata/: Permission denied
W: unix-manager: Unable to create unix command socket
Detection is unaffected — Suricata still inspects traffic and writes alerts — but suricatasc cannot connect.
The fix is a systemd drop-in override, which supplements the packaged unit file without modifying it. Package updates will not overwrite it.
UB2604 · Terminal
sudo systemctl edit suricataEnter the following above the line reading ### Edits below this comment will be discarded:
UB2604 · override.conf
[Service]
User=suricata
Group=suricata
RuntimeDirectory=suricata
RuntimeDirectoryMode=0755
PIDFile=/run/suricata/suricata.pid
AmbientCapabilities=CAP_NET_RAW CAP_NET_ADMIN CAP_SYS_NICE
CapabilityBoundingSet=CAP_NET_RAW CAP_NET_ADMIN CAP_SYS_NICE
ExecStartPre=
ExecStartPre=/bin/rm -f /run/suricata/suricata.pid
ExecStart=
ExecStart=/usr/bin/suricata --af-packet -c /etc/suricata/suricata.yaml --pidfile /run/suricata/suricata.pid
Save and exit.
Why each directive is required. All of them must be present together; any one alone leaves the service broken in a different way.
UserandGroup— start as the unprivileged account rather than dropping to it later, so systemd creates the runtime directory already owned bysuricata.RuntimeDirectory— creates and removes/run/suricata/with the service lifecycle.PIDFileand theExecStartPrepair — move the PID file inside that directory./runitself is root-owned and not writable by the service account.AmbientCapabilities— grant only the privileges packet capture actually needs. This is least privilege in practice: raw socket access without the rest of root.- The bare
ExecStartPre=andExecStart=lines clear the values inherited from the packaged unit before new ones are set. Without them systemd appends, and the originalExecStartstill runs with--user suricata --group suricata— instructing an already-unprivileged process to drop privileges again, which fails.
Reload and restart.
UB2604 · Terminal
sudo systemctl daemon-reload
sudo systemctl restart suricata
Confirm the socket answers.
UB2604 · Terminal
sudo suricatasc -c uptimeExpected output — uptime in seconds:
UB2604 · Expected output
{"message":77,"return":"OK"}Verify that capture still works. A service that starts cleanly but silently stops capturing is worse than the problem being fixed. Confirm packets are still being processed before continuing.
UB2604 · Terminal
sudo tail -1 /var/log/suricata/eve.jsonThe stats record should show kernel_packets climbing and kernel_drops at zero. If it does not, remove the override with sudo rm /etc/systemd/system/suricata.service.d/override.conf, run sudo systemctl daemon-reload, and restart the service.
Step 9 — Verify eve.json
Confirm that Suricata is writing events.
UB2604 · Terminal
sudo ls -l /var/log/suricata/Expected files include:
eve.json
fast.log
stats.log
Display the last few lines of eve.json.
UB2604 · Terminal
sudo tail /var/log/suricata/eve.jsonExpected output:
UB2604 · Expected output
{"timestamp":"...","event_type":"stats",...}If traffic is already flowing, additional event types may also appear.
Step 10 — Generate Test Traffic
From the Windows 11 system, open a web browser.
Visit:
Return to Ubuntu.
Run:
UB2604 · Terminal
sudo tail -f /var/log/suricata/eve.jsonYou should begin seeing new events appear.
Press Ctrl+C to stop.
Step 11 — Verify Promiscuous Mode
Check the interface.
UB2604 · Terminal
ip link show ens192If PROMISC is not shown, enable it.
UB2604 · Terminal
sudo ip link set ens192 promisc onVerify again.
UB2604 · Terminal
ip link show ens192Expected:
PROMISC
Note: Promiscuous mode allows the interface to capture all traffic visible on the network segment. Whether it sees traffic from other virtual machines depends on your VMware network configuration.
Step 12 — Verify Packet Capture
Capture packets directly from the interface.
UB2604 · Terminal
sudo tcpdump -i ens192Generate traffic from another system.
You should observe packets similar to:
IP 192.168.1.40 > 20.42.x.x
Press Ctrl+C to stop.
Validation Checklist
Verify:
✓ Suricata installed
✓ ET Open rules updated
✓ Monitoring interface configured
✓ Suricata service running
✓ eve.json created
✓ Test traffic recorded
✓ Interface in promiscuous mode (if required)
✓ Packets visible with tcpdump
Troubleshooting
| Problem | Possible Cause | Solution |
|---|---|---|
| Suricata will not start | Configuration error | Run sudo suricata -T -c /etc/suricata/suricata.yaml to test the configuration. |
| eve.json not created | Service not running | Restart Suricata and verify the service status. |
| No traffic appears | Wrong interface | Verify the interface name with ip addr. |
| No alerts generated | Rules not installed | Run sudo suricata-update and restart the service. |
| No packets in tcpdump | Incorrect VMware network configuration | Verify that the interface is connected to the correct virtual network. |
Section Summary
You have successfully:
- Installed Suricata.
- Updated the ET Open rule set.
- Configured the monitoring interface.
- Started the Suricata service.
- Verified that eve.json is being written.
- Confirmed packet capture using tcpdump.
The Ubuntu sensor is now generating network telemetry. In the next section, you will configure the Wazuh Agent to collect Suricata events from eve.json and verify that network alerts appear in the Wazuh Dashboard.
A.13 Integrating Suricata with Wazuh
Objective
Configure the Ubuntu Wazuh Agent to monitor the Suricata eve.json log file and verify that Suricata alerts are displayed in the Wazuh Dashboard.
Estimated Time
15–20 minutes
Before You Begin
Verify:
- Suricata is installed and running.
- eve.json is being written.
- The Ubuntu Wazuh Agent is installed.
- The Ubuntu agent appears as Active in the Wazuh Dashboard.
Step 1 — Verify the Ubuntu Wazuh Agent
On Ubuntu, verify the Wazuh Agent service.
UB2604 · Terminal
sudo systemctl status wazuh-agentExpected output:
Wazuh Dashboard · Discover query
Active: active (running)Press q to return to the command prompt.
Step 2 – Verify the Agent Appears in Wazuh
Open the Wazuh Dashboard.
Navigate to:
Wazuh → Agents
Verify the Ubuntu agent appears.
Example:
| Agent | Status |
|---|---|
| u2604 | Active |
If the agent is not connected, resolve the connection issue before continuing.
Step 3 — Edit the Wazuh Agent Configuration
Open the Wazuh Agent configuration file.
UB2604 · Terminal
sudo nano /var/ossec/etc/ossec.confLocate the existing entries.
Add the following block:
UB2604 · XML configuration
<localfile>
  <log_format>json</log_format>
  <location>/var/log/suricata/eve.json</location>
</localfile>
Save the file.
Exit Nano.
Step 4 — Restart the Wazuh Agent
Restart the agent.
UB2604 · Terminal
sudo systemctl restart wazuh-agentWait approximately 30 seconds.
Step 5 — Verify the Agent
Confirm the service restarted successfully.
UB2604 · Terminal
sudo systemctl status wazuh-agentExpected:
Active: active (running)
Step 6 — Verify eve.json Is Updating
Open another terminal.
Run:
UB2604 · Terminal
sudo tail -f /var/log/suricata/eve.jsonGenerate web traffic from the Windows 11 system.
Example:
- Open a browser.
- Visit:
https://www.microsoft.com
New JSON events should appear.
Press Ctrl+C to stop.
Step 7 — Verify Events Reach Wazuh
Open the Wazuh Dashboard.
Navigate to:
Security Events
Filter on:
Agent = u2604
Within one to two minutes, Suricata events should begin appearing.
Step 8 — Verify Suricata Event Details
Open one of the events.
Typical fields include:
event_type
src_ip
dest_ip
proto
alert.signature
alert.category
severity
These fields are used throughout later chapters for threat hunting and incident investigations.
Step 9 — Generate an IDS Alert
To verify rule-based detection, generate network reconnaissance traffic from the Ubuntu sensor (or any system with nmap installed on the lab network).
Example:
UB2604 · Terminal
nmap 192.168.1.40Replace the IP address with your Windows 11 system if necessary.
Allow one to two minutes for processing.
Step 10 — Verify the Alert
Return to the Wazuh Dashboard.
Open Security Events.
You should observe one or more Suricata alerts related to the Nmap scan.
Example:
| Field | Example |
|---|---|
| Rule | ET SCAN Nmap |
| Source IP | 192.168.1.10 |
| Destination IP | 192.168.1.40 |
| Protocol | TCP |
Note: The exact alert name depends on the installed ET Open rule set and Suricata version.
Validation Checklist
Verify:
✓ Suricata service running
✓ eve.json updating
✓ Ubuntu Wazuh Agent running
✓ Wazuh Agent collecting eve.json
✓ Suricata events visible in Wazuh
✓ Nmap scan generates an IDS alert
Troubleshooting
| Problem | Possible Cause | Solution |
|---|---|---|
| No Suricata events in Wazuh | eve.json not configured in ossec.conf | Verify the entry and restart the Wazuh Agent. |
| eve.json not updating | Suricata not monitoring the correct interface | Verify the interface configured in suricata.yaml. |
| No alerts after Nmap scan | ET Open rules not installed or updated | Run sudo suricata-update and restart Suricata. |
| Wazuh Agent disconnected | Agent service stopped | Restart the Wazuh Agent and verify communication with the server. |
| JSON parsing errors | Invalid eve.json configuration | Verify eve-log is enabled in suricata.yaml. |
Section Summary
You have successfully:
- Configured the Ubuntu Wazuh Agent to collect Suricata events.
- Verified that eve.json is being monitored.
- Forwarded Suricata events to the Wazuh Server.
- Generated and detected network reconnaissance activity.
- Confirmed that both endpoint and network telemetry are available in a single SIEM.
Your Security Operations Center now has two primary telemetry sources:
| Telemetry Source | Technology | Purpose |
|---|---|---|
| Endpoint | Sysmon | Process, DNS, network, and file activity on Windows |
| Network | Suricata | Network traffic inspection, IDS alerts, and protocol analysis |
Together, these data sources provide the visibility required for the Detection Engineering, Threat Hunting, Digital Forensics, and Incident Response labs presented throughout the remainder of this textbook.
Next Section
A.14 Validating the Enterprise SOC Laboratory
Objective
Perform an end-to-end validation of the Security Operations Center by generating endpoint and network activity and verifying that the resulting events are collected and displayed in the Wazuh Dashboard.
Estimated Time
20–30 minutes
Before You Begin
Verify the following:
- Wazuh Server is running.
- Wazuh Dashboard is accessible.
- Windows Wazuh Agent is connected.
- Ubuntu Wazuh Agent is connected.
- Sysmon is installed and generating events.
- Suricata is running and writing to eve.json.
Lab Validation Checklist
Before generating any events, verify the following services.
| System | Service | Expected Status |
|---|---|---|
| Wazuh Server | wazuh-manager | Running |
| Wazuh Server | wazuh-indexer | Running |
| Wazuh Server | wazuh-dashboard | Running |
| Windows 11 | Wazuh Agent | Running |
| Windows 11 | Sysmon | Running |
| Ubuntu | Wazuh Agent | Running |
| Ubuntu | Suricata | Running |
Step 1 — Verify Connected Agents
Open the Wazuh Dashboard.
Navigate to:
Wazuh → Agents
Verify both agents are connected.
| Agent | Expected Status |
|---|---|
| win11 | Active |
| u2604 | Active |
Step 2 — Generate a Process Creation Event
On the Windows 11 system, open Command Prompt.
Run:
notepad
Close Notepad.
This generates:
- Sysmon Event ID 1
Step 3 — Generate a DNS Query
Open PowerShell.
Run:
WIN11 · PowerShell
Resolve-DnsName www.microsoft.comThis generates:
- Sysmon Event ID 22
Step 4 — Generate a Network Connection
Run:
WIN11 · PowerShell
Invoke-WebRequest https://www.microsoft.comThis generates:
- Sysmon Event ID 3
- Suricata network traffic
Step 5 — Generate an IDS Event
From the Ubuntu sensor, perform a basic TCP SYN scan against the Windows endpoint.
WAZUH-SRV · Terminal
nmap -sS 192.168.1.40Replace the IP address if necessary.
This should generate one or more Suricata IDS alerts.
Step 6 — Verify Sysmon Events
Open the Wazuh Dashboard.
Navigate to:
Security Events
Filter on:
- Agent: win11
Verify the following events appear.
| Event ID | Description |
|---|---|
| 1 | Process Creation |
| 3 | Network Connection |
| 22 | DNS Query |
Step 7 — Verify Suricata Events
Filter on:
- Agent: u2604
Verify Suricata events appear.
Examples include:
- Flow
- DNS
- HTTP
- Alert
If you generated the Nmap scan, verify an IDS alert is displayed.
Step 8 — Verify the Timeline
Open the events generated during this exercise.
Confirm the events occurred in the expected order.
Example:
| Time | Event |
|---|---|
| 10:01:15 | Process Creation (Event ID 1) |
| 10:01:16 | DNS Query (Event ID 22) |
| 10:01:17 | Network Connection (Event ID 3) |
| 10:01:18 | Suricata Flow Event |
| 10:01:19 | Suricata Alert (if triggered) |
The exact timestamps will vary, but the sequence should be similar.
Step 9 — Verify Endpoint and Network Visibility
Confirm that Wazuh is collecting telemetry from both sources.
| Source | Technology | Status |
|---|---|---|
| Endpoint | Sysmon | ✓ |
| Network | Suricata | ✓ |
This demonstrates that your SOC has visibility into both host activity and network activity.
Final Validation Checklist
Your lab is complete when all of the following are true.
| Validation Item | Complete |
|---|---|
| Wazuh Dashboard accessible | □ |
| Windows Agent connected | □ |
| Ubuntu Agent connected | □ |
| Sysmon Event ID 1 visible | □ |
| Sysmon Event ID 3 visible | □ |
| Sysmon Event ID 22 visible | □ |
| Suricata events visible | □ |
| Nmap scan detected | □ |
| Endpoint and network telemetry available | □ |
All items should be checked before proceeding to Chapter 1.
Troubleshooting
| Problem | Solution |
|---|---|
| Windows agent disconnected | Restart the Wazuh Agent and verify network connectivity. |
| Ubuntu agent disconnected | Restart the Wazuh Agent and confirm the server IP in ossec.conf. |
| No Sysmon events | Verify Sysmon is installed and the Operational log contains events. |
| No Suricata events | Verify Suricata is running and eve.json is updating. |
| No IDS alerts | Confirm ET Open rules are installed and rerun the Nmap scan. |
| Dashboard shows no new events | Wait one to two minutes and refresh the Security Events page. |
Lab Complete
Congratulations! You have successfully built and validated a functional Security Operations Center laboratory.
Your environment includes:
- A centralized Wazuh SIEM
- Windows endpoint monitoring with Sysmon
- Ubuntu network monitoring with Suricata
- Centralized log collection
- Endpoint telemetry
- Network telemetry
- IDS alerting
- Integrated event correlation
This environment will be used throughout the remainder of this textbook for hands-on exercises in Wazuh administration, Detection Engineering, Threat Hunting, Digital Forensics, Incident Response, and Security Operations.
Ready for Chapter 1
Before continuing, verify that you can answer Yes to each question:
- Can you log in to the Wazuh Dashboard?
- Do both the Windows and Ubuntu agents show as Active?
- Can you generate and view Sysmon Event IDs 1, 3, and 22?
- Can you see Suricata events from eve.json in Wazuh?
- Can you generate a Suricata IDS alert with an Nmap scan?
- Do you understand the difference between endpoint telemetry (Sysmon) and network telemetry (Suricata)?
If you answered Yes to all six questions, your enterprise SOC laboratory is fully operational and ready for the exercises in Chapter 1.