Purpose
Use this guide when a step in Appendix C — ORV Validation Procedure and Checklist does not produce the expected result.
Troubleshooting Rule
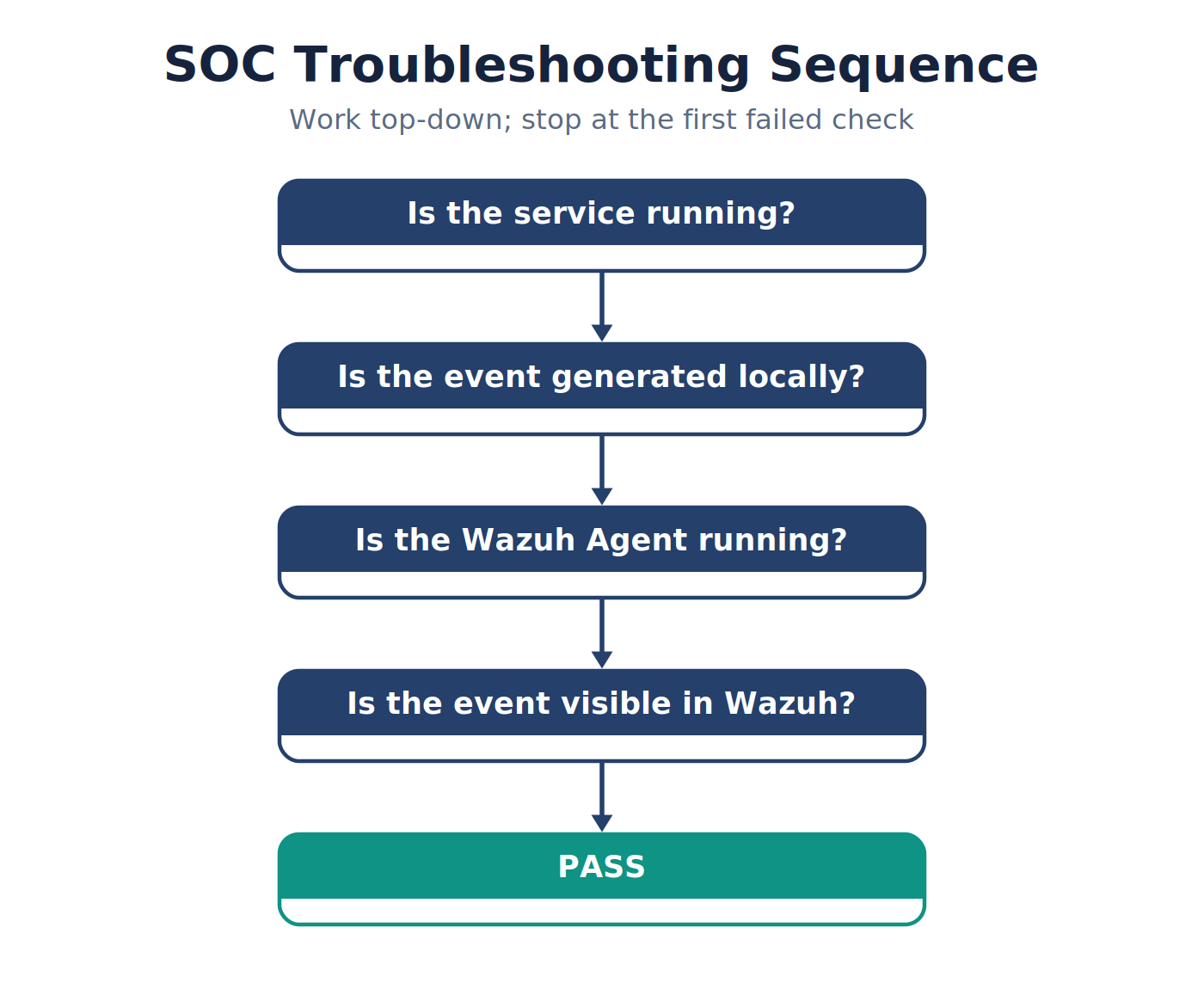
Always troubleshoot in this order:
- Verify the service is running.
- Verify the event is generated locally.
- Verify the Wazuh Agent is running.
- Verify the event appears in the Wazuh Dashboard.
Problem 1 — Wazuh Dashboard Will Not Open
Possible Causes
- Wazuh services not running
- Incorrect server IP address
- Network connectivity problem
Verify
On the Wazuh Server:
WAZUH-SRV · Terminal
sudo /var/ossec/bin/wazuh-control statusVerify all services are running.
Check the server IP address.
WAZUH-SRV · Terminal
ip addrFrom WIN11:
WIN11 · PowerShell
ping 192.168.1.30Corrective Action
Restart Wazuh.
WAZUH-SRV · Terminal
sudo /var/ossec/bin/wazuh-control restartWait one minute and try the Dashboard again.
Problem 2 — Wazuh Agent Shows “Disconnected”
Possible Causes
- Agent service stopped
- Network connectivity issue
- Incorrect Wazuh Manager IP
Verify
Windows
WIN11 · PowerShell
Get-Service WazuhSvcUbuntu
UB2604 · Terminal
sudo systemctl status wazuh-agentExpected:
Running
Corrective Action
Restart the agent.
Windows
WIN11 · PowerShell
Restart-Service WazuhSvcUbuntu
UB2604 · Terminal
sudo systemctl restart wazuh-agentRefresh the Dashboard.
Problem 3 — No Sysmon Events in Event Viewer
Possible Causes
- Sysmon not running
- Configuration not loaded
- Test commands not executed
Verify
WIN11 · PowerShell (Administrator)
Get-Service Sysmon64Verify the configuration.
WIN11 · PowerShell (Administrator)
cd C:\Sysmon
.\Sysmon64.exe -c
Open:
Event Viewer
Applications and Services Logs Microsoft Windows Sysmon Operational
Verify Event IDs:
- 1
- 3
- 22
Corrective Action
Reload the configuration.
WIN11 · PowerShell (Administrator)
.\Sysmon64.exe -c .\export.xmlRepeat the Sysmon validation commands.
Problem 4 — Sysmon Events Not Visible in Wazuh
Possible Causes
- Wazuh Agent not collecting Sysmon
- Agent service not restarted
- Incorrect ossec.conf configuration
Verify
Confirm ossec.conf contains:
WIN11 · ossec.conf
<localfile>
  <location>Microsoft-Windows-Sysmon/Operational</location>
  <log_format>eventchannel</log_format>
</localfile>
Restart the Wazuh Agent.
WIN11 · PowerShell (Administrator)
Restart-Service WazuhSvcWait one minute, and then refresh the Dashboard.
Problem 5 — No Suricata Alert
Possible Causes
- Suricata service stopped
- Wrong monitoring interface
- ET Open rules not installed
- eve.json not updating
Verify
Check Suricata.
UB2604 · Terminal
sudo systemctl status suricataVerify packet capture.
UB2604 · Terminal
sudo tcpdump -i ens192Verify eve.json.
UB2604 · Terminal
sudo tail /var/log/suricata/eve.jsonCorrective Action
Update rules.
UB2604 · Terminal
sudo suricata-updateRestart Suricata.
UB2604 · Terminal
sudo systemctl restart suricataRepeat the Nmap scan.
Problem 6 — No Packets in tcpdump
Possible Causes
- Wrong network interface
- Promiscuous mode disabled
- VMware network configuration incorrect
Verify
Identify the interface.
UB2604 · Terminal
ip addrVerify promiscuous mode.
UB2604 · Terminal
ip link show ens192Expected result: PROMISC
Corrective Action
Enable promiscuous mode.
UB2604 · Terminal
sudo ip link set ens192 promisc onVerify the VMware network adapter is connected to the correct virtual network.
Problem 7 — Microsoft Defender Does Not Detect EICAR
This troubleshooting path supports Lab 0A — EICAR, YARA, Microsoft Defender, and Wazuh Validation.
Possible Causes
- Microsoft Defender disabled
- Real-time protection disabled
- Incorrect test file downloaded
Verify
- Open Windows Security and select Virus & threat protection.
- Confirm that Real-time Protection is On.
- Download the official EICAR test file and save it as
eicar.com.
Corrective Action
Enable Microsoft Defender Real-time Protection and repeat the download.
Problem 8 — Defender Detects EICAR but Wazuh Shows Nothing
This troubleshooting path supports Lab 0A — EICAR, YARA, Microsoft Defender, and Wazuh Validation.
Possible Causes
- Wazuh Agent disconnected
- Defender events not being collected
- Delay in log forwarding
Verify
Restart the Wazuh Agent.
WIN11 · PowerShell (Administrator)
Restart-Service WazuhSvcWait one minute.
Search the Dashboard for:
Microsoft Defender
or
EICAR
Corrective Action
Generate a new EICAR detection after restarting the agent.
Problem 9 – Nmap Scan Does Not Generate an ET Alert
Possible Causes
- Incorrect destination IP
- ET Open rules outdated
- Wrong Suricata interface
- Scan bypassed the monitored interface
Verify
Confirm the Windows IP address.
UB2604 · Terminal
ping 192.168.1.40Verify packets.
UB2604 · Terminal
sudo tcpdump -i ens192Verify eve.json.
UB2604 · Terminal
sudo tail /var/log/suricata/eve.jsonCorrective Action
Update rules.
UB2604 · Terminal
sudo suricata-updateRestart Suricata.
UB2604 · Terminal
sudo systemctl restart suricataRepeat the scan.
Quick Health Check Commands
Run these first whenever the lab misbehaves; each verifies one link in the telemetry pipeline.
| Command | Verifies |
|---|---|
| sudo systemctl status wazuh-manager wazuh-indexer wazuh-dashboard | All three server services (on WAZUH-SRV) |
| sudo systemctl status wazuh-agent | Agent service (Linux endpoints) |
| sudo systemctl status suricata | Sensor service (UB2604) |
| sudo tail -f /var/log/suricata/eve.json | Live Suricata event output |
| sudo tail -n 50 /var/ossec/logs/ossec.log | Manager/agent log for errors |
| sudo /var/ossec/bin/agent_control -lc | Connected agents (run on the Manager) |
| Get-Service WazuhSvc, Sysmon64 | Windows agent and Sysmon services (PowerShell) |
Wazuh Server
WAZUH-SRV · Terminal
sudo /var/ossec/bin/wazuh-control statusUbuntu Host (UB2604; Wazuh Agent u2604)
UB2604 · Terminal
sudo systemctl status wazuh-agent
sudo systemctl status suricata
sudo tail /var/log/suricata/eve.json
sudo tcpdump -i ens192
Windows 11 (win11)
WIN11 · PowerShell
Get-Service WazuhSvc Get-Service Sysmon64WIN11 · PowerShell
Resolve-DnsName www.microsoft.comWIN11 · PowerShell
Invoke-WebRequest https://www.microsoft.comORV Troubleshooting Workflow
Figure D-1
SOC Troubleshooting Sequence
Operational Best Practice
When troubleshooting any issue in the SOC, always work from the source toward the SIEM:
- Verify the service (Wazuh, Sysmon, Suricata, or Microsoft Defender).
- Verify the event exists locally (Event Viewer or eve.json).
- Verify the Wazuh Agent is running and collecting the event.
- Verify the event appears in the Wazuh Dashboard.
Following this process isolates problems quickly and reflects the standard troubleshooting methodology used by Security Operations Centers (SOCs) in enterprise environments.