

Chapter Overview
Course Progression
This chapter prepares for and reinforces Progressive Labs PL-05, PL-06, and PL-07, which build endpoint rules, network signatures, and intelligence-backed detections. Chapter Exercises are focused practice; Progressive Labs combine skills across chapters. See Course Progression and Progressive Lab Alignment in the front matter.
Security monitoring is not a passive activity. A mature Security Operations Center continuously improves its ability to detect adversary behavior. New vulnerabilities emerge daily. Attackers modify techniques. Business operations change. New applications are deployed. Detection rules that worked last month may be ineffective today. Consequently, one of the primary responsibilities of modern SOC teams is Detection Engineering. Detection engineering is the process of designing, implementing, validating, tuning, and maintaining security detections that identify malicious activity while minimizing false positives. Throughout this chapter, students transition from SOC Analysts into Detection Engineers.
Instead of asking, “Why did this alert fire?”, students begin asking, “Should this alert exist?” and “How can we improve this detection?”
Learning Objectives
After completing this chapter, you should be able to:
Explain the role of a Detection Engineer.
Understand how Wazuh detection rules operate.
Create custom Wazuh rules.
Develop local Suricata signatures.
Tune noisy detections.
Reduce false positives.
Validate detections through controlled testing.
Measure detection quality.
Map custom detections to MITRE ATT&CK®.
Introduction
Imagine two organizations.
Both use:
Wazuh
Sysmon
Suricata
Windows Defender
One organization detects ransomware in minutes. The other detects it three days later.
Why?
The difference is rarely the software. The difference is almost always the quality of the detections. Security products generate telemetry. Detection engineers transform telemetry into meaningful alerts.
What Is Detection Engineering?
Detection engineering is the discipline of designing security analytics that reliably identify suspicious or malicious behavior (Knerler et al., 2022).
Detection engineers answer questions such as:
What behavior should trigger an alert?
Which events should be correlated?
How should false positives be reduced?
Which ATT&CK techniques are currently uncovered?
How can detections be validated?
How should detections evolve as threats change?
Detection engineering combines:
Security operations
Threat intelligence
Threat hunting
System administration
Programming
Data analysis
It is one of the fastest-growing specialties in cybersecurity.
Figure 5-1
Detection Engineering Lifecycle
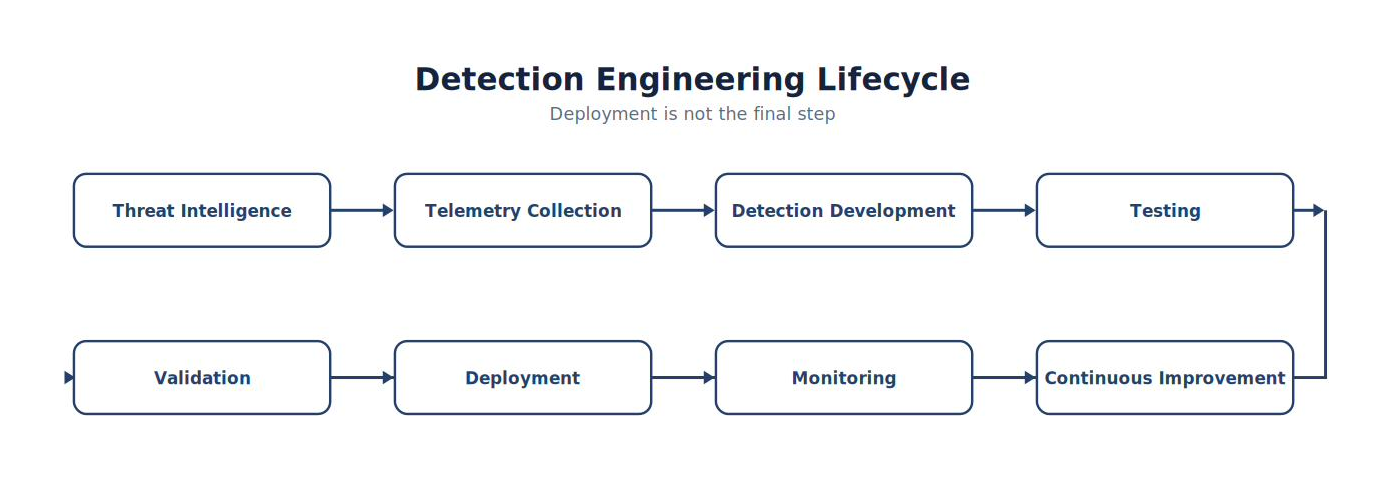
Note. The workflow presents the ordered stages of detection Engineering Lifecycle and highlights the validation and feedback steps that make the process repeatable.
Notice that deployment is not the final step.
The Detection Engineer’s Mindset
SOC analysts investigate alerts. Detection engineers investigate detections.
Instead of asking:
What happened?
Detection engineers ask:
Should this activity trigger an alert?
Should this alert be higher severity?
Is this alert too noisy?
What evidence is missing?
Can multiple alerts be correlated?
Is this ATT&CK technique sufficiently covered?
These questions improve the SOC itself.
Analyst Tradecraft Tip
Detection engineering is a continuous improvement process. A detection should never be considered “finished.”
Every detection can be:
Improved
Tuned
Simplified
Expanded
Correlated
Validated
Professional SOCs routinely revisit existing detections as their environments and threat landscapes evolve.
The Anatomy of a Detection
Every effective detection contains several components.
| Component | Purpose |
|---|---|
| Telemetry | What data is available? |
| Logic | What conditions define suspicious behavior? |
| Severity | How important is the alert? |
| Context | What additional information should accompany the alert? |
| Validation | How do we prove the detection works? |
| Documentation | How is the detection maintained? |
Missing any of these components weakens the overall detection.
Detection Sources in Our Laboratory
Our SOC uses multiple telemetry sources.
| Source | Examples |
|---|---|
| Sysmon | Processes, DNS, files |
| Suricata | Network traffic |
| Windows Defender | Malware |
| Linux Logs | Authentication |
| Wazuh | Correlation |
Every custom detection developed throughout this chapter will build upon one or more of these sources.
Detection Philosophy
One of the core principles of this textbook is:
Detect behaviors—not individual malware samples.
For example:
Instead of detecting:
SHA-256:
A91E…
Detect:
Figure 5-2
From WINWORD.EXE to Executable Download
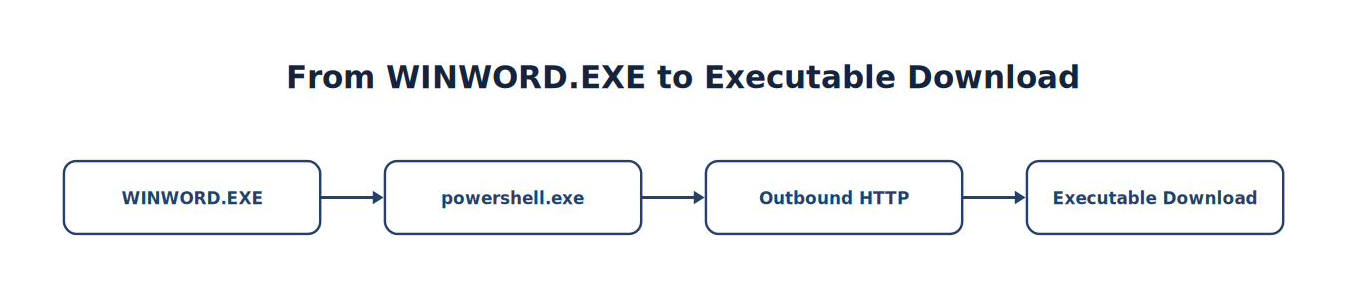
Note. The sequence traces how WINWORD.EXE progresses to Executable Download, emphasizing the intermediate evidence and processing steps.
Behavior remains suspicious even when attackers change filenames, hashes, domains, or IP addresses.
Types of Detections
Detection engineers create different types of analytics depending on the objective.
| Type | Example |
|---|---|
| Signature-based | Known Suricata rule |
| Behavioral | Office spawning PowerShell |
| Correlation | PowerShell + DNS + HTTP |
| Threshold | 20 failed logins in 5 minutes |
| Anomaly | Unusual outbound connections |
| Threat Intelligence | IOC match |
| Custom | Organization-specific activity |
Throughout this chapter, students will build examples of each.
The Cost of Poor Detections
Poor detections have consequences.
Too Sensitive
Excessive false positives
Analyst fatigue
Missed real attacks
Too Restrictive
Missed incidents
Low visibility
False sense of security
Detection engineering balances sensitivity and specificity.
Figure 5-3
Detection Quality
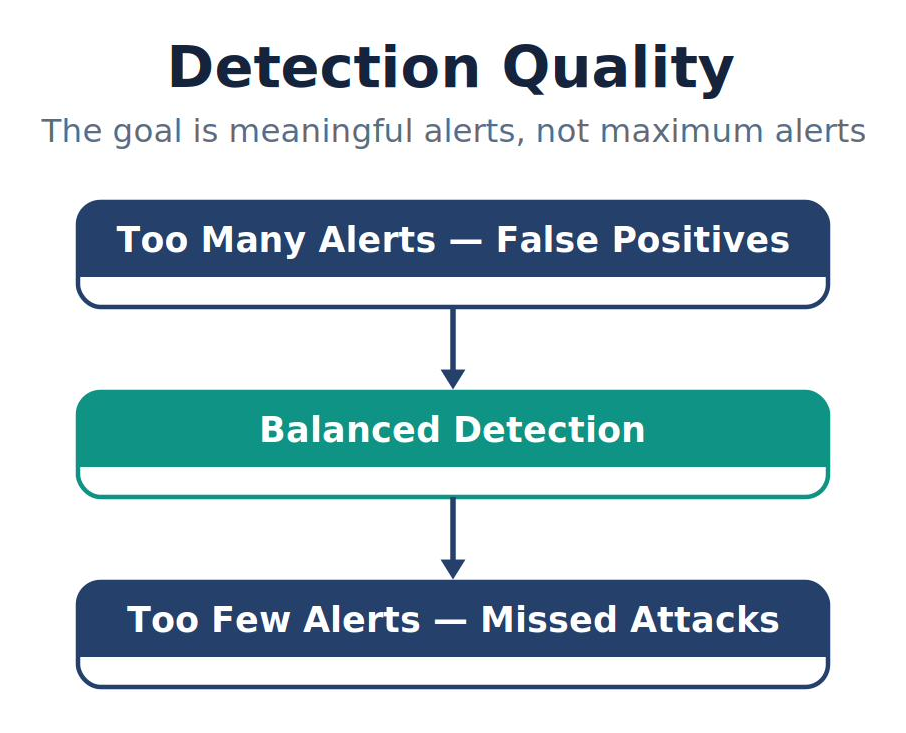
Note. The figure summarizes detection Quality and highlights the relationships among its principal elements, evidence sources, and analytical outcomes.
The goal is not the maximum number of alerts. The goal is meaningful alerts.
Detection Development Workflow
Every detection developed in this book follows the same engineering methodology.
Figure 5-4
From Define Behavior to Deploy
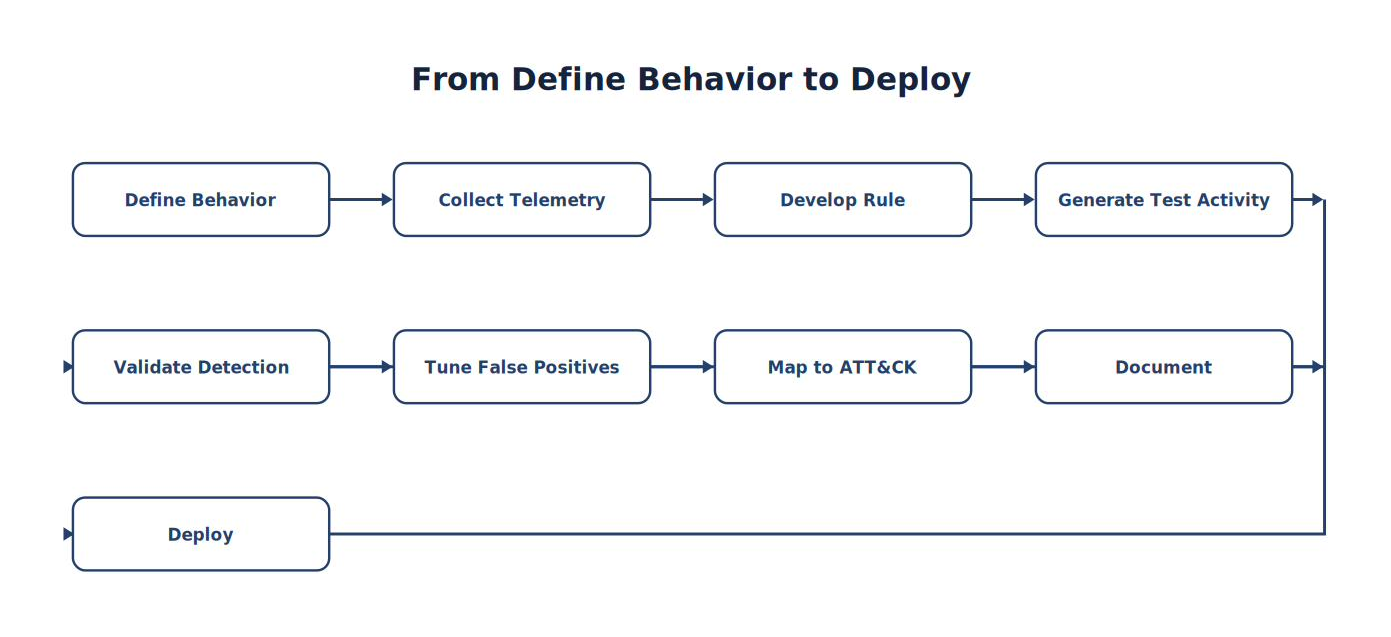
Note. The sequence traces how Define Behavior progresses to Deploy, emphasizing the intermediate evidence and processing steps.
This structured process will be repeated throughout the remainder of the textbook.
Think Like a Detection Engineer
Imagine your SOC receives 50,000 alerts every day. Analysts investigate only 500.
- Which alerts should exist?
- Which should be tuned?
- Which should be removed?
- Which attacker behaviors remain undetected?
Detection engineering is the discipline of improving those answers over time. Professional SOCs are not defined by the number of alerts they generate. They are defined by the quality, accuracy, and usefulness of those alerts.
Chapter Roadmap
The remainder of Chapter 5 is organized as follows:
| Section | Topic |
|---|---|
| 5.1 | Understanding Wazuh Rules |
| 5.2 | Rule Hierarchy and Processing |
| 5.3 | Creating Custom Wazuh Rules |
| 5.4 | Rule Testing and Validation |
| 5.5 | Reducing False Positives |
| 5.6 | Detection Tuning Strategies |
| 5.7 | Creating Local Suricata Rules |
| 5.8 | Correlation Rules |
| 5.9 | Detection Metrics |
| 5.10 | Capstone Detection Engineering Lab |
5.1 Understanding the Wazuh Rule Engine
Learning Objectives
After completing this section, you should be able to:
Explain how the Wazuh rule engine processes events.
Describe the relationship between decoders and rules.
Understand the rule evaluation pipeline.
Identify the major components of a Wazuh rule.
Explain why rule order matters.
Trace an event from collection through alert generation.
Introduction
When students first begin using Wazuh, it often appears that alerts are generated by magic. An event arrives. Seconds later, an alert appears in the Dashboard.
What happened in between?
Understanding that process is essential for detection engineering. Professional detection engineers do not simply write rules. They understand how the detection engine evaluates every event. That understanding allows them to build efficient, reliable, and maintainable detections.
The Wazuh Detection Pipeline
Every event follows the same processing pipeline.
The evaluation process remains fundamentally the same whether the event originates from:
Windows
Linux
Sysmon
Suricata
Windows Defender
File Integrity Monitoring
Figure 5-5
Wazuh Event Processing Pipeline
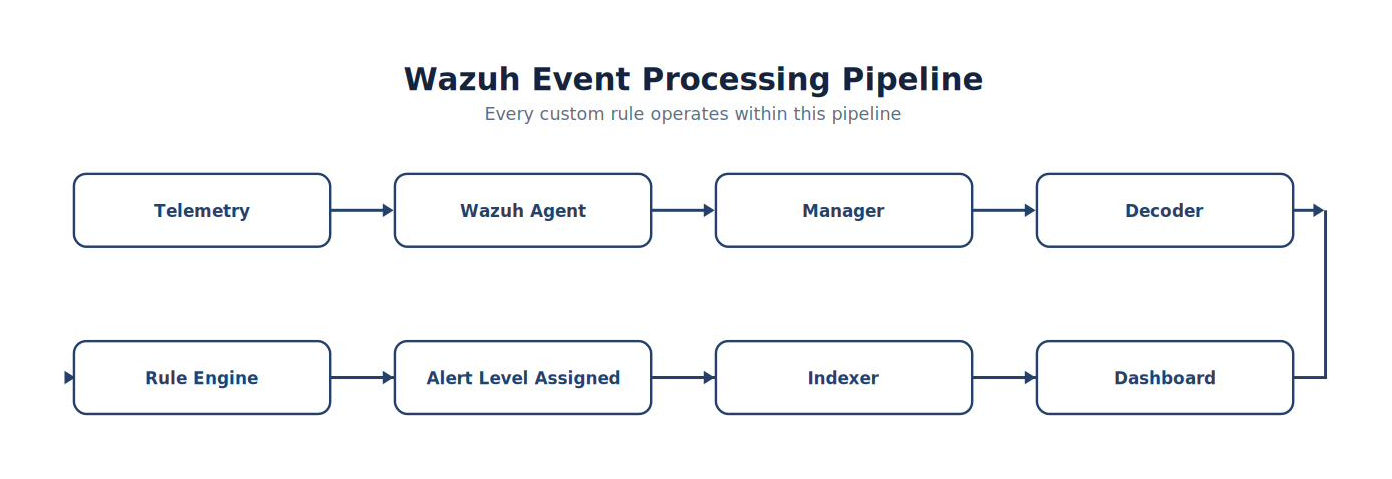
Note. The pipeline shows how information moves through wazuh Event Processing Pipeline, from its source through processing to the analyst-visible result.
Every custom rule developed later in this chapter operates within this pipeline.
Step 1 — Telemetry Collection
Everything begins with telemetry.
Examples include:
| Source | Example |
|---|---|
| Sysmon | Event ID 1 |
| Suricata | JSON alert |
| Windows Defender | Malware detection |
| Linux | Authentication log |
| Auditd | File access |
At this stage, Wazuh has not determined whether the activity is suspicious. It has merely received data.
Step 2 — Decoding
The first task performed by the Wazuh Manager is decoding. A decoder extracts structure from raw data.
For example, consider this simplified Sysmon event:
WIN11 · PowerShell
Event ID: 1
Image: C:\Windows\System32\WindowsPowerShell\v1.0\powershell.exe
User: Student01
CommandLine: powershell.exe -EncodedCommand ...
A decoder identifies fields such as:
Event ID
Image
User
Command Line
These become searchable fields within Wazuh. Without decoding, the event would simply be text.
Figure 5-6
Decoder Function
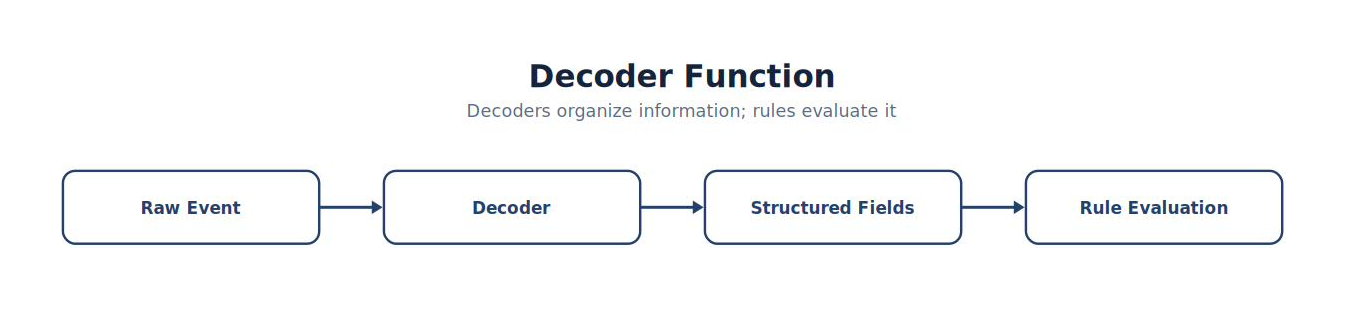
Note. The figure summarizes decoder Function and highlights the relationships among its principal elements, evidence sources, and analytical outcomes.
Step 3 — Rule Evaluation
Once an event has been decoded, the Rule Engine begins evaluating it. Each rule asks a question.
Examples include:
Is this Sysmon Event ID 1?
Does the process equal powershell.exe?
Did Suricata report a malware download?
Does the command line contain suspicious keywords?
If the conditions match, the rule fires.
Rules Are Logical Tests
A useful way to think about rules is:
IF this condition is true, THEN generate an alert.
Example:
IF
Event ID = 1
AND
Process = powershell.exe
THEN
Generate Alert
More advanced rules may include:
Multiple conditions
Time windows
Frequency thresholds
Parent-child relationships
Correlation with previous events
Analyst Tradecraft Tip
Detection rules are not artificial intelligence. They do not “understand” attacks. Rules evaluate conditions. The quality of a detection depends on how well those conditions describe suspicious behavior.
Step 4 — Assigning Severity
When a rule matches, Wazuh assigns an alert level. Alert levels help analysts prioritize investigations.
A simplified scale might look like:
| Level | Meaning |
|---|---|
| 0 | Ignored |
| 1–3 | Informational |
| 4–6 | Low |
| 7–9 | Medium |
| 10–12 | High |
| 13–15 | Critical |
Higher severity does not automatically mean an attack occurred. It means the rule author considered the activity more significant.
Step 5 — Alert Generation
After evaluation, Wazuh generates a structured alert (Wazuh, Inc., n.d.-a).
A typical alert includes:
Timestamp
Rule ID
Rule Level
Rule Description
Agent Name
Source Event
MITRE ATT&CK Mapping
Full Event Data
This alert becomes searchable within the Dashboard.
Decoders Versus Rules
Students frequently confuse these two concepts.
| Decoder | Rule |
|---|---|
| Extracts fields | Evaluates fields |
| Organizes data | Makes decisions |
| Parses logs | Generates alerts |
| Runs first | Runs second |
Think of it this way:
The decoder reads the event. The rule judges the event.
Figure 5-7
Decoder and Rule Relationship
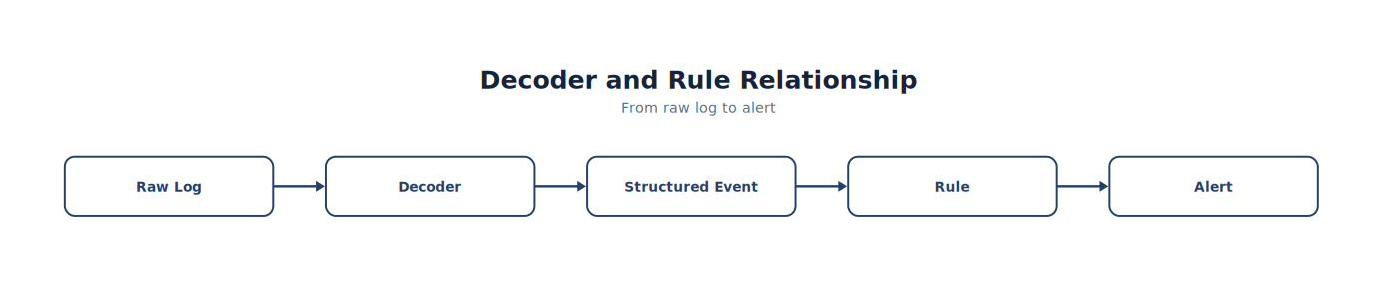
Note. The figure summarizes decoder and Rule Relationship and highlights the relationships among its principal elements, evidence sources, and analytical outcomes.
Rule Order Matters
Rules are evaluated in a logical sequence. General rules typically execute before more specific rules.
For example:
Figure 5-8
From Sysmon Event to PowerShell Download Rule
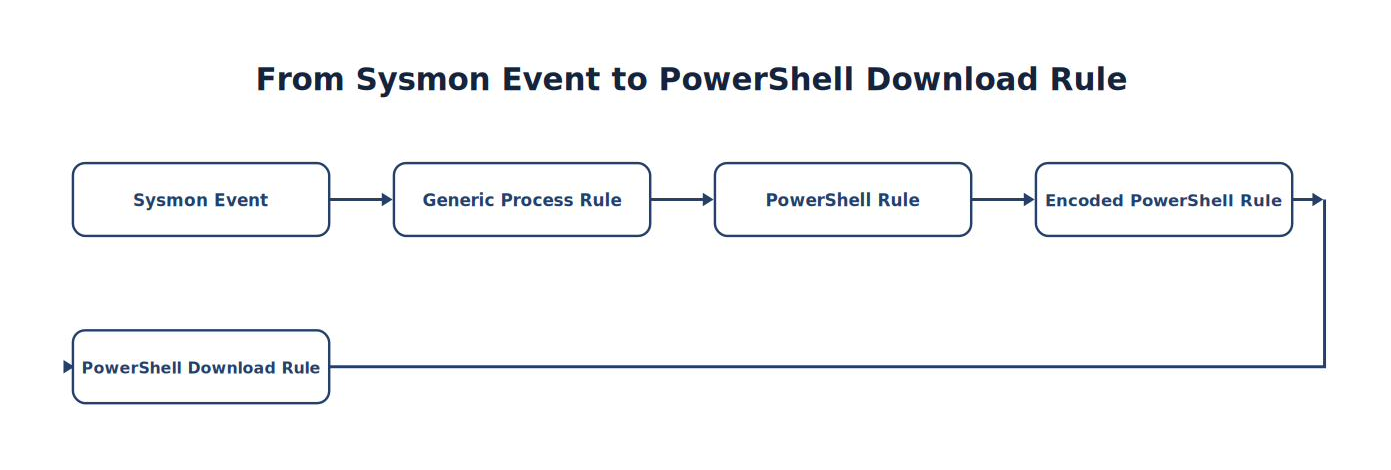
Note. The sequence traces how Sysmon Event progresses to PowerShell Download Rule, emphasizing the intermediate evidence and processing steps.
Each rule becomes progressively more specific. Understanding rule order helps explain why multiple alerts may be generated from a single event.
One Event, Multiple Rules
Suppose the following activity occurs:
powershell.exe → Encoded Command → HTTP Download
Possible matching rules:
Process Creation
PowerShell
Encoded PowerShell
Suspicious Command Line
Network Activity
Tool Transfer
One event may legitimately trigger several rules. This is expected behavior.
Event Processing Example
Consider the following sequence.
User launches PowerShell.
Sysmon records Event ID 1 (Russinovich & Garnier, n.d.).
Wazuh Agent forwards the event.
Decoder extracts the fields.
Rule identifies PowerShell.
Rule assigns Level 8.
ATT&CK mapping is added.
Alert is indexed.
Analyst sees the alert.
Breaking the process into discrete steps makes troubleshooting much easier.
Common Student Mistake
Students often modify rules before confirming the event was decoded correctly. If the decoder failed, the rule cannot evaluate fields that do not exist.
Always verify:
Event received.
Event decoded.
Fields available.
Rule evaluated.
Alert generated.
This troubleshooting sequence saves significant time.
Chapter Exercise 5.1
Choose a recent Sysmon Event ID 1 from your laboratory. Trace it through the processing pipeline.
Document:
Original event.
Decoder fields extracted.
Rule(s) that matched.
Assigned severity.
MITRE ATT&CK mapping.
Final Wazuh alert.
Present your findings as a flow diagram.
Event Processing Worksheet
| Stage | Evidence |
|---|---|
| Telemetry Source | Sysmon |
| Event Received | Yes |
| Decoder Applied | Yes |
| Fields Extracted | Yes |
| Rule Matched | Rule ID ______ |
| Severity Assigned | Level ______ |
| Alert Indexed | Yes |
| Dashboard Visible | Yes |
Students should complete this worksheet before attempting to write custom rules.
Think Like a Detection Engineer
Imagine a student says:
“My custom rule doesn’t work.”
Rather than immediately editing XML, ask:
Did the event reach the Manager?
Was it decoded successfully?
Are the expected fields present?
Does the rule evaluate those fields?
Is another rule matching first?
Does the alert level suppress the event?
Professional detection engineers troubleshoot the entire pipeline, not just the rule itself.
Key Concepts
By the end of this section, you should understand that:
Every Wazuh alert follows a predictable processing pipeline.
Decoders extract structured information from raw logs.
Rules evaluate decoded fields and assign severity.
One event may trigger multiple rules.
Rule evaluation depends upon successful decoding.
Understanding the pipeline is essential before developing custom detections.
Looking Ahead
The next section, 5.2 Rule Hierarchy, Inheritance, and Evaluation Order, explores the internal organization of Wazuh rules in greater depth. Students will learn how parent and child rules work together, how rule inheritance reduces duplication, why rule IDs and evaluation order matter, and how to extend existing Wazuh rules safely using local custom rules instead of modifying vendor content. These concepts form the foundation for writing professional, upgrade-safe detection logic throughout the remainder of the chapter.
5.2 Rule Hierarchy, Inheritance, and Evaluation Order
Learning Objectives
After completing this section, you should be able to:
Explain how Wazuh organizes detection rules.
Understand parent and child rule relationships.
Explain rule inheritance.
Describe rule evaluation order.
Understand why rule IDs matter.
Create upgrade-safe custom rules.
Introduction
Imagine organizing a university. At the highest level, there is the university. Within the university are colleges. Within colleges are departments. Within departments are faculty. Within faculty are courses. Each level becomes progressively more specific. Wazuh rules are organized using a very similar hierarchy. Rather than creating completely independent rules, Wazuh builds specialized rules upon more general rules.
This approach makes the detection engine:
Faster
Easier to maintain
Less repetitive
Easier to extend
Understanding this hierarchy is one of the defining characteristics of an effective Detection Engineer.
Why Rule Hierarchy Exists
Suppose we want to detect PowerShell activity.
A beginner might create separate rules for:
PowerShell
Encoded PowerShell
PowerShell downloading files
PowerShell executing Base64
PowerShell using Invoke-WebRequest
Each rule repeats much of the same logic. Instead, Wazuh allows rules to inherit from one another.
Figure 5-9
Rule Hierarchy
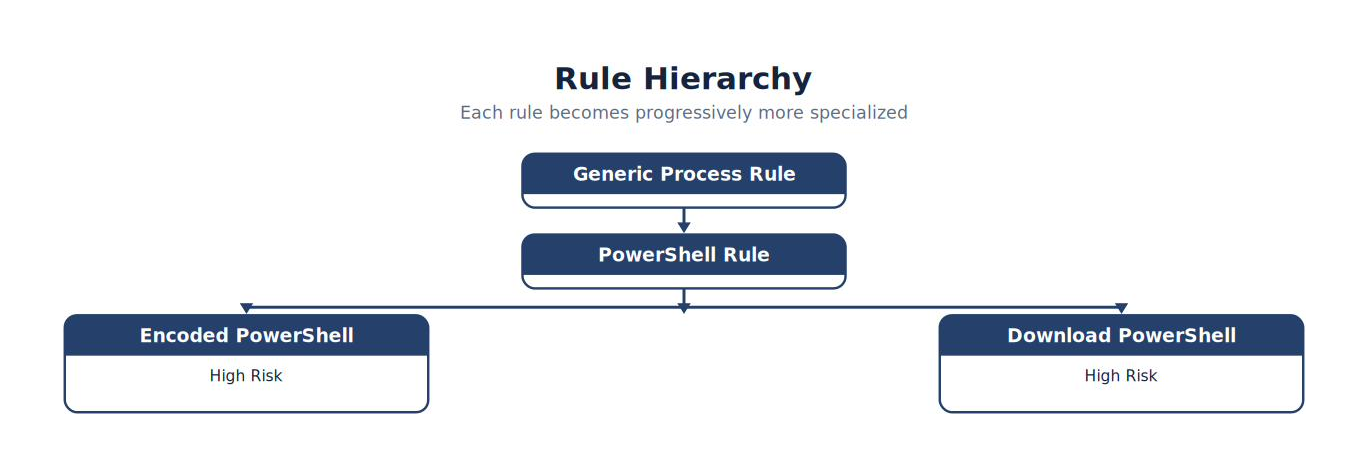
Note. The figure organizes the major elements of rule Hierarchy to clarify their roles, relationships, and escalation or inheritance paths.
Notice how each rule becomes progressively more specialized.
Parent Rules
Parent rules identify broad categories of activity.
Examples include:
Process Creation
Authentication
Network Connection
File Creation
A parent rule answers the question:
What general type of event occurred?
It does not necessarily determine whether the activity is suspicious.
Child Rules
Child rules inherit conditions from parent rules and add additional logic.
Example:
Parent:
Process Created
Child:
Process = powershell.exe
Grandchild:
PowerShell
AND
Encoded Command
Each level narrows the detection.
Analyst Tradecraft Tip
Think of parent rules as broad categories. Think of child rules as specialists. Specialists should never repeat work already performed by the parent. Inheritance exists to reduce duplication.
Rule Inheritance
Inheritance means:
A child rule automatically benefits from conditions already evaluated by its parent.
Example:
Figure 5-10
From Parent to Encoded PowerShell
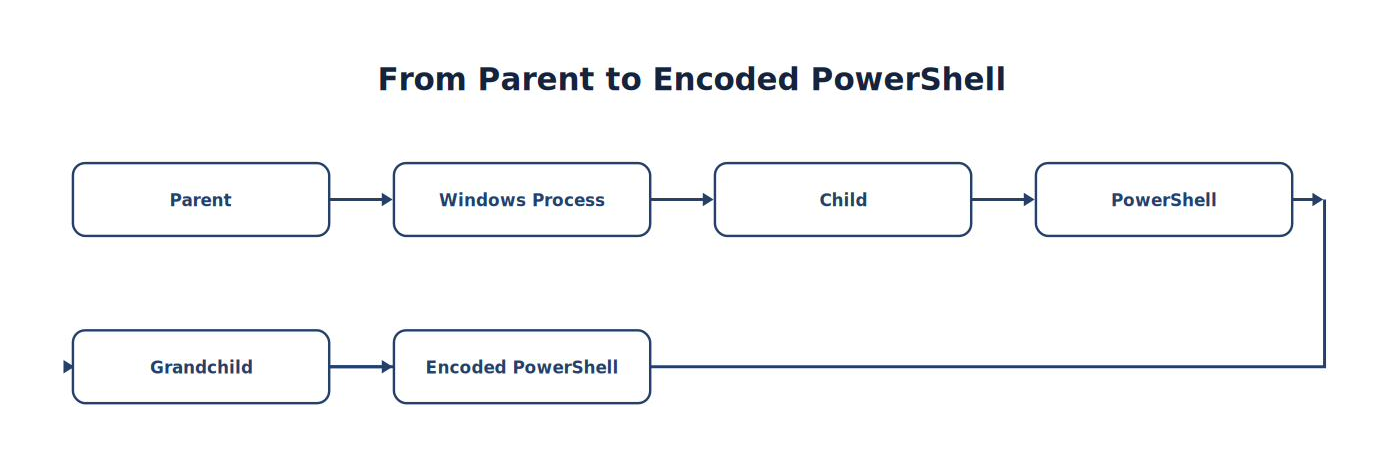
Note. The sequence traces how Parent progresses to Encoded PowerShell, emphasizing the intermediate evidence and processing steps.
The grandchild does not need to verify that the event came from Windows. The parent already established that.
This makes rules:
Smaller
Faster
Easier to read
Rule IDs
Every Wazuh rule contains a unique Rule ID.
Example:
Rule ID: 5710
The Rule ID uniquely identifies:
Detection logic
Alert metadata
Documentation
Correlation
Dashboard searches
Students should always document Rule IDs during investigations.
Choosing Rule IDs
When creating local rules, avoid conflicting with vendor-supplied rules.
A common practice is:
| Rule Type | ID Range |
|---|---|
| Vendor Rules | Reserved |
| Local Rules | Organization-defined range (for example, 100000+) |
Organizations should establish and document a consistent numbering convention. Note: Use a documented local numbering scheme throughout the course rather than selecting IDs arbitrarily.
Evaluation Order
Rules execute in a logical sequence.
Example:
Figure 5-11
From Event Received to Download Rule
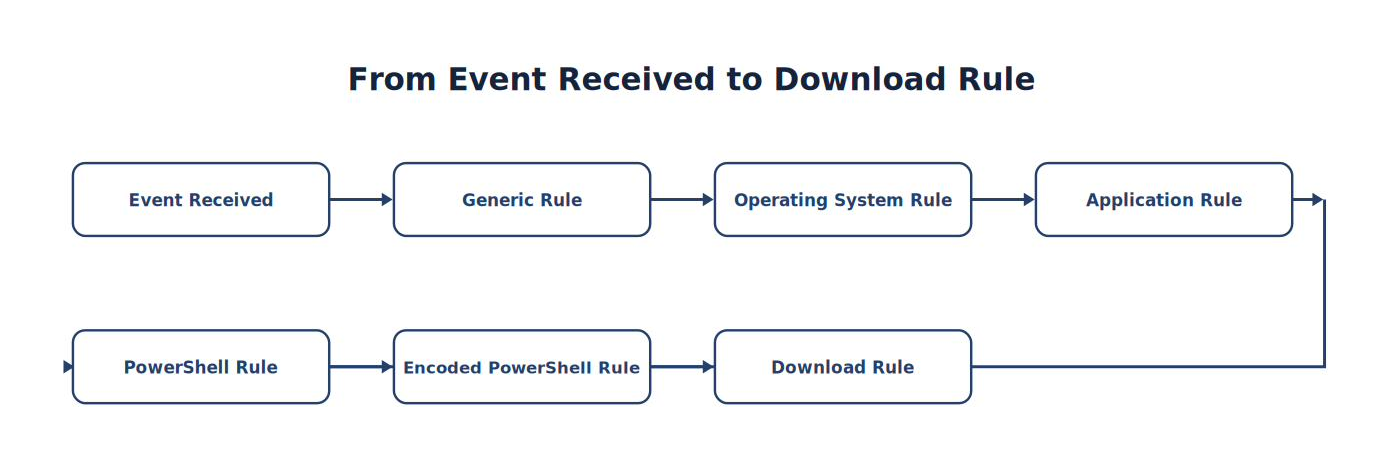
Note. The sequence traces how Event Received progresses to Download Rule, emphasizing the intermediate evidence and processing steps.
Each stage becomes increasingly specific.
Figure 5-12
Progressive Evaluation
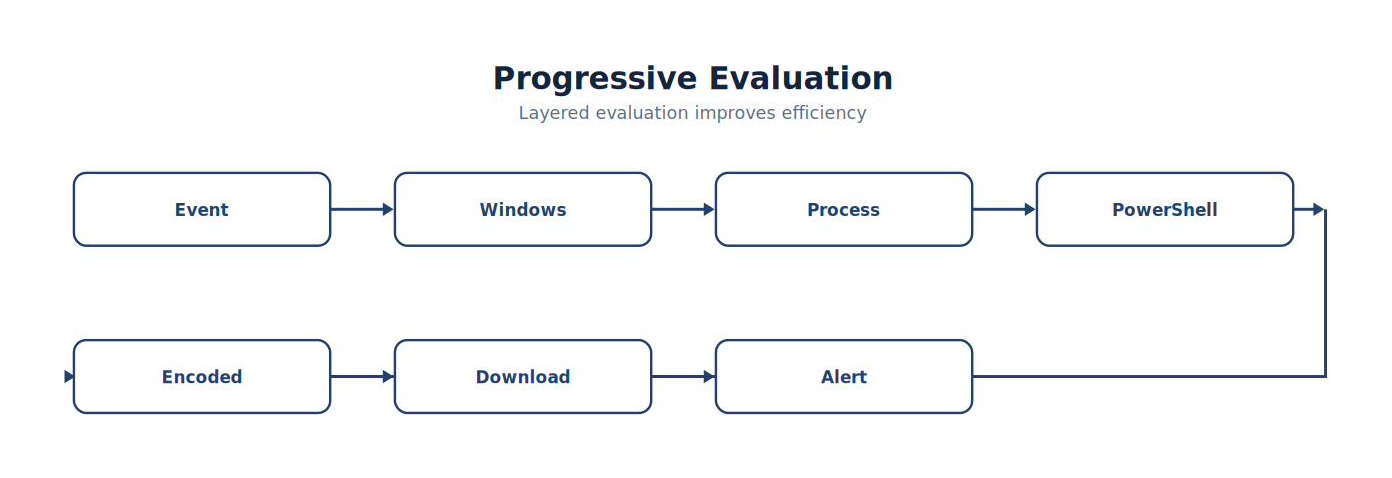
Note. The figure summarizes progressive Evaluation and highlights the relationships among its principal elements, evidence sources, and analytical outcomes.
This layered evaluation improves efficiency.
One Event — Multiple Matches
Consider the following activity.
PowerShell → Encoded Command → HTTP Download
Possible matches:
| Rule | Purpose |
|---|---|
| Process Creation | Generic |
| Windows Process | Windows |
| PowerShell | Execution |
| Encoded PowerShell | Suspicious |
| HTTP Download | Network |
| Correlation Rule | Combined Detection |
Generating multiple alerts is normal. Each rule provides different analytical context.
Rule Levels
Different rules may assign different severities.
Example:
| Rule | Level |
|---|---|
| Process Created | 3 |
| PowerShell | 5 |
| Encoded PowerShell | 9 |
| Encoded PowerShell + Download | 12 |
Severity increases as confidence increases.
Vendor Rules Versus Local Rules
One of the most important best practices in Wazuh administration is:
Never modify vendor-supplied rules directly.
Why?
Because upgrades overwrite them. Instead, create local custom rules.
Figure 5-13
Rule Organization
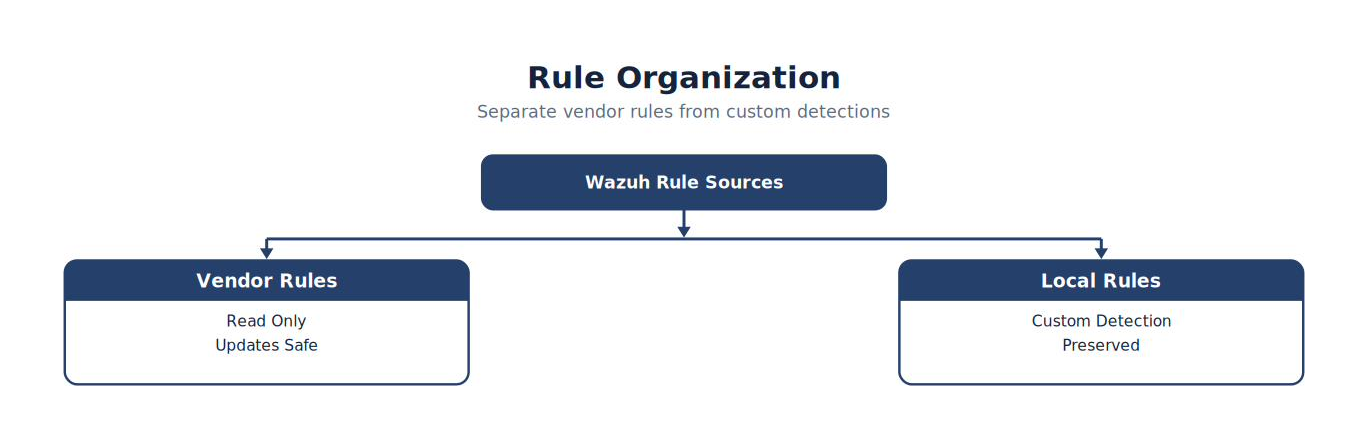
Note. The figure organizes the major elements of rule Organization to clarify their roles, relationships, and escalation or inheritance paths.
This simple practice prevents countless upgrade problems.
The Local Rules File
Throughout this textbook, all custom detections will be placed in:
/var/ossec/etc/rules/local_rules.xml
This file becomes the primary workspace for student-developed detections. Students should treat vendor rules as reference material and local rules as their engineering workspace.
Extending Existing Rules
Rather than replacing vendor logic, extend it.
Example:
Vendor Rule:
PowerShell Execution
Local Rule:
PowerShell Execution
Encoded Command
Network Download
=
Higher Severity Alert
This approach preserves vendor updates while allowing organization-specific enhancements.
Common Student Mistake
Students frequently copy an entire vendor rule into the local rule file and make small changes.
This creates:
Duplicate logic
Maintenance problems
Upgrade conflicts
Confusing investigations
Instead, inherit from existing logic whenever possible.
Chapter Exercise 5.2
Select a PowerShell-related alert from your laboratory.
Determine:
Which parent rule matched?
Which child rule generated the alert?
What additional conditions caused the child rule to fire?
What Rule ID was assigned?
Could a local child rule improve this detection?
Document your findings using a rule hierarchy diagram.
Rule Hierarchy Worksheet
| Rule | Type | Purpose |
|---|---|---|
| Parent | Generic | Windows Process |
| Child | Specialized | PowerShell |
| Grandchild | Specialized | Encoded PowerShell |
| Local Rule | Custom | PowerShell + Download |
Students should complete this worksheet for several existing Wazuh detections before creating their own.
Best Practices for Rule Development
As you begin writing custom rules, follow these guidelines:
Extend before replacing.
Use local rule files only.
Assign unique local Rule IDs.
Document every custom rule.
Map detections to MITRE ATT&CK where appropriate.
Test every rule with known-good and known-bad activity.
Tune before deployment to reduce false positives.
Version-control your local rule files whenever possible.
These practices mirror those used in mature enterprise SOCs.
Think Like a Detection Engineer
Imagine your organization upgrades Wazuh. One engineer edited dozens of vendor rule files directly. Another engineer created well-documented local child rules that extended vendor functionality without modifying it.
Which engineer finishes the upgrade with minimal effort?
Professional detection engineers build systems that remain maintainable over time. Maintainability is a security feature.
Key Concepts
By the end of this section, you should understand that:
Wazuh organizes rules hierarchically.
Parent rules provide general classifications.
Child rules add increasingly specific detection logic.
Rule inheritance reduces duplication and improves maintainability.
Rule evaluation proceeds from general to specific.
Vendor rules should remain unchanged.
Custom detections belong in local_rules.xml.
Upgrade-safe engineering practices are essential for long-term SOC maintenance.
Looking Ahead
In Section 5.3 — Creating Your First Custom Wazuh Rule, students will build their first production-quality detection. Rather than beginning with a complex correlation rule, they will start with a simple PowerShell detection, validate it using controlled laboratory activity, progressively enhance it with additional conditions, assign appropriate severity, map it to MITRE ATT&CK, and document it using professional detection engineering standards. This incremental approach mirrors how enterprise SOC teams develop, test, review, and deploy new detections.
5.3 Creating Your First Custom Wazuh Rule
Learning Objectives
After completing this section, you should be able to:
Explain the purpose of custom detection rules.
Create a local Wazuh rule.
Understand the major XML elements of a rule.
Assign appropriate Rule IDs and severity levels.
Validate rule syntax.
Test rules using controlled laboratory activity.
Troubleshoot common rule development problems.
Introduction
Every Security Operations Center is unique. Although Wazuh provides thousands of excellent detection rules, every organization eventually encounters activity that requires organization-specific monitoring (Wazuh, Inc., n.d.-a).
Examples include:
Monitoring privileged administrator accounts
Detecting unauthorized PowerShell usage
Monitoring custom applications
Detecting prohibited software
Identifying policy violations
Monitoring proprietary business systems
This is where custom rules become valuable. Custom rules allow an organization to transform raw telemetry into detections aligned with its own operational environment.
Why Build Custom Rules?
Imagine two organizations. One is a hospital. The other is a financial institution.
Should they generate identical alerts?
Probably not.
The hospital may care about:
Unauthorized access to medical systems
Electronic health record servers
HIPAA-related activity
The financial institution may care about:
Wire transfer systems
Payment processing
Privileged database access
The same operating systems. The same SIEM. Completely different detection priorities.
Figure 5-14
Detection Engineering
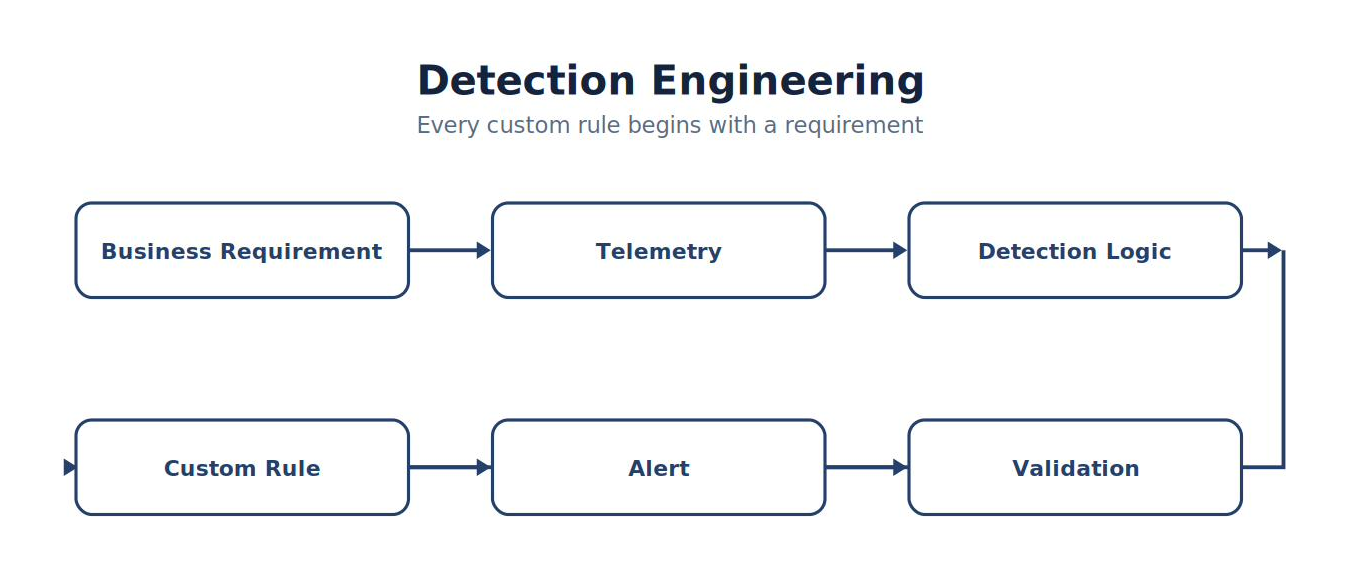
Note. The figure summarizes detection Engineering and highlights the relationships among its principal elements, evidence sources, and analytical outcomes.
Every custom rule begins with a business or security requirement.
The Engineering Process
Throughout this textbook every custom detection follows the same workflow.
Figure 5-15
From Observe Behavior to Document
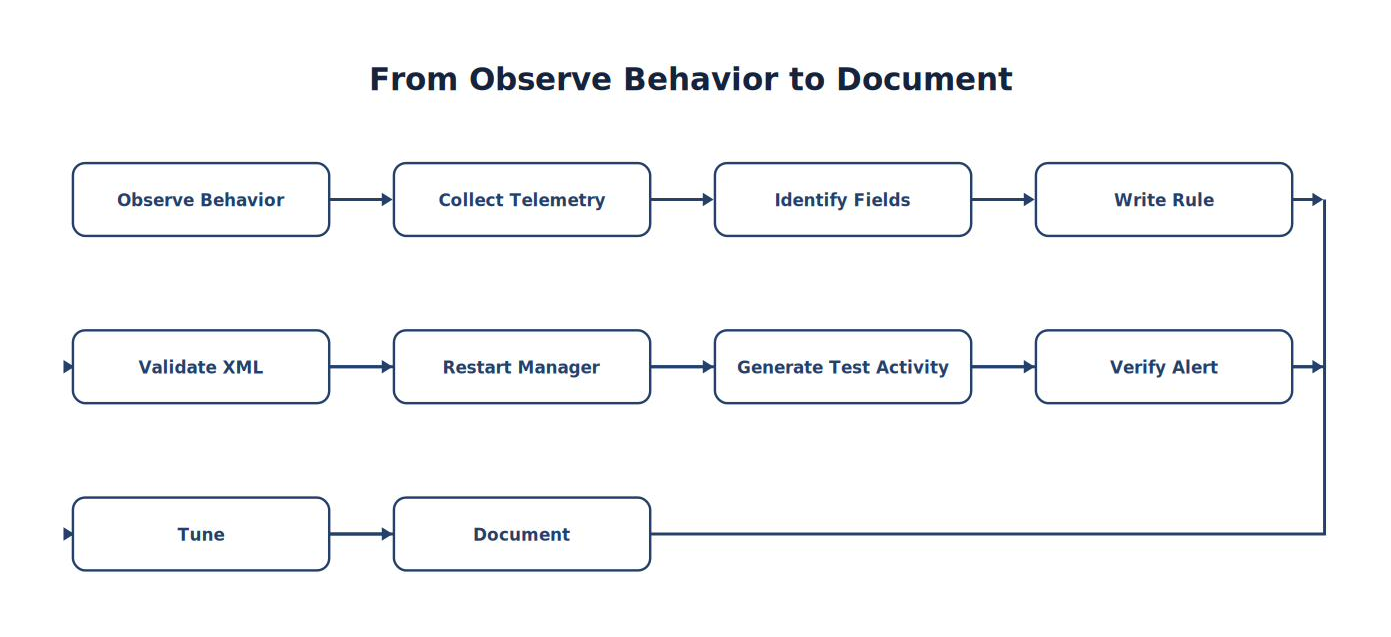
Note. The sequence traces how Observe Behavior progresses to Document, emphasizing the intermediate evidence and processing steps.
Students should memorize this process—not the XML syntax.
Step 1 — Identify the Behavior
Never begin by writing XML. Begin by defining the behavior.
Example:
Detect PowerShell execution.
Ask yourself:
Why is this behavior important?
Which telemetry source records it?
Which fields identify it?
Which ATT&CK technique does it represent?
Good detection engineering begins with good problem definition.
Step 2 — Locate the Event
Before writing a rule, find a real event.
Example:
Generate:
powershell.exe
Locate the event in Wazuh Discover. Expand the event.
Record:
Rule ID
Event ID
Process Name
Image
Command Line
Parent Process
Never write rules against imagined data. Always use actual telemetry.
Analyst Tradecraft Tip
One of the biggest mistakes new detection engineers make is writing rules without first examining the event. Professional engineers always inspect the telemetry before writing detection logic. The data determines the rule—not the other way around.
Step 3 — Identify the Fields
Suppose Discover shows:
| Field | Value |
|---|---|
| agent.name | win11 |
| data.win.eventdata.image | powershell.exe |
| data.win.eventdata.parentImage | explorer.exe |
| data.win.system.eventID | 1 |
These fields become the foundation of the detection. Choosing the wrong field guarantees the rule will fail.
Step 4 — Write the Rule
Now create a local rule.
A simplified example:
61603 powershell.exe Local Detection: PowerShell Executed
Note that custom rule IDs must fall within the range Wazuh reserves for local rules (100000–120000) so they never collide with vendor-maintained rules (Wazuh, Inc., n.d.-a). At this stage, do not worry about memorizing XML. Instead, understand what each element accomplishes.
Understanding the Rule Components
| Component | Purpose |
|---|---|
| Organizes related rules | |
| Defines a detection; carries the id and level attributes | |
| id | Unique identifier |
| level | Alert severity |
| Parent rule dependency | |
| Field being evaluated, using the exact field name produced by the decoder (verify with wazuh-logtest) | |
| Alert displayed to analysts |
Each element contributes a specific function.
Figure 5-16
Rule Anatomy
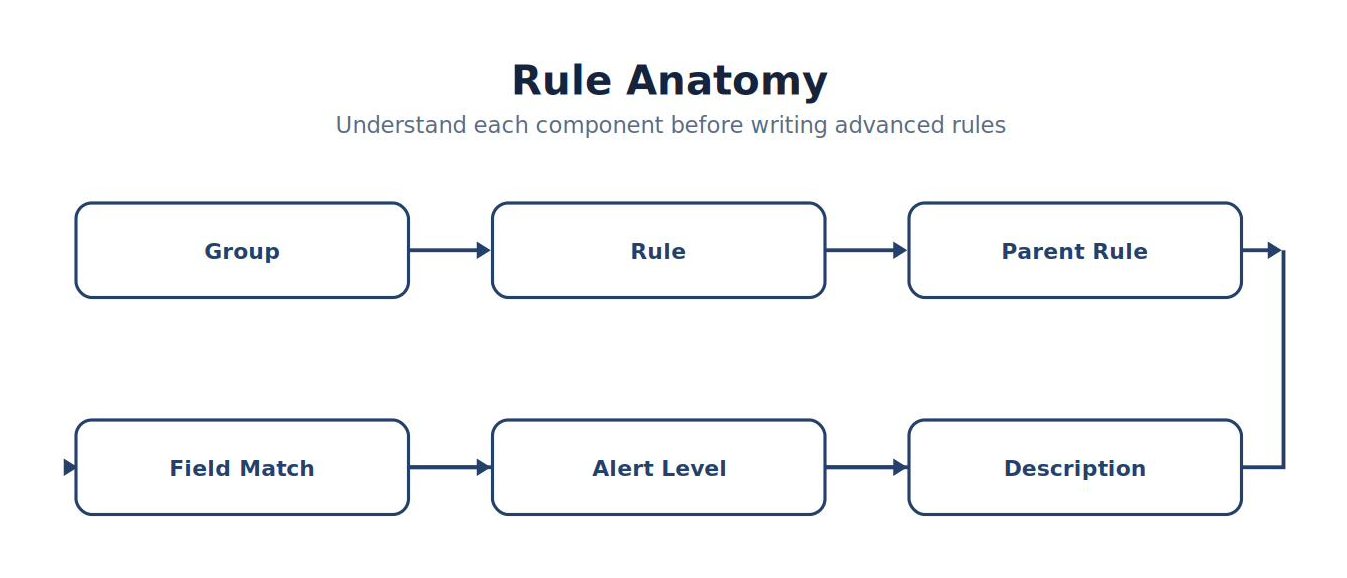
Note. The figure breaks rule Anatomy into its functional parts and shows how those parts combine to produce the intended detection behavior.
Students should understand the purpose of each component before creating more advanced rules.
Step 5 — Validate the Configuration
Before restarting Wazuh, validate the XML. Never assume the configuration is correct. A single missing tag can prevent the Manager from loading the rule file. Validation should become an automatic habit.
Note: The exact validation command depends on the installed Wazuh version. Throughout this course, students should use the validation procedure recommended for their deployment before restarting services.
Step 6 — Restart the Manager
After validation, restart the Manager.
WAZUH-SRV · Terminal
sudo systemctl restart wazuh-managerImmediately verify:
WAZUH-SRV · Terminal
sudo systemctl status wazuh-managerExpected:
Active: active (running)
If the Manager fails to start, review the logs before modifying the rule.
Step 7 — Generate Test Activity
Run:
powershell.exe
Return to the Dashboard.
Search:
Local Detection or
Rule ID: 100001
Locate the alert. Congratulations. You have created your first custom Wazuh detection.
Figure 5-17
Validation Workflow

Note. The workflow presents the ordered stages of validation Workflow and highlights the validation and feedback steps that make the process repeatable.
Detection engineering is not complete until the rule successfully detects the intended activity.
Understanding Alert Levels
Students often ask:
“What level should my rule use?” The answer depends on risk.
Example guidelines:
| Level | Typical Use |
|---|---|
| 3–4 | Informational |
| 5–7 | Suspicious |
| 8–10 | High-confidence suspicious activity |
| 11–15 | Severe or confirmed malicious activity |
Assign severity based on the confidence and impact of the detection—not simply because the behavior seems interesting.
Rule Documentation
Every custom rule should be documented.
Suggested template:
| Item | Value |
|---|---|
| Rule ID | 100001 |
| Rule Name | Local PowerShell Detection |
| ATT&CK | T1059.001 |
| Telemetry | Sysmon Event ID 1 |
| Purpose | Detect PowerShell execution |
| Author | Student Name |
| Version | 1.0 |
| Last Modified | Date |
| Validation | Passed |
Professional SOCs maintain this documentation in version control.
Common Student Mistake
Students often stop after the rule generates one alert.
A production-quality detection must answer additional questions:
Does it detect the intended behavior every time?
Does it generate false positives?
Does it miss expected activity?
Is the severity appropriate?
Does it map to the correct ATT&CK technique?
Has it been documented?
Has another analyst reviewed it?
Detection engineering extends beyond writing code.
Chapter Exercise 5.3 — Build Your First Detection
Objective
Create, validate, and document a custom Wazuh rule that detects PowerShell execution on the Windows 11 endpoint.
Procedure
Generate a Sysmon Event ID 1 by launching PowerShell.
Locate the event in Discover.
Identify the relevant fields.
Create a local rule using your assigned Rule ID range.
Validate the configuration.
Restart the Wazuh Manager.
Generate PowerShell activity again.
Confirm the alert appears.
Record:
Rule ID
Alert Level
ATT&CK Technique
Timestamp
Write a one-page engineering summary explaining:
Why the rule exists.
How it works.
How it was tested.
What limitations remain.
Engineering Checklist
Before declaring a rule complete, verify:
| Validation | Status |
|---|---|
| Behavior clearly defined | □ |
| Telemetry confirmed | □ |
| Correct fields identified | □ |
| Rule created | □ |
| XML validated | □ |
| Manager restarted successfully | □ |
| Test activity generated | □ |
| Alert observed | □ |
| ATT&CK mapped | □ |
| Documentation completed | □ |
Think Like a Detection Engineer
Imagine two engineers submit PowerShell detections.
Engineer A
Wrote the XML.
Generated one alert.
Declared the rule complete.
Engineer B
Verified the telemetry.
Chose the correct fields.
Tested multiple scenarios.
Measured false positives.
Assigned an appropriate severity.
Mapped the rule to MITRE ATT&CK.
Documented the rule.
Had another analyst review it before deployment.
Both created a rule. Only one created a production-quality detection.
Looking Ahead
The next section, 5.4 Rule Testing, Validation, and Debugging, teaches students how to systematically test their detections. They will learn how to validate both successful matches and expected non-matches, interpret Wazuh Manager logs, troubleshoot XML and logic errors, measure false positives and false negatives, and build repeatable validation plans. This section reinforces an essential engineering principle: a detection is not complete because it was written—it is complete only after it has been rigorously tested and shown to work reliably under realistic conditions.
5.4 Rule Testing, Validation, and Debugging
Learning Objectives
After completing this section, you should be able to:
Explain why validation is essential for detection engineering.
Develop structured rule test plans.
Validate successful and unsuccessful rule matches.
Troubleshoot custom Wazuh rules.
Differentiate between false positives and false negatives.
Debug XML syntax and rule logic.
Document validation results.
Introduction
Imagine a software engineer writing thousands of lines of code without ever running the program.
Would you trust it?
Probably not. Detection engineering is software engineering. A detection is code. Code must be tested. Professional Detection Engineers never assume a rule works simply because it loads successfully.
Instead, they systematically answer questions such as:
Does the rule detect the intended behavior?
Does it miss expected activity?
Does it alert too frequently?
Does it create duplicate alerts?
Does it assign the correct severity?
Does it produce useful information for analysts?
Testing transforms a rule into a dependable detection.
The Detection Validation Lifecycle
Every detection developed in this textbook follows the same lifecycle.
Figure 5-18
Detection Validation Lifecycle
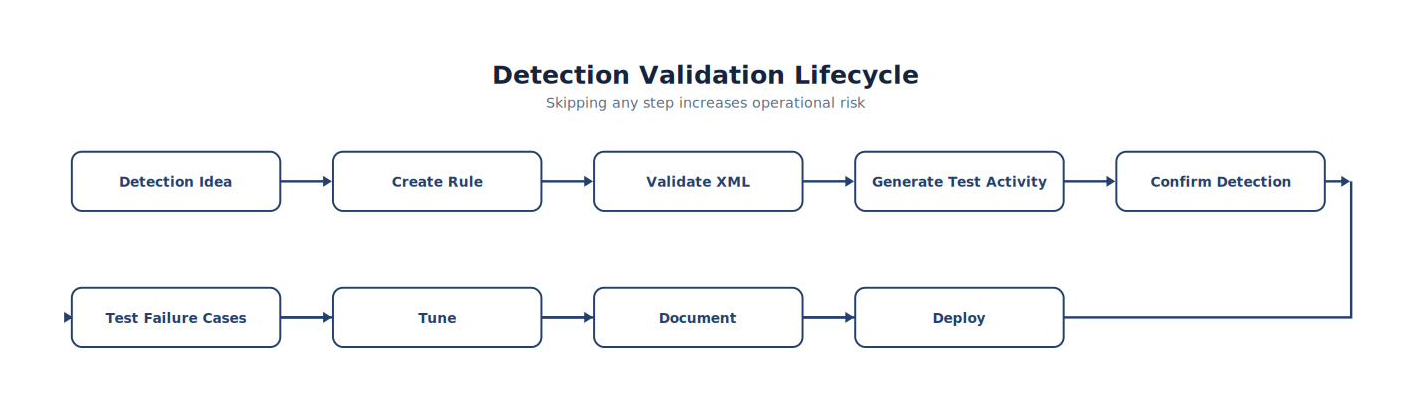
Note. The workflow presents the ordered stages of detection Validation Lifecycle and highlights the validation and feedback steps that make the process repeatable.
Skipping any step increases operational risk.
Validation Is More Than “Did It Alert?”
Many beginning analysts perform only one test.
Example:
Launch PowerShell. Alert appears. Success. Unfortunately, this proves very little. Professional validation requires several different tests.
The Four Validation Questions
Every custom rule should answer four questions.
| Question | Expected Result |
|---|---|
| Should this alert fire? | Yes |
| Should this alert not fire? | Yes |
| Is the severity correct? | Yes |
| Is the alert useful? | Yes |
Notice something. A good detection proves both positive and negative behavior.
Using wazuh-logtest
Before generating live telemetry to test a new rule, professional Detection Engineers use wazuh-logtest — the official Wazuh utility built specifically for testing rules and decoders against sample log lines inside a sandbox, without needing to restart the Manager or wait for real traffic.
Run it directly on the Wazuh Server:
WAZUH-SRV · Terminal
/var/ossec/bin/wazuh-logtestThe tool starts an interactive session. Paste in a single log line and press Enter:
Aug 04 08:07:00 linux-agent sshd[39245]: Invalid user baduser from 25.25.25.25 port 57238
wazuh-logtest shows exactly how that line moves through the pipeline in three phases:
Phase 1 — Pre-decoding. Confirms the timestamp, hostname, and program name were extracted correctly.
Phase 2 — Decoding. Shows which decoder matched and which fields it extracted (for example, srcip, srcport, srcuser).
Phase 3 — Rule filtering. Shows which rule ID matched, its severity level, its description, and — importantly — any MITRE ATT&CK technique and tactic mappings attached to that rule.
If your custom rule does not appear in Phase 3, the problem is almost always one of two things: the decoder in Phase 2 never extracted the field your rule’s element is checking, or your value does not match the parent rule that actually fired. wazuh-logtest shows you both, which is exactly why it should be the first tool you reach for — before restarting services, before generating live test traffic, and before assuming the rule engine is broken.
Analyst Tradecraft Tip
Test before you restart. Use wazuh-logtest -v to inspect decoding and rule evaluation before changing services, generating more traffic, or assuming the rule engine is broken.
Run the Verbose Rule Test
WAZUH-SRV · Terminal
/var/ossec/bin/wazuh-logtest -vThis is the single most useful flag when debugging why a custom rule refuses to match.
A second discipline is negative testing. One of the best questions a Detection Engineer can ask is:
“What should NOT trigger this rule?” False positives consume analyst time. Reducing them is just as valuable as creating new detections.
Positive Testing
Positive testing verifies that expected behavior triggers the rule.
Example:
Detection Objective:
Detect PowerShell.
Test:
powershell.exe
Expected Result:
UB2604 · Expected output
✓ Custom Rule fires.
✓ Dashboard displays alert.
✓ Correct Rule ID appears. ✓ Correct severity assigned.
Negative Testing
Now verify the opposite.
Launch:
notepad.exe
Expected Result:
UB2604 · Expected output
✓ No PowerShell alert.This confirms the detection is selective.
Figure 5-19
Positive vs Negative Testing
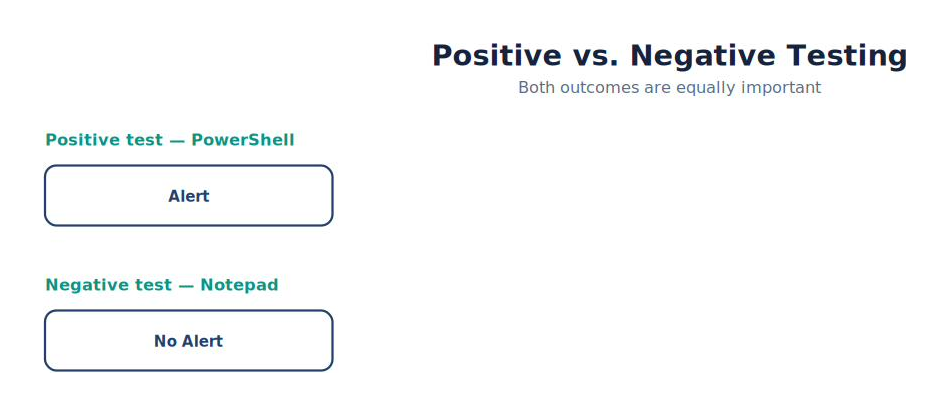
Note. The comparison highlights the operational differences represented by positive vs Negative Testing and shows why the distinction matters during analysis.
Both outcomes are equally important.
Boundary Testing
Suppose a rule detects:
powershell.exe
Now test variations.
Examples:
powershell.exe powershell
PowerShell.EXE pwsh.exe
Should all match?
Maybe. Maybe not. Boundary testing identifies assumptions hidden within detection logic.
Stress Testing
Can the rule handle repeated events?
Example:
Run PowerShell:
10 times
50 times
100 times
Questions:
Does the Manager remain responsive?
Does alert generation remain consistent?
Does correlation still work?
Enterprise SOCs process millions of events daily. Detections must scale.
Building a Test Plan
Professional engineers rarely test randomly. Instead, they build repeatable test plans.
Example:
| Test | Expected |
|---|---|
| Launch PowerShell | Alert |
| Launch Notepad | No Alert |
| Launch CMD | No Alert |
| Encoded PowerShell | High Severity |
| PowerShell Download | Correlation Rule |
Every future software update can now repeat the same validation.
Debugging Strategy
Suppose your rule does not work. Avoid changing random XML. Instead, follow a structured troubleshooting process.
Step 1
Did the event occur?
Verify Sysmon.
Step 2
Did Wazuh receive it?
Verify the Dashboard.
Step 3
Was it decoded?
Verify expected fields exist.
Step 4
Did your rule evaluate those fields?
Compare the rule with the event.
Step 5
Was another rule matched instead?
Review the alert hierarchy.
Figure 5-20
Debugging Flowchart
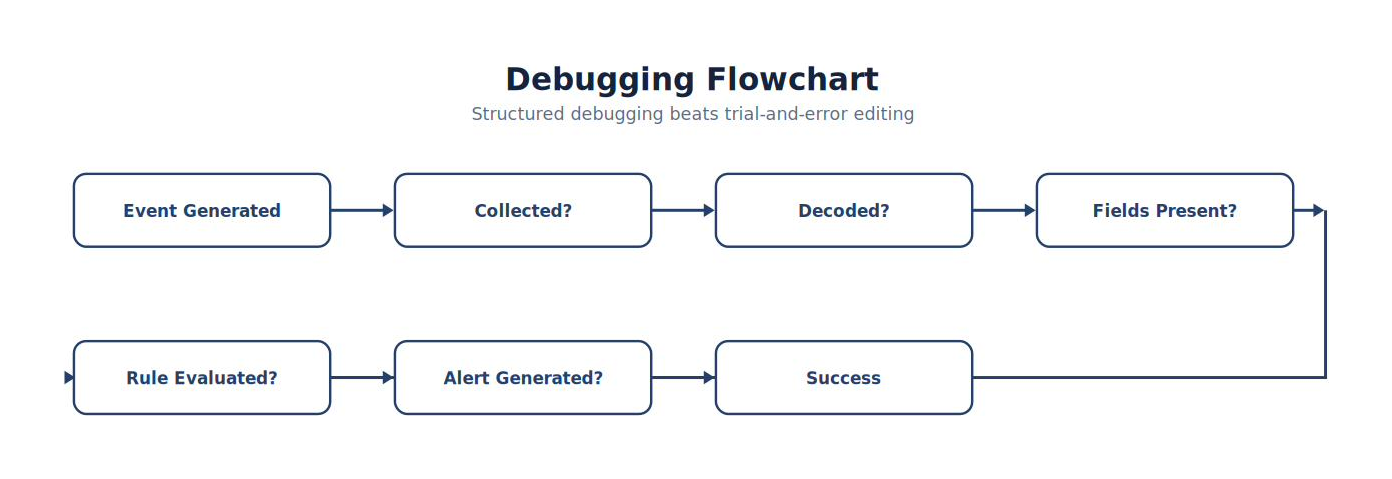
Note. The figure summarizes debugging Flowchart and highlights the relationships among its principal elements, evidence sources, and analytical outcomes.
Structured debugging is faster than trial-and-error editing.
XML Errors
The simplest failures often involve XML syntax.
Common examples include:
Missing closing tags.
Incorrect nesting.
Invalid quotation marks.
Typographical errors.
Duplicate Rule IDs.
One small syntax error may prevent the Manager from loading the entire rule file. Validate before restarting services.
Logic Errors
Sometimes XML is correct, but logic is wrong.
Example:
Rule searches:
powershell.exe
Event contains:
PowerShell.EXE
XML is valid. Logic fails. Detection engineering requires verifying both syntax and semantics.
False Positives
A false positive occurs when detection logic incorrectly classifies benign activity as malicious or policy violating (Scarfone & Mell, 2007).
Example:
Administrator launches PowerShell. Alert fires.
Expected?
Maybe. If administrators routinely use PowerShell, additional context may be necessary before assigning high severity.
False Negatives
A false negative occurs when malicious or policy-violating activity is present but the detection does not alert (Scarfone & Mell, 2007). It creates a visibility gap and may allow harmful activity to continue unnoticed.
Example:
Encoded PowerShell executes.
Custom rule detects only:
powershell.exe
The attack proceeds unnoticed. Detection gaps are often discovered through structured testing.
Figure 5-21
Detection Outcomes
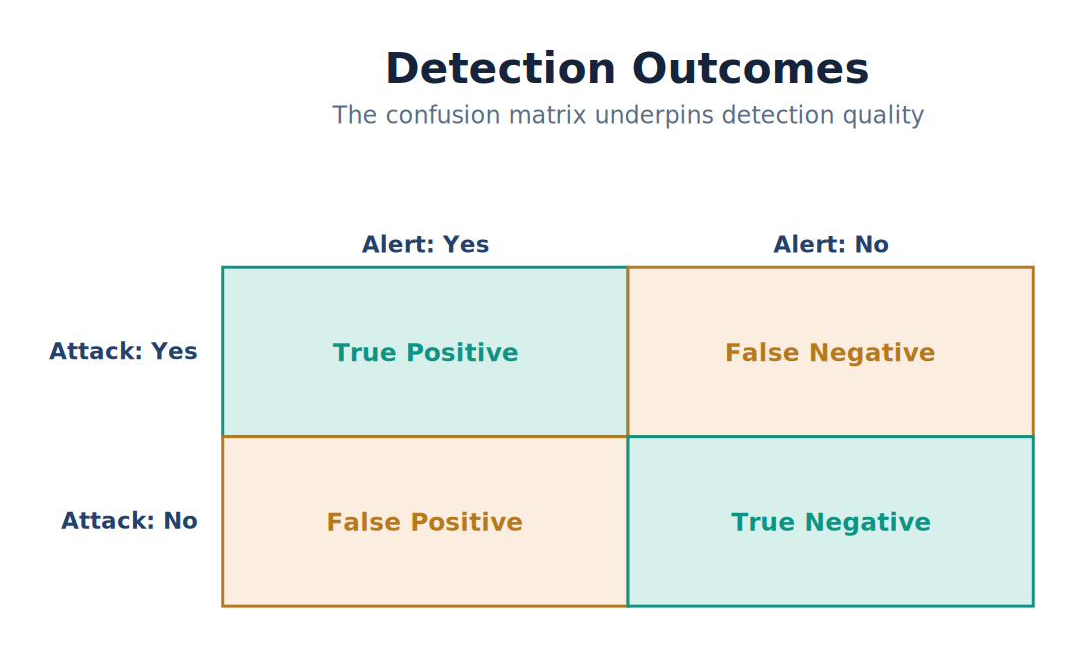
Note. The figure summarizes detection Outcomes and highlights the relationships among its principal elements, evidence sources, and analytical outcomes.
This simple matrix becomes one of the most important concepts in detection engineering.
Measuring Detection Quality
Good detections should demonstrate:
High true positive rate.
Low false positive rate.
Low false negative rate.
Useful analyst context.
Appropriate severity.
Quality matters more than quantity.
Validation Log
Every detection should include a validation record.
Example:
| Item | Result |
|---|---|
| XML Valid | Pass |
| Rule Loaded | Pass |
| Positive Test | Pass |
| Negative Test | Pass |
| Boundary Test | Pass |
| Documentation Updated | Pass |
| Peer Reviewed | Pass |
Professional SOCs maintain these records for every production detection.
Common Student Mistake
Students frequently stop testing after the first successful alert.
Professional engineers continue asking:
What if the process name changes?
What if the parent process changes?
What if PowerShell launches from another directory?
What if the event occurs hundreds of times?
Robust detections survive variation.
Chapter Exercise 5.4 — Detection Validation
Objective
Develop a comprehensive validation plan for the custom PowerShell rule created in Lab 5-1.
Test Matrix
| Test | Expected |
|---|---|
| PowerShell | Alert |
| Notepad | No Alert |
| CMD | No Alert |
| PowerShell ISE | Evaluate |
| PowerShell with EncodedCommand | Higher Severity |
| Repeated PowerShell | Consistent Alerts |
Students should record:
Alert count.
Rule ID.
Severity.
Unexpected behavior.
Recommended improvements.
Detection Validation Report
Each student submits:
Detection Name
Objective
Test Cases
Results
False Positives
False Negatives
Improvements
ATT&CK Mapping
Final Recommendation
Deploy?
Yes / No
Justify your decision using collected evidence.
Think Like a Detection Engineer
Imagine two organizations. Organization A creates hundreds of custom rules but never validates them. Organization B develops fewer rules but validates every detection using structured test plans, peer review, version control, and documented acceptance criteria.
Which organization is more likely to detect real attacks while avoiding analyst fatigue?
The answer illustrates a fundamental principle of Detection Engineering:
A detection is valuable only if its performance is understood.
Key Concepts
By the end of this section, you should understand that:
Detection validation is an engineering discipline.
Positive and negative testing are equally important.
XML validation does not guarantee correct detection logic.
Structured debugging is more effective than random changes.
Measuring false positives and false negatives is essential for improving detection quality.
Every production detection should have a documented validation plan and test history.
Looking Ahead
The next section, 5.5 Reducing False Positives Through Detection Tuning, focuses on one of the most challenging aspects of operating a mature SOC. Students will learn how to analyze noisy detections, identify common causes of false positives, apply filters and exclusions responsibly, tune alert severity based on operational context, and balance sensitivity against analyst workload. By the end of the section, they will understand that the objective of detection engineering is not to generate more alerts—but to generate fewer, higher-quality alerts that consistently direct analyst attention toward meaningful security events.
5.5 Reducing False Positives Through Detection Tuning
Learning Objectives
After completing this section, you should be able to:
Define false positives and false negatives.
Explain alert fatigue.
Identify common causes of noisy detections.
Tune Wazuh detections responsibly.
Balance sensitivity with specificity.
Develop a structured tuning methodology.
Measure improvements after tuning.
Introduction
Suppose your SOC generates:
- 250,000 alerts per day
Of those:
- 247,000 are routine administrator activity.
How useful are those alerts?
Not very. Now imagine a real ransomware attack occurs.
Will analysts notice?
Perhaps. Perhaps not. Important alerts become buried beneath routine activity. This problem is known as alert fatigue. One of the primary responsibilities of a Detection Engineer is reducing unnecessary alerts while preserving meaningful visibility.
What Is a False Positive?
A false positive occurs when detection logic incorrectly identifies benign activity as malicious or policy violating (Scarfone & Mell, 2007).
Examples include:
- Administrator launches PowerShell.
- System update downloads software.
- Backup software scans files.
- Security software performs scheduled maintenance.
The detection fired correctly according to its logic, but the underlying activity was expected.
Figure 5-22
False Positive
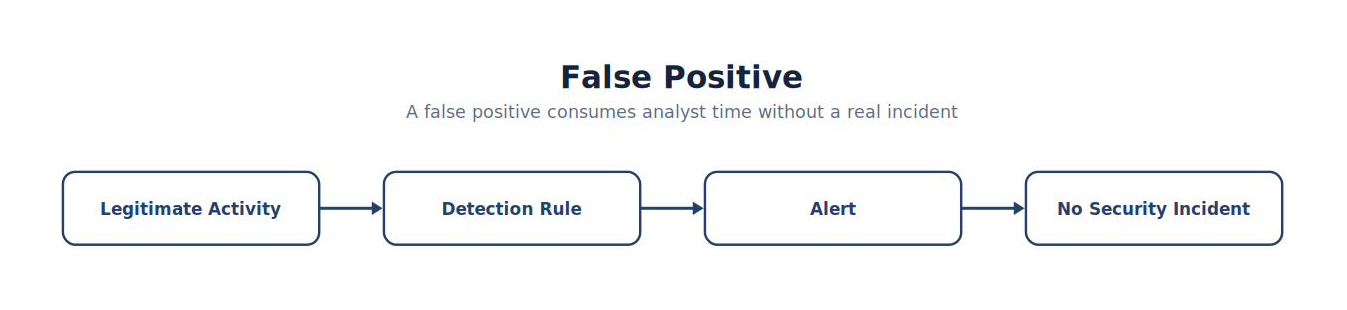
Note. The figure summarizes false Positive and highlights the relationships among its principal elements, evidence sources, and analytical outcomes.
False positives consume analyst time.
What Is a False Negative?
A false negative occurs when malicious or policy-violating activity is present but the detection does not alert (Scarfone & Mell, 2007).
Example:
Malicious Activity → No Alert → Incident Missed
False negatives are generally considered more dangerous because they allow attacks to continue unnoticed.
Balancing Detection
Detection Engineering is a balancing act.
Too sensitive:
Millions of Alerts → Analyst Fatigue → Missed Incidents
Too restrictive:
Very Few Alerts → Poor Visibility → Undetected Attacks
Neither extreme is desirable.
Figure 5-23
Detection Balance
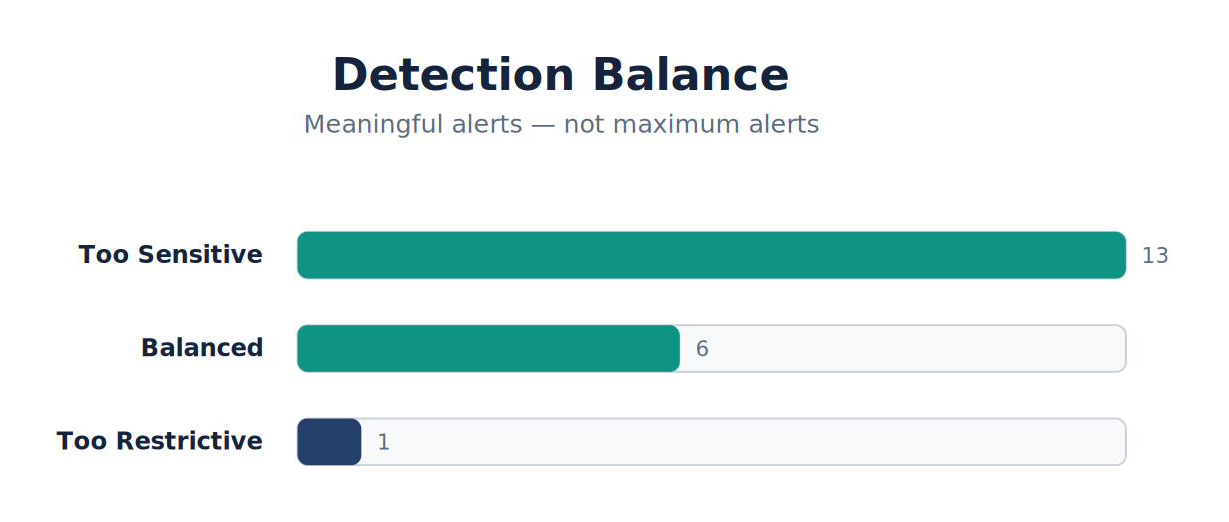
Note. The figure summarizes detection Balance and highlights the relationships among its principal elements, evidence sources, and analytical outcomes.
The objective is meaningful alerts—not maximum alerts.
Why False Positives Occur
False positives often result from rules that lack sufficient context.
Examples include:
| Detection | Problem |
|---|---|
| PowerShell | Used legitimately every day |
| Network Connections | Most are normal |
| DNS Queries | Constant activity |
| File Creation | Routine operating system behavior |
| Service Starts | Often expected |
The behavior itself is not unusual. Additional context is required.
Analyst Tradecraft Tip
A process is rarely suspicious by itself. A process combined with context may be suspicious. Detection quality improves as contextual information increases.
Adding Context
Suppose our original rule detects:
powershell.exe
Thousands of alerts occur daily.
Instead, consider:
Figure 5-24
From WINWORD.EXE to Outbound HTTP
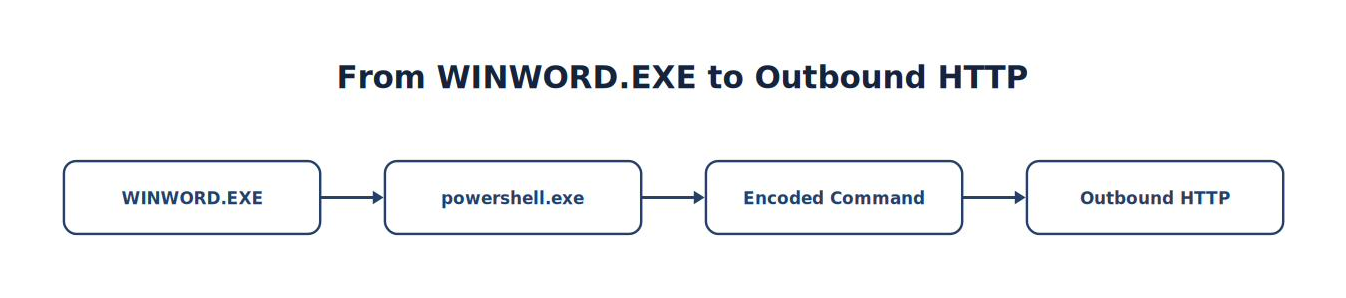
Note. The sequence traces how WINWORD.EXE progresses to Outbound HTTP, emphasizing the intermediate evidence and processing steps.
Alert volume decreases dramatically. Detection quality improves.
Common Context Sources
Additional context may include:
Parent process
Child process
User account
Time of day
Hostname
Destination IP
Command line
Frequency
Previous alerts
Each additional condition improves confidence.
Figure 5-25
Context Improves Detection
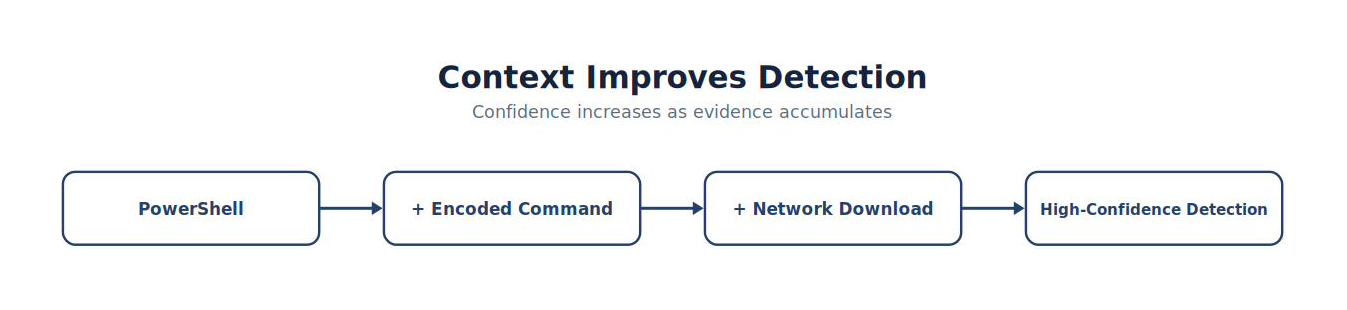
Note. The figure summarizes context Improves Detection and highlights the relationships among its principal elements, evidence sources, and analytical outcomes.
Confidence increases as evidence accumulates.
Exclusions
Sometimes legitimate activity should be excluded.
Examples:
Approved administrative scripts
Known backup software
Security scanning tools
Patch management systems
Domain Controllers performing expected authentication
However, every exclusion should be documented. Poorly designed exclusions create blind spots.
Responsible Exclusions
Bad exclusion:
Ignore all PowerShell.
Good exclusion:
Ignore PowerShell executed by:
Approved administrative account
Known management server
Approved maintenance window
Signed enterprise automation script
Specific exclusions reduce risk.
Severity Tuning
Not every alert deserves Level 12.
Consider:
| Activity | Suggested Level |
|---|---|
| PowerShell | 5 |
| Encoded PowerShell | 8 |
| Encoded PowerShell + Download | 10 |
| PowerShell + Defender Detection | 12 |
Severity should reflect both confidence and potential impact.
Frequency-Based Tuning
Repeated behavior may justify higher severity.
Example:
One failed login:
Low concern.
Twenty failed logins in one minute:
Possible brute-force attack. Frequency often distinguishes routine activity from suspicious behavior.
Figure 5-26
Frequency Detection
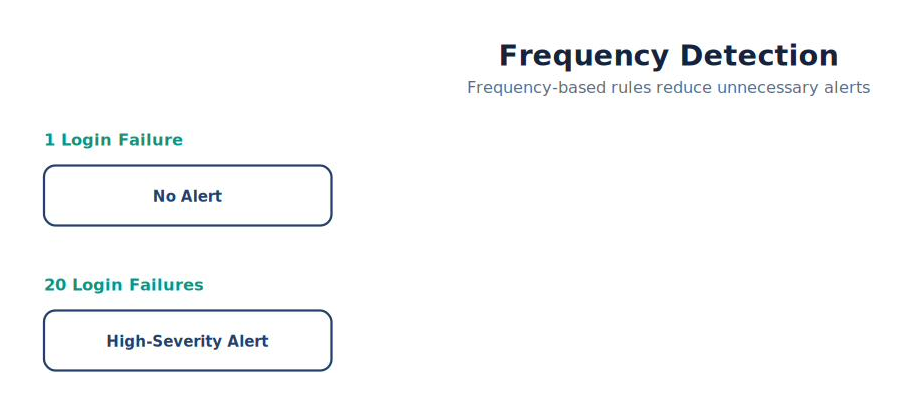
Note. The figure summarizes frequency Detection and highlights the relationships among its principal elements, evidence sources, and analytical outcomes.
Frequency-based rules reduce unnecessary alerts.
Time-Based Tuning
Context may include time.
Example:
Administrator PowerShell:
10:00 AM Monday
Expected.
Same activity:
3:15 AM Sunday
Potentially more interesting. Time alone never proves malicious activity, but it may influence analyst prioritization.
Asset Context
Not all systems deserve identical monitoring.
Example:
Student workstation:
Moderate concern.
Domain Controller:
High concern.
Payment database:
Critical concern. Identical behavior may justify different severities depending upon the affected asset.
User Context
Likewise, users differ.
Example:
Regular employee launches PowerShell. Unusual. System administrator launches PowerShell. Routine. Detection logic should consider organizational context whenever practical.
Measuring Improvement
Suppose tuning reduces alerts:
Before:
10,000 Alerts → 100 Useful
After:
800 Alerts → 95 Useful
The SOC now investigates nearly the same number of genuine security events while reviewing far fewer unnecessary alerts. That represents a significant operational improvement.
Common Student Mistake
Students often solve noisy detections by disabling the rule. This is rarely the correct solution.
Better options include:
Adding context
Adjusting severity
Creating targeted exclusions
Using correlation
Increasing confidence requirements
Good tuning preserves visibility while reducing noise.
Chapter Exercise 5.5 — Detection Tuning
Objective
Improve the custom PowerShell detection created earlier in the chapter.
Tasks
Generate normal PowerShell activity.
Generate encoded PowerShell activity.
Compare alert frequency.
Modify the rule to reduce unnecessary alerts.
Test:
Administrator account
Student account
Explorer-launched PowerShell
Word-launched PowerShell
Record:
| Scenario | Alert? | Appropriate? |
|---|---|---|
| Administrator | □ | □ |
| Student | □ | □ |
| Word → PowerShell | □ | □ |
| Encoded Command | □ | □ |
Students should justify every tuning decision.
Detection Tuning Worksheet
| Change | Reason | Expected Effect | Result |
|---|---|---|---|
| Added parent process condition | Reduce noise | Fewer alerts | ______ |
| Increased severity | Higher confidence | Better prioritization | ______ |
| Added approved account exclusion | Reduce false positives | Less analyst workload | ______ |
| Added network correlation | Increase confidence | More actionable alerts | ______ |
This worksheet encourages students to think like engineers rather than simply editing rules.
Think Like a Detection Engineer
Imagine your SOC manager asks:
“Why did you lower the number of alerts by 80%?”
A poor answer is:
“I disabled several rules.”
A professional answer is:
“We analyzed historical alert data, identified recurring false positives, introduced parent-process context, correlated endpoint and network telemetry, and implemented narrowly scoped exclusions for approved administrative activity. Validation testing showed that we retained detection of the targeted behaviors while significantly reducing analyst workload.” One response reduces visibility. The other improves detection quality. That distinction defines mature Detection Engineering.
Key Concepts
By the end of this section, you should understand that:
False positives reduce analyst effectiveness.
False negatives increase organizational risk.
Context is one of the most powerful tools for improving detections.
Exclusions should be specific, documented, and regularly reviewed.
Severity should reflect confidence and business impact.
Detection tuning is a continuous process driven by measurement and validation.
The goal of Detection Engineering is high-quality, actionable alerts, not simply more alerts.
Looking Ahead
The next section, 5.6 Advanced Detection Tuning and Rule Optimization, expands beyond individual rules to examine the performance of the detection program as a whole. Students will learn how to baseline alert volumes, analyze long-term trends, identify redundant detections, optimize rule execution order, build reusable detection logic, and use metrics such as precision, recall, mean time to detect (MTTD), and mean time to acknowledge (MTTA) to continuously improve SOC performance. By the end of the section, they will begin thinking not just about individual detections, but about the effectiveness of the entire detection ecosystem.
5.6 Advanced Detection Tuning and Rule Optimization
Learning Objectives
After completing this section, you should be able to:
Optimize detection quality across an entire SOC.
Measure detection performance using operational metrics.
Identify redundant or overlapping detections.
Develop a structured detection tuning program.
Prioritize detection improvements.
Maintain detection documentation.
Build a sustainable detection engineering process.
Introduction
Imagine inheriting a mature Security Operations Center.
It contains:
4,800 Wazuh rules
38,000 Suricata signatures
250 custom detections
1.8 million daily events
65,000 alerts every day
The question is no longer:
“Does this rule work?”
The question becomes:
“Is our entire detection program operating effectively?” Managing detections at scale requires engineering discipline.
Detection Engineering Is Continuous
Many beginning analysts assume that a detection is finished after deployment. Professional SOCs know otherwise. Every detection follows a continuous improvement cycle.
Figure 5-27
Continuous Detection Improvement
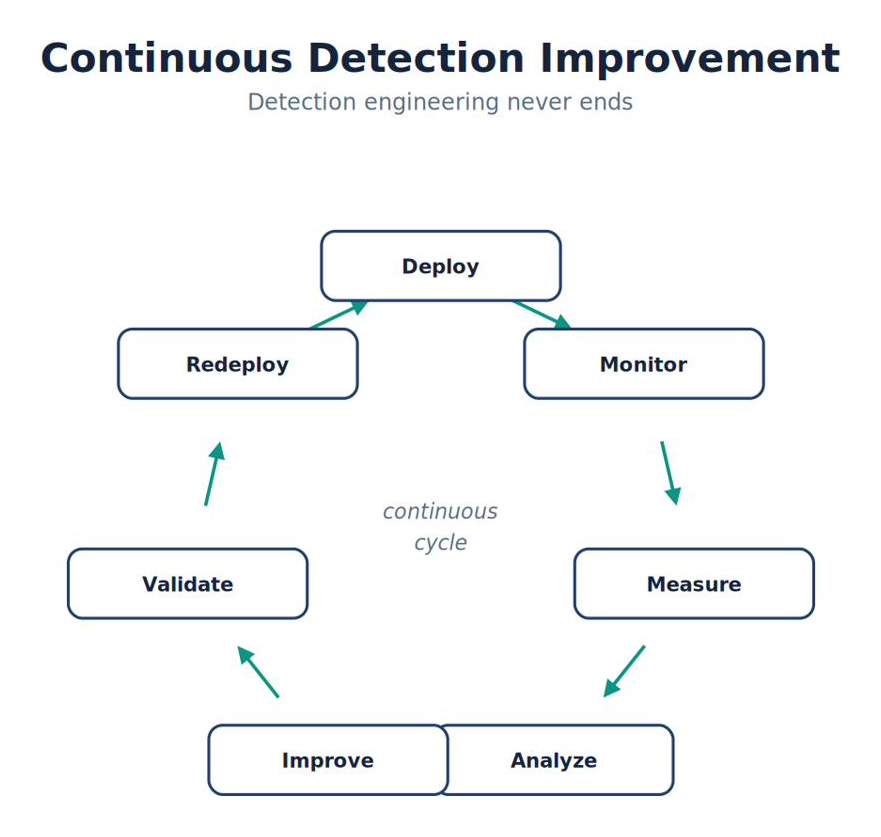
Note. The figure summarizes continuous Detection Improvement and highlights the relationships among its principal elements, evidence sources, and analytical outcomes.
Detection engineering never ends.
Building a Detection Inventory
Every mature SOC maintains an inventory of detections.
Example:
| Rule ID | Name | ATT&CK | Status | Last Tested |
|---|---|---|---|---|
| 100001 | PowerShell | T1059.001 | Production | 2026-09-15 |
| 100002 | Encoded PowerShell | T1059.001 | Production | 2026-09-16 |
| 100003 | Office→PowerShell | T1059.001 | Testing | 2026-09-16 |
This inventory allows engineers to:
Track ownership
Schedule reviews
Validate upgrades
Identify obsolete rules
Analyst Tradecraft Tip
If your SOC cannot answer:
“Who owns this rule?”
or
“When was it last tested?” then the detection is effectively unmanaged. Every production detection should have an identified owner and documented review history.
Measuring Detection Performance
Detection quality should be measured.
Possible metrics include:
| Metric | Purpose |
|---|---|
| Alerts Generated | Workload |
| True Positives | Detection quality |
| False Positives | Noise |
| False Negatives | Detection gaps |
| Precision | Alert accuracy |
| Recall | Detection completeness |
| MTTD | Mean Time To Detect |
| MTTA | Mean Time To Acknowledge |
| MTTR | Mean Time To Respond |
Metrics allow objective improvement.
Precision
Precision asks:
Of all alerts generated, how many were actually useful?
Example:
100 alerts
80 legitimate
20 false positives
Precision:
80%
Improving precision reduces analyst fatigue.
Recall
Recall asks:
How many attacks did we successfully detect?
Example:
20 simulated attacks
18 detected
Recall:
90%
Improving recall reduces detection gaps.
Figure 5-28
Precision and Recall
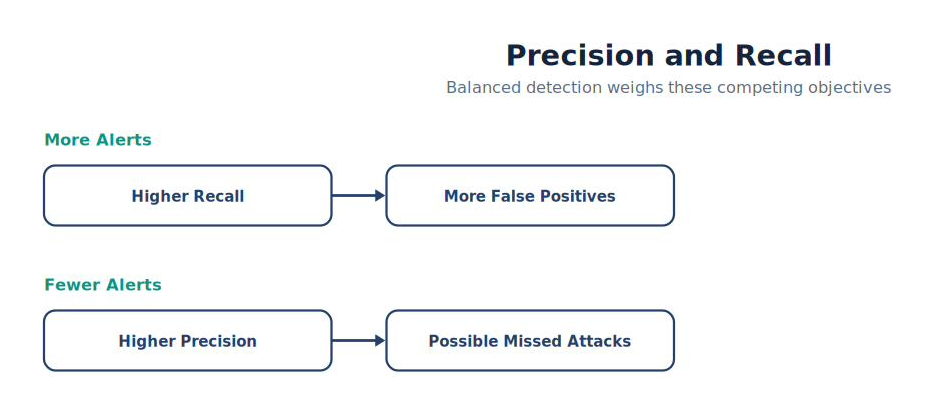
Note. The figure summarizes precision and Recall and highlights the relationships among its principal elements, evidence sources, and analytical outcomes.
Detection engineering constantly balances these competing objectives.
Mean Time to Detect (MTTD)
MTTD measures:
How quickly does the SOC recognize suspicious activity?
Example:
Attack begins:
10:00
Alert generated:
10:03
MTTD:
3 minutes
Reducing MTTD is a primary goal of modern SOCs.
Mean Time to Acknowledge (MTTA)
MTTA measures:
How quickly does an analyst begin investigating?
Example:
Alert:
10:03
Analyst assigned:
10:08
MTTA:
5 minutes
Good detections help reduce MTTA because analysts trust them.
Mean Time to Respond (MTTR)
MTTR measures:
How quickly is the incident contained?
Example:
Alert:
10:03
Containment:
10:24
MTTR:
21 minutes
Detection quality directly influences response time.
Redundant Detections
Multiple rules may detect identical behavior.
Example:
Rule A:
PowerShell
Rule B:
Process Creation
Rule C:
Encoded PowerShell
Rule D:
PowerShell Download
Some overlap is useful. Excessive duplication creates unnecessary alerts. Detection engineers regularly review overlapping detections.
Rule Lifecycle Management
Every production rule should move through a formal lifecycle.
Figure 5-29
Rule Lifecycle
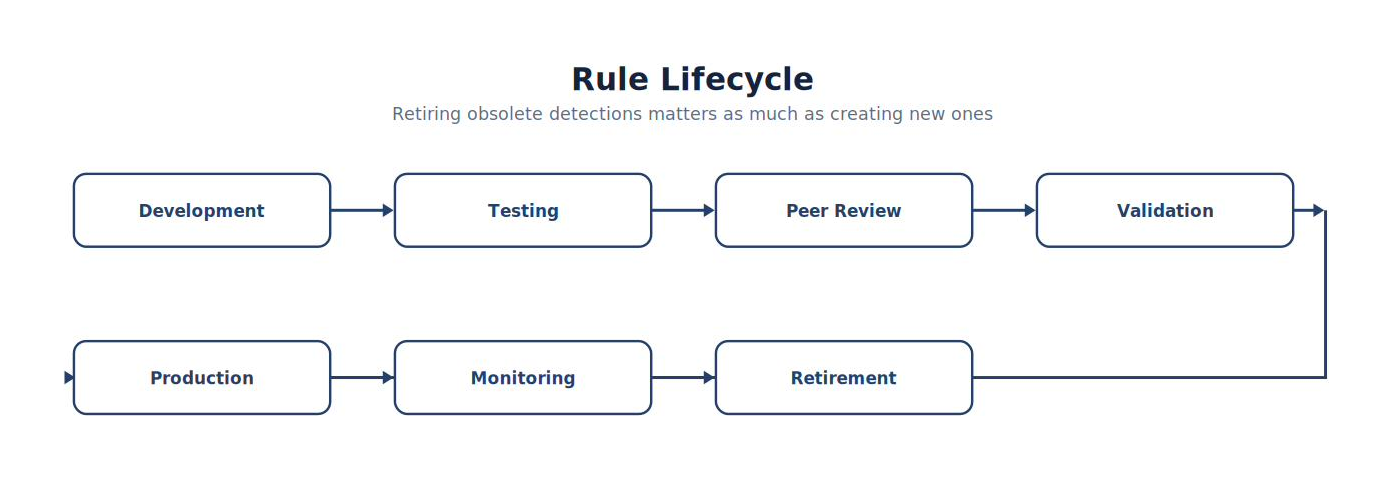
Note. The workflow presents the ordered stages of rule Lifecycle and highlights the validation and feedback steps that make the process repeatable.
Retiring obsolete detections is just as important as creating new ones.
Version Control
Detection logic changes over time. Version every production rule.
Example:
| Version | Change |
|---|---|
| 1.0 | Initial Release |
| 1.1 | Reduced false positives |
| 1.2 | Added ATT&CK mapping |
| 2.0 | Added Suricata correlation |
Maintaining a history allows engineers to understand why changes were made.
Detection Reviews
Schedule periodic reviews.
Suggested review questions:
Does this detection still provide value?
Is it producing excessive false positives?
Has ATT&CK changed?
Has attacker behavior evolved?
Does the business still require this detection?
Has supporting telemetry changed?
Every production rule should be reviewed regularly.
Common Student Mistake
Students often believe that a working detection should never be modified. Professional engineers understand that environments change. Applications change. Users change. Attackers change. Therefore, detections must evolve.
Detection Quality Dashboard
A mature SOC might monitor:
| Metric | Target |
|---|---|
| False Positive Rate | <10% |
| Validation Frequency | Quarterly |
| ATT&CK Coverage | Increasing |
| Peer Review | 100% |
| Documentation | Complete |
| Rule Ownership | Assigned |
| Testing Status | Current |
These measurements allow management to evaluate the health of the detection program.
Engineering Documentation
Every detection should include:
Purpose
Business justification
ATT&CK mapping
Author
Owner
Validation procedure
Test cases
Version history
Known limitations
Planned improvements
Documentation enables long-term maintenance.
Chapter Exercise 5.6 — Detection Quality Assessment
Objective
Evaluate your custom PowerShell detection as though it were a production enterprise rule.
Tasks
Review one week of generated alerts.
Classify each alert:
True Positive
False Positive
Benign Administrative Activity
Calculate:
Precision
Estimated Recall (using controlled lab exercises)
Recommend improvements.
Update the detection documentation.
Present findings to another student for peer review.
Detection Scorecard
| Category | Score (1–5) |
|---|---|
| Accuracy | □ |
| Precision | □ |
| Recall | □ |
| Documentation | □ |
| ATT&CK Mapping | □ |
| Validation | □ |
| Maintainability | □ |
| Operational Value | □ |
Students should justify every score with evidence.
Analyst Tradecraft Tip
Treat detections like software.
Good software is:
Tested
Reviewed
Versioned
Documented
Maintained
Good detections require exactly the same discipline.
Think Like a Detection Engineer
Imagine your SOC manager asks:
“Which of our detections provides the greatest value?”
The correct answer is not:
“The one that generates the most alerts.”
It is:
“The one that consistently identifies meaningful attacker behavior with minimal false positives, has documented validation results, is mapped to MITRE ATT&CK, is actively maintained, and provides analysts with actionable context.” That answer reflects engineering maturity rather than technical enthusiasm.
Key Concepts
By the end of this section, you should understand that:
Detection engineering extends beyond writing individual rules.
Mature SOCs manage detections as a governed engineering program.
Metrics such as precision, recall, MTTD, MTTA, and MTTR enable objective improvement.
Every production detection should have an owner, documentation, validation history, and scheduled reviews.
Detection quality improves through continuous measurement, tuning, peer review, and lifecycle management.
Looking Ahead
The next chapter, 5.7 Developing Local Suricata Rules, expands detection engineering beyond endpoint telemetry into the network. Students will learn the anatomy of a Suricata signature, understand rule headers and options, write local signatures for common attack patterns, validate detections using packet captures, tune signatures to reduce false positives, and integrate Suricata alerts into Wazuh for unified correlation. By combining endpoint detections with network signatures, students will begin constructing multi-layered detections that significantly increase confidence and resilience against modern attacker techniques. This marks the beginning of defense in depth through detection engineering—a recurring theme throughout the remainder of the textbook.
5.7 Developing Local Suricata Rules
Learning Objectives
After completing this section, you should be able to:
Explain how Suricata evaluates packets.
Understand the anatomy of a Suricata signature.
Develop local detection rules.
Assign Signature IDs (SIDs) correctly.
Validate custom signatures.
Generate traffic to test detections.
Integrate custom Suricata alerts into Wazuh.
Tune signatures to reduce false positives.
Introduction
Unlike endpoint detections, which monitor activity occurring on a host, network detections observe communication between systems. This distinction is important. An attacker may successfully evade endpoint monitoring on one computer. However, network communication must still occur. Packets cannot hide. Network Detection and Response (NDR) technologies such as Suricata therefore provide an independent source of visibility that complements endpoint monitoring. Detection Engineers frequently develop both endpoint and network detections to improve confidence.
Why Write Custom Network Rules?
Emerging Threats Open provides tens of thousands of signatures.
Why create additional ones?
Because every organization is unique.
Examples include:
Detecting prohibited applications
Monitoring internal web applications
Identifying policy violations
Detecting connections to laboratory systems
Monitoring sensitive servers
Detecting organization-specific attack simulations
Custom signatures allow defenders to monitor activity that public rules were never designed to detect.
Figure 5-30
Multi-Layer Detection
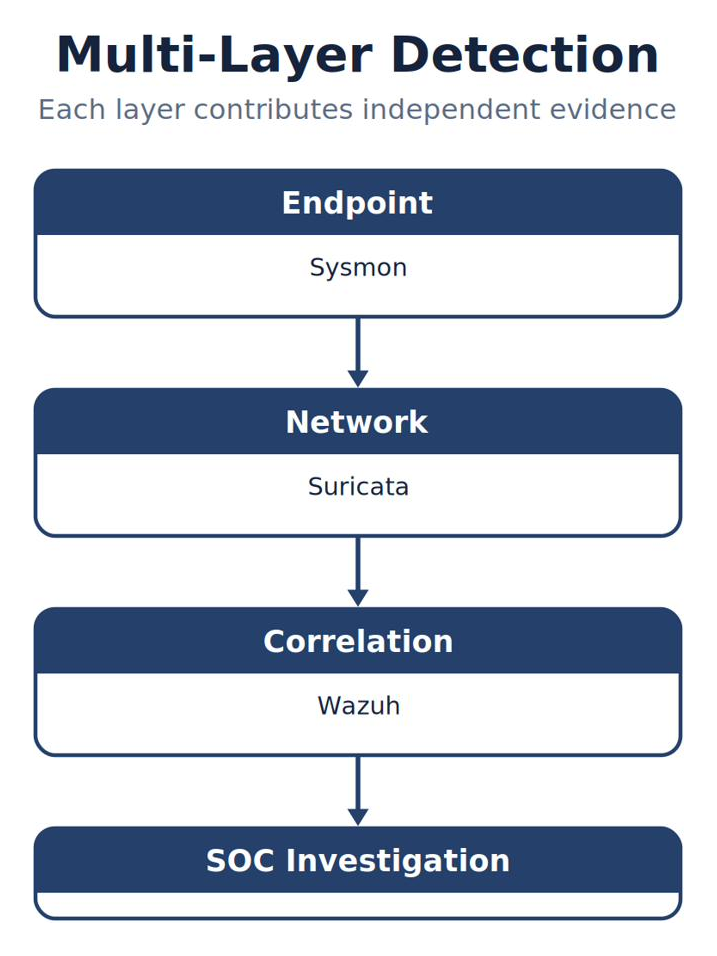
Note. The figure summarizes multi-Layer Detection and highlights the relationships among its principal elements, evidence sources, and analytical outcomes.
Each layer contributes independent evidence.
How Suricata Processes Traffic
Every packet entering the monitored interface follows a predictable path.
Figure 5-31
Packet Processing Pipeline
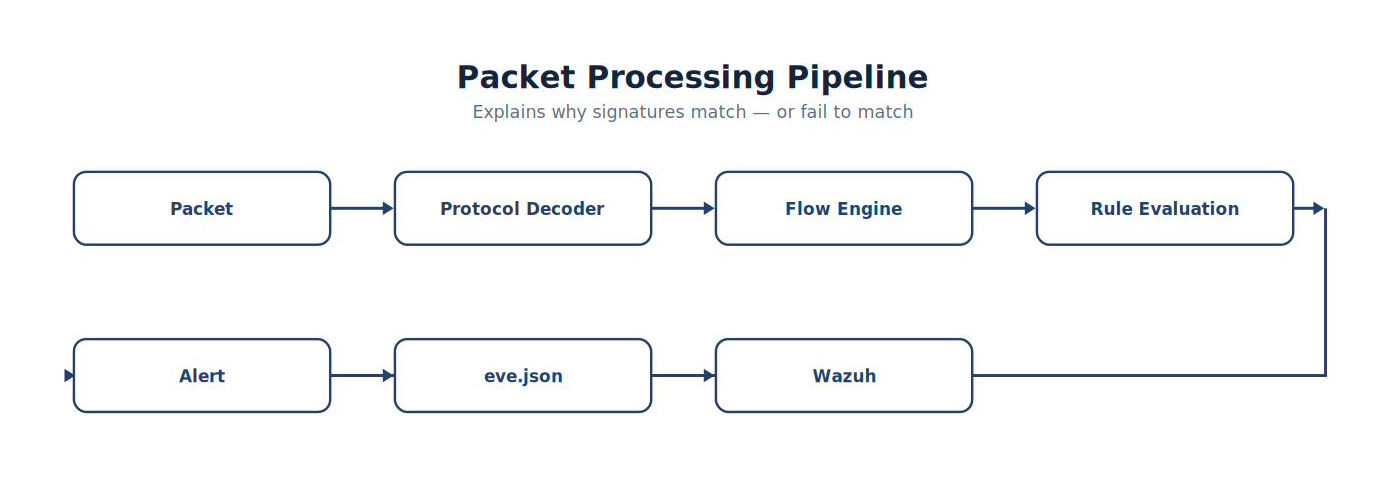
Note. The pipeline shows how information moves through packet Processing Pipeline, from its source through processing to the analyst-visible result.
Understanding this pipeline helps explain why signatures match—or fail to match.
Anatomy of a Suricata Rule
Every Suricata rule contains two major components:
Header
Options
The header defines:
Action
Protocol
Source
Direction
Destination
The options define:
What to inspect
What conditions must match
What alert should be generated
Simplified Rule Example
alert http any any -> any any ( msg:“Local Detection - Suspicious User-Agent”; content:“curl/”; sid:1000001; rev:1; )
Students should focus first on understanding what the rule accomplishes before memorizing syntax.
Analyst Tradecraft Tip
Do not memorize rule syntax. Understand the logic.
Ask yourself:
What behavior am I trying to detect?
The rule simply expresses that logic.
Rule Header
The header answers five questions.
| Component | Purpose |
|---|---|
| Action | What should Suricata do? |
| Protocol | Which protocol? |
| Source | Who sent the traffic? |
| Direction | Which way is traffic flowing? |
| Destination | Who received it? |
These fields determine where the rule applies.
Rule Options
Options determine what must match.
Examples include:
Message
Content
Flow direction
HTTP method
URI
User-Agent
DNS query
TLS SNI
SID
Revision
Options provide the detection logic.
Figure 5-32
Rule Structure
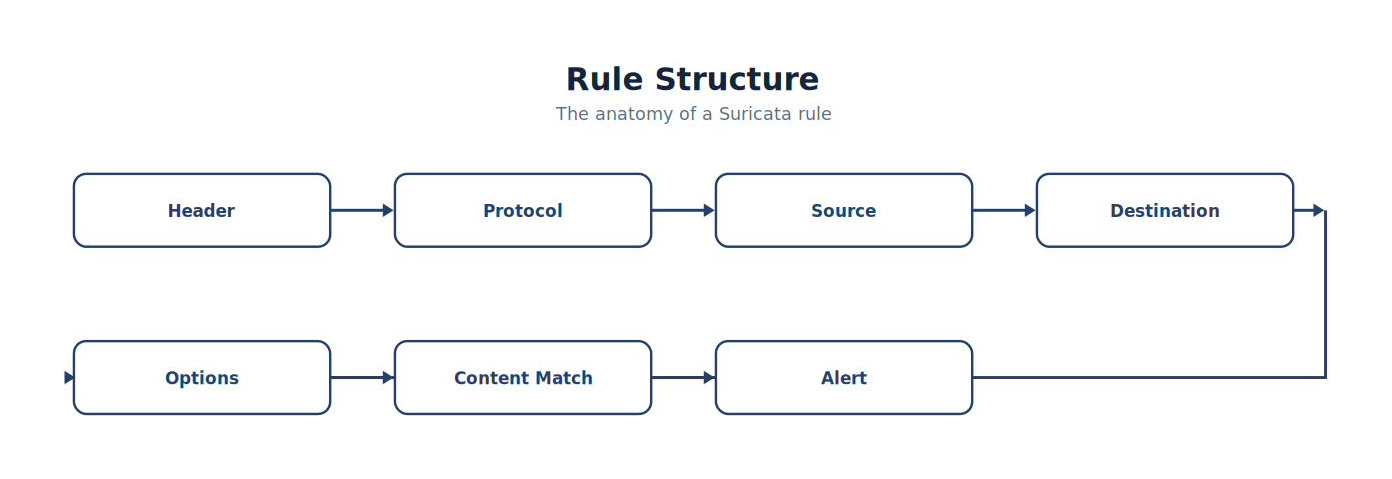
Note. The figure organizes the major elements of rule Structure to clarify their roles, relationships, and escalation or inheritance paths.
Signature IDs (SIDs)
Every signature requires a unique SID. Vendor signatures already occupy large portions of the available namespace. Organizations should reserve their own SID range for local rules.
Example policy:
| SID Range | Purpose |
|---|---|
| Vendor | Reserved |
| Local Enterprise | 1,000,000+ |
| Student Laboratory | Defined by instructor |
The important principle is consistency and documentation.
Rule Revisions
Every rule should include a revision number.
Example:
rev:1
When improving the detection:
rev:2
Revision history allows engineers to track changes over time.
Writing the First Signature
Objective:
Detect the use of the curl command against the laboratory web server.
Behavior:
HTTP request → User-Agent contains:
curl/
Detection:
Generate an alert. Notice that we defined the behavior before writing the signature.
Validating the Rule
After creating the rule:
Validate the configuration.
Restart Suricata.
Confirm the service starts successfully.
Generate test traffic.
Verify an alert appears.
Validation should become routine.
Test Traffic
Generate:
UB2604 · Terminal
curl http://testmyids.comExpected result:
Packet observed
Signature matches
Alert written to eve.json
Wazuh ingests the alert
Dashboard displays the event
The complete detection pipeline should be verified.
Figure 5-33
Signature Validation
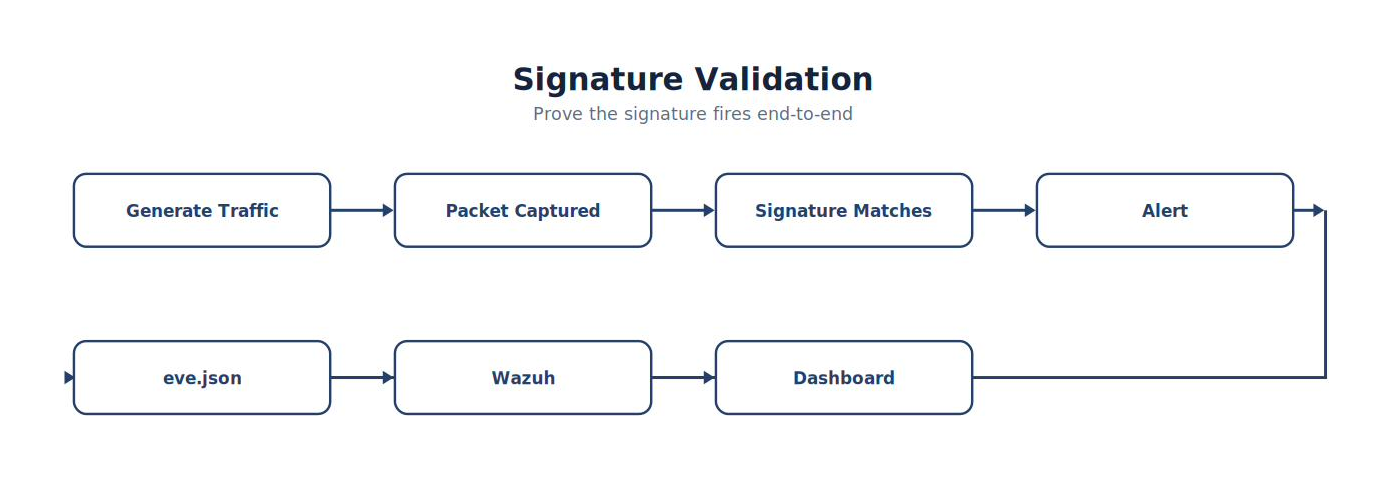
Note. The figure summarizes signature Validation and highlights the relationships among its principal elements, evidence sources, and analytical outcomes.
Correlating with Wazuh
Suppose the Windows endpoint executes:
curl.exe
Possible telemetry:
| Technology | Observation |
|---|---|
| Sysmon | Process creation |
| Sysmon | DNS query |
| Suricata | HTTP request |
| Wazuh | Correlated alert |
Now the investigation contains both endpoint and network evidence.
Improving the Detection
The first rule may be too broad.
Questions to ask:
Should it inspect only outbound traffic?
Should it apply only to laboratory systems?
Should internal update servers be excluded?
Should only HTTP GET requests be examined?
Should specific User-Agent values be ignored?
These refinements reduce unnecessary alerts.
Common Student Mistake
Students often write signatures that match every packet containing a common string.
Example:
Detect:
GET
Almost every web request contains GET. The result is an overwhelming number of alerts. Good signatures focus on specific, meaningful behaviors.
Detection Engineering Best Practices
Before deploying any Suricata rule:
Clearly define the behavior.
Test with expected traffic.
Test with unrelated traffic.
Verify no duplicate alerts occur.
Record the SID and revision.
Map the detection to MITRE ATT&CK when appropriate.
Document assumptions and limitations.
Lab Exercise 5-5 — Building Your First Suricata Signature
Objective
Create a local Suricata signature that detects a specific laboratory HTTP behavior and validate its integration with Wazuh.
Tasks
Identify the target behavior.
Develop a local signature.
Validate the configuration.
Restart Suricata.
Generate test traffic.
Verify:
Suricata alert
eve.json entry
Wazuh alert
Document:
SID
Revision
Behavior detected
ATT&CK mapping (if applicable)
False-positive observations
Signature Development Worksheet
| Item | Value |
|---|---|
| Detection Objective | __________________ |
| Protocol | __________________ |
| Behavior | __________________ |
| SID | __________________ |
| Revision | __________________ |
| Test Passed | □ |
| Wazuh Alert Verified | □ |
| ATT&CK Mapping | __________________ |
Think Like a Detection Engineer
Imagine two engineers write signatures for the same behavior.
Engineer A
Matches every HTTP request.
Generates thousands of alerts.
Engineer B
Matches a narrowly defined behavior.
Produces very few false positives.
Is fully documented.
Includes a revision history.
Is mapped to MITRE ATT&CK.
Has been validated with packet captures and endpoint telemetry.
Both signatures function. Only one is suitable for production. Professional detection engineering is measured not by the number of signatures written, but by the reliability, maintainability, and operational value of those signatures.
Key Concepts
By the end of this section, you should understand that:
Suricata signatures describe network behaviors rather than endpoint events.
Every signature consists of a header and detection options.
Custom signatures should use a documented local SID range and revision history.
Detection engineering begins with defining behavior—not writing syntax.
Every signature should be validated with live traffic and correlated with Wazuh when possible.
High-quality network detections complement endpoint telemetry and improve investigative confidence.
Looking Ahead
The next section, 5.8 Multi-Source Correlation Rules, is where the endpoint and network worlds come together. Students will design detections that require evidence from multiple independent sensors—for example, a Sysmon PowerShell event followed by a Suricata HTTP download within a defined time window. They will learn how to construct layered detections that dramatically reduce false positives while increasing analyst confidence. This is the point where students begin designing enterprise-grade detections rather than individual rules, bringing together everything they have learned about Wazuh, Sysmon, Suricata, ATT&CK, and evidence-based detection engineering.
5.8 Multi-Source Correlation Rules
Learning Objectives
After completing this section, you should be able to:
Explain why correlated detections outperform single-event detections.
Design multi-source detection logic.
Correlate endpoint and network telemetry.
Reduce false positives using behavioral sequencing.
Develop enterprise-quality detection strategies.
Document complex detections.
Measure improvements over single-event rules.
Introduction
Suppose a SOC generates an alert every time PowerShell starts.
How many alerts occur every day?
Potentially thousands.
Now suppose the SOC alerts only when all of the following occur:
PowerShell executes
DNS lookup occurs
HTTP download follows
Executable written to disk
Suricata detects suspicious traffic
Alert volume decreases dramatically. Confidence increases dramatically. Nothing changed about the PowerShell event. The detection became smarter.
Why Correlation Matters
Imagine interviewing witnesses.
Witness #1:
“I saw someone running.”
Witness #2:
“I heard glass breaking.”
Witness #3:
“I saw someone carrying a laptop.” Individually, none of these observations prove a burglary. Together, they describe a much more compelling sequence. Security telemetry behaves exactly the same way.
Figure 5-34
Correlation Improves Confidence
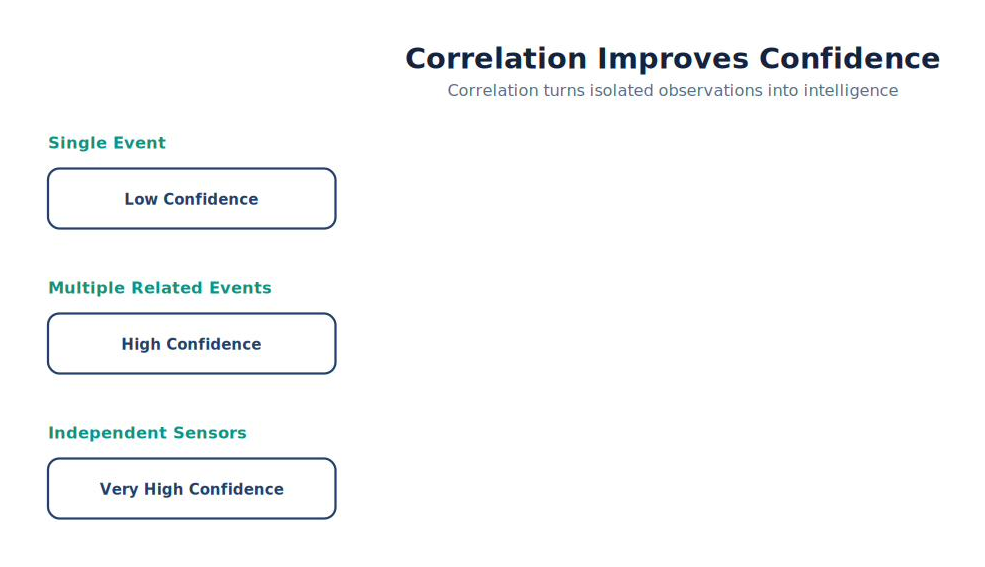
Note. The figure summarizes correlation Improves Confidence and highlights the relationships among its principal elements, evidence sources, and analytical outcomes.
Correlation transforms isolated observations into actionable intelligence.
Single-Source Detection
Example:
Sysmon reports:
PowerShell.exe
Useful?
Yes.
Conclusive?
No. PowerShell is widely used for legitimate administration.
Multi-Source Detection
Now consider:
Figure 5-35
From Sysmon to Wazuh Correlation
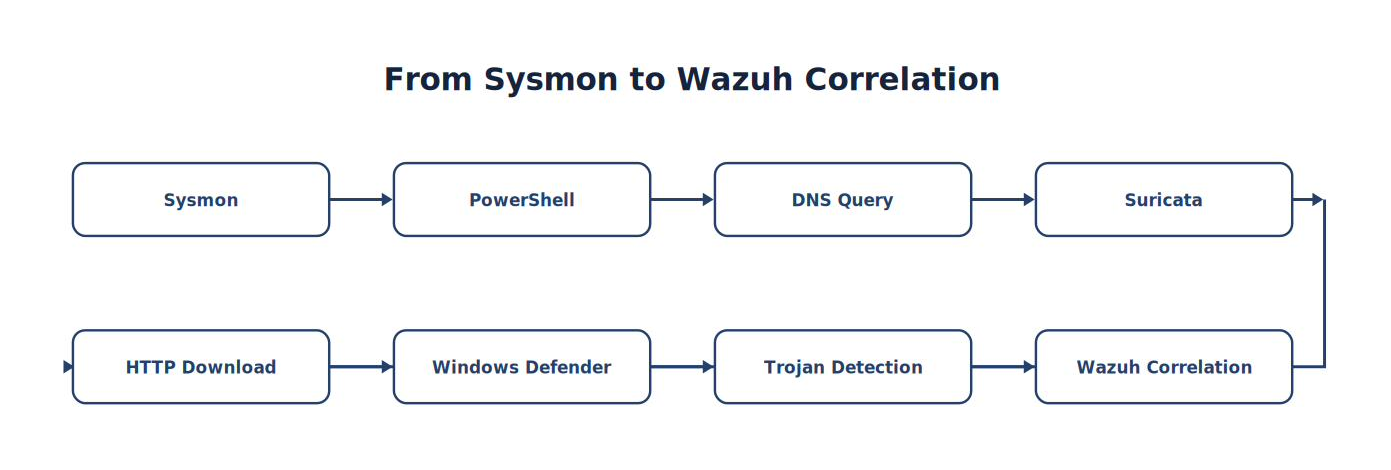
Note. The sequence traces how Sysmon progresses to Wazuh Correlation, emphasizing the intermediate evidence and processing steps.
Now four independent technologies describe the same activity. Confidence is substantially higher.
Analyst Tradecraft Tip
One strong detection from four independent sensors is almost always more valuable than four weak detections from the same sensor. Independent corroboration is the foundation of reliable investigations.
Correlation Dimensions
Events may be correlated using several dimensions.
| Dimension | Example |
|---|---|
| Time | Within five minutes |
| Host | Same endpoint |
| User | Same account |
| Process | Parent-child relationship |
| Network | Same destination |
| File | Same executable |
| Rule | Related detections |
Professional detections often combine several of these dimensions simultaneously.
Time Correlation
Example:
Figure 5-36
Investigation Timeline — Correlated Sysmon Events
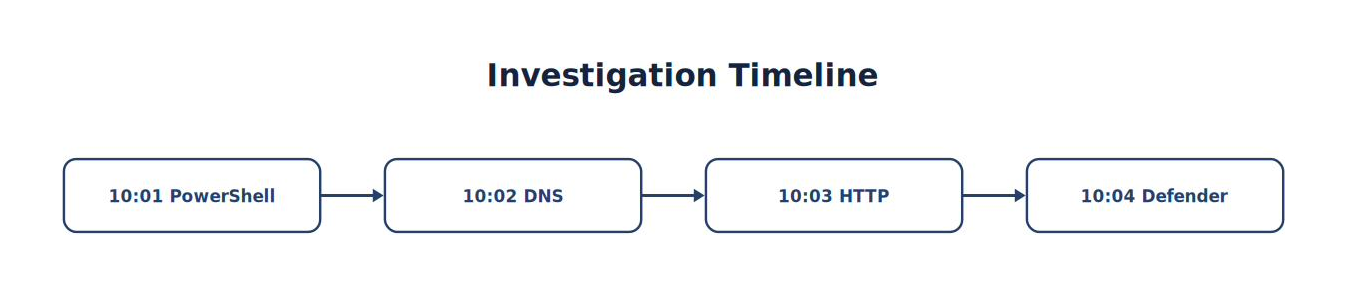
Note. The timeline places the events associated with investigation Timeline — Correlated Sysmon Events in chronological order to support reconstruction, correlation, and defensible conclusions.
This sequence is much more meaningful than identical events separated by several days.
Host Correlation
Events occurring on the same endpoint are often related.
Example:
Figure 5-37
From WIN11 to Scheduled Task
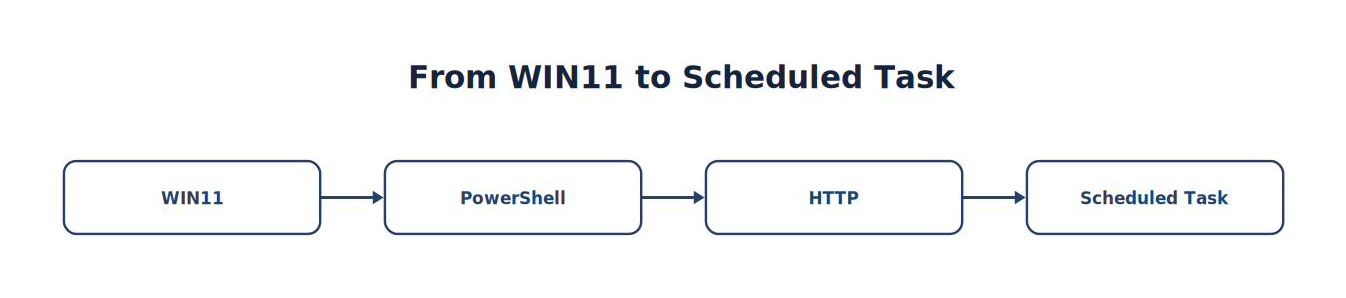
Note. The sequence traces how WIN11 progresses to Scheduled Task, emphasizing the intermediate evidence and processing steps.
Host context improves investigative confidence.
User Correlation
Suppose one user performs:
PowerShell
Encoded commands
Credential dumping
The user account provides another valuable correlation point. Identity frequently links otherwise unrelated events.
Process Correlation
Parent-child relationships are especially valuable.
Example:
Figure 5-38
From WINWORD.EXE to curl.exe
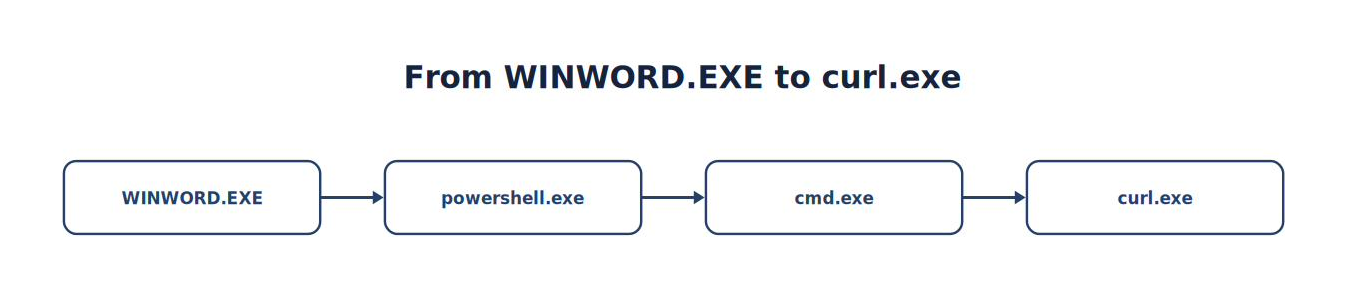
Note. The sequence traces how WINWORD.EXE progresses to curl.exe, emphasizing the intermediate evidence and processing steps.
One process launching another often reveals attacker workflow.
Figure 5-39
Behavioral Chain

Note. The figure summarizes behavioral Chain and highlights the relationships among its principal elements, evidence sources, and analytical outcomes.
Notice that this diagram describes behavior, not malware (MITRE Corporation, n.d.-a).
Network Correlation
Endpoint telemetry may indicate:
PowerShell
Network telemetry indicates:
HTTP download. Neither alone proves compromise. Together, they significantly strengthen the investigation.
Building Correlation Rules
Detection engineers should begin by describing behavior.
Example:
Objective:
Detect suspicious script-driven downloads.
Possible sequence:
Sysmon Event ID 1
PowerShell
DNS lookup
HTTP GET
Executable download
Defender alert
Only afterward should implementation begin.
Correlation Example
Suppose we define:
Behavior:
PowerShell
AND
DNS
AND
HTTP
Within 120 Seconds
Alert:
High Severity
This detection is substantially more reliable than alerting on PowerShell alone.
ATT&CK Correlation
Behavioral sequences often map naturally to ATT&CK.
| Activity | ATT&CK |
|---|---|
| PowerShell | T1059.001 |
| DNS Communication | T1071.004 (when used for C2) |
| HTTP Download | T1105 |
| Scheduled Task | T1053 |
| Persistence | Multiple techniques |
Rather than mapping individual alerts, students begin mapping attack progression.
Designing Enterprise Detections
A mature detection should answer:
What behavior?
Which telemetry?
Which sensors?
Which ATT&CK techniques?
Which confidence level?
Which severity?
Which response?
These questions guide professional rule development.
Figure 5-40
Detection Engineering Workflow
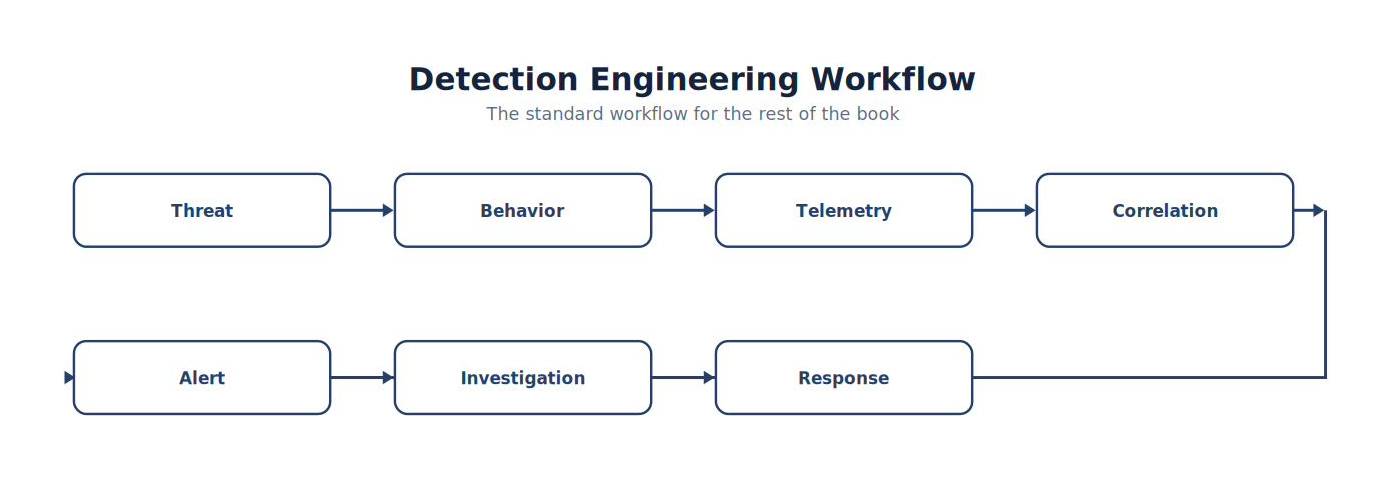
Note. The workflow presents the ordered stages of detection Engineering Workflow and highlights the validation and feedback steps that make the process repeatable.
This workflow becomes the standard throughout the remainder of the textbook.
Measuring Correlation Effectiveness
Suppose two rules exist.
Rule A:
PowerShell.
Rule B:
PowerShell
DNS
HTTP
Defender
Which produces:
fewer alerts?
higher confidence?
lower analyst workload?
Almost always, Rule B. Correlation improves operational efficiency (Kent & Souppaya, 2006).
Common Student Mistake
Students frequently create:
One Rule → One Alert → One Investigation
Professional Detection Engineers create:
Many Events → One Correlated Alert → One Investigation
Reducing duplicate investigations saves significant analyst time.
Chapter Exercise 5.7 — Multi-Source Detection Engineering
Objective
Design and validate a correlated detection using endpoint and network telemetry.
Scenario
Generate the following sequence:
Launch PowerShell.
Perform a DNS lookup.
Download a file using curl.
Generate Suricata HTTP traffic.
Reuse the controlled EICAR procedure from Lab 0A — EICAR, YARA, Microsoft Defender, and Wazuh Validation (EICAR, n.d.).
Observe Defender quarantine.
Verify Wazuh receives all telemetry.
Student Tasks
Create a behavioral diagram showing the complete attack sequence. Complete the following matrix.
| Event | Source | ATT&CK | Time |
|---|---|---|---|
| PowerShell | Sysmon | T1059.001 | ____ |
| DNS | Sysmon | T1071.004* | ____ |
| HTTP | Suricata | T1105 | ____ |
| Defender | Defender | Supporting Evidence | ____ |
| Wazuh | Correlation | Multiple | ____ |
*Map to T1071.004 only if the DNS activity is part of malicious command-and-control behavior; explain your reasoning.
Correlation Engineering Worksheet
| Component | Completed |
|---|---|
| Behavior Defined | □ |
| Telemetry Verified | □ |
| Sysmon Evidence | □ |
| Suricata Evidence | □ |
| Defender Evidence | □ |
| Wazuh Correlation | □ |
| ATT&CK Mapping | □ |
| Validation Complete | □ |
| Documentation Updated | □ |
Students should retain this worksheet as part of their detection engineering portfolio.
Detection Review Questions
Before deploying any correlated detection, ask:
Does each event contribute meaningful evidence?
Could any condition be removed without reducing confidence?
Are the events truly related, or merely coincidental?
What time window is appropriate?
Which conditions are mandatory?
Could this rule generate duplicate alerts?
How will analysts investigate this detection?
These questions help distinguish thoughtful engineering from simple rule accumulation.
Analyst Tradecraft Tip
A mature SOC strives to alert on behaviors, not events.
Events answer:
What happened?
Behavior answers:
What is the attacker trying to accomplish?
Behavior-centric detections are generally more resilient to changes in malware, infrastructure, and tooling (MITRE Corporation, n.d.-a).
Think Like a Detection Engineer
Imagine an executive asks:
“Why did alert volume decrease by 70% after your new correlation rules were deployed?”
A weak answer is:
“We removed a lot of alerts.”
A professional answer is:
“We consolidated related endpoint and network events into single, high-confidence detections. Analysts now investigate one correlated incident instead of several isolated alerts. This reduced duplicate investigations while preserving the underlying telemetry needed for forensic analysis.” That distinction captures the philosophy of enterprise detection engineering.
Key Concepts
By the end of this section, you should understand that:
Correlated detections provide greater confidence than isolated alerts.
Multi-source evidence significantly reduces false positives.
Effective correlation considers time, host, user, process, and network context.
Detection engineering focuses on attacker behaviors rather than individual events.
High-quality correlated detections reduce analyst workload while improving investigative accuracy.
Behavioral correlation forms the foundation for advanced threat hunting, automated response, and modern SOC operations.
Looking Ahead
The final sections of Chapter 5 move beyond creating individual rules and focus on measuring the effectiveness of the detection program as a whole. Students will build dashboards to track detection quality, evaluate ATT&CK coverage over time, conduct peer reviews of custom detections, and complete a capstone project in which they design, implement, validate, document, and present a production-quality detection package. This capstone mirrors the workflow used by enterprise Detection Engineering teams and prepares students for real-world SOC roles where engineering discipline, documentation, testing, and collaboration are as important as technical skill.
5.9 Measuring Detection Effectiveness
Learning Objectives
After completing this section, you should be able to:
Measure detection quality objectively.
Develop meaningful SOC performance metrics.
Evaluate custom detection effectiveness.
Build detection scorecards.
Identify opportunities for improvement.
Report detection performance to management.
Develop a continuous improvement program.
Introduction
Imagine presenting your custom detection to your SOC manager.
The manager asks:
“Why should we deploy this detection into production?”
How would you answer?
A beginning analyst might respond:
“It works.”
A professional Detection Engineer responds:
“The detection achieved a 94% precision rate, a 92% recall rate during controlled testing, reduced analyst workload by 65%, and increased ATT&CK coverage for Execution and Tool Transfer techniques.” One answer is an opinion. The other is evidence.
Why Metrics Matter
Without measurements, improvement becomes impossible. Suppose alert volume decreases.
Is that good?
Maybe. Maybe not.
Perhaps:
- False positives decreased.
Or perhaps:
- Real attacks are no longer being detected.
Metrics distinguish improvement from accidental degradation.
Figure 5-41
Continuous Measurement
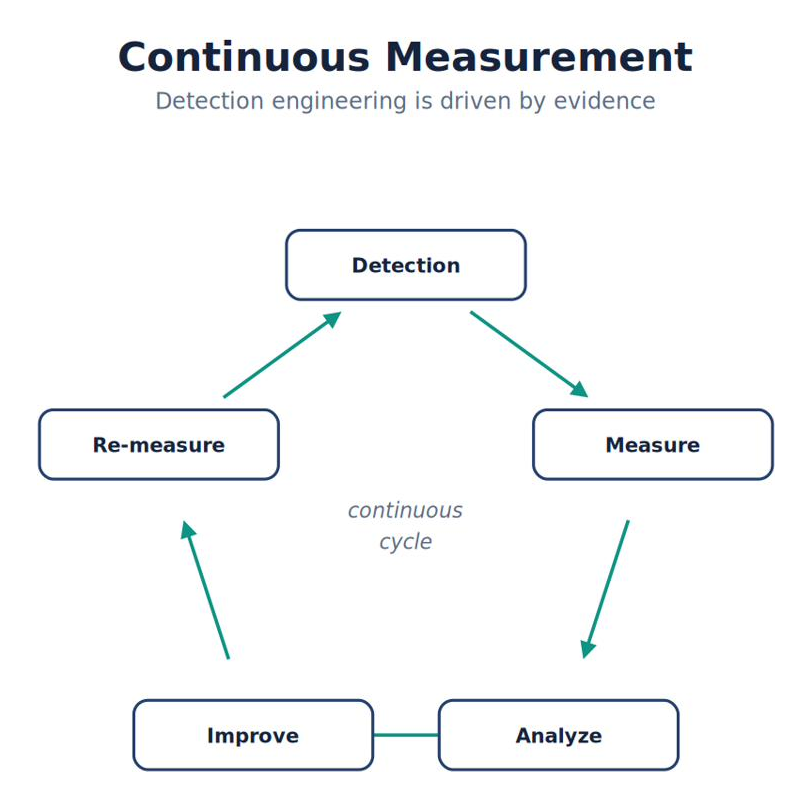
Note. The figure summarizes continuous Measurement and highlights the relationships among its principal elements, evidence sources, and analytical outcomes.
Detection engineering is driven by evidence.
Operational Metrics
Detection Engineers monitor many different measurements.
| Metric | Why It Matters |
|---|---|
| Alerts Generated | Analyst workload |
| True Positives | Detection quality |
| False Positives | Alert fatigue |
| False Negatives | Detection gaps |
| Precision | Analyst confidence |
| Recall | Detection completeness |
| MTTD | Detection speed |
| MTTA | Analyst responsiveness |
| MTTR | Incident containment |
Each metric answers a different operational question.
Detection Accuracy
Suppose your rule generated:
200 alerts.
Of those:
180 represented meaningful security events. 20 represented false positives.
Accuracy:
90%
This simple calculation immediately tells us something about detection quality.
Precision
Precision asks:
When the detection generates an alert, how often is the alert useful?
Example:
| Alerts | Useful |
|---|---|
| 100 | 90 |
Precision:
90%
High precision increases analyst trust.
Recall
Recall asks:
How many attacks did the SOC actually detect?
Controlled exercise:
Twenty simulated attacks.
Detected:
Nineteen.
Recall:
95%
High recall reduces organizational risk.
Analyst Tradecraft Tip
Precision and recall often compete. Increasing one may reduce the other. Detection engineering is about balancing those competing objectives based on organizational priorities and acceptable risk.
Detection Confidence
Not every alert deserves identical confidence.
Suggested scale:
| Confidence | Meaning |
|---|---|
| Low | Minimal supporting evidence |
| Moderate | Multiple observations |
| High | Independent corroboration |
| Very High | Strong behavioral correlation |
Confidence should reflect available evidence—not optimism.
Detection Stability
Ask:
How consistently does the rule perform?
Questions include:
Does it always trigger?
Does it miss identical activity?
Does it behave consistently after updates?
Does performance change under heavy load?
Consistency is essential for production deployments.
Measuring Alert Volume
Consider:
Before tuning:
12,000 Alerts → 150 Investigations
After tuning:
1,600 Alerts → 145 Investigations
The SOC investigates nearly the same number of meaningful events while reviewing dramatically fewer alerts. This is a significant engineering improvement.
Analyst Workload
Metrics should consider analysts.
Examples:
Average investigations per shift. Average alerts reviewed. Average investigation duration. Duplicate investigations. Repeated false positives. Reducing unnecessary work improves both morale and detection quality.
Figure 5-42
SOC Efficiency
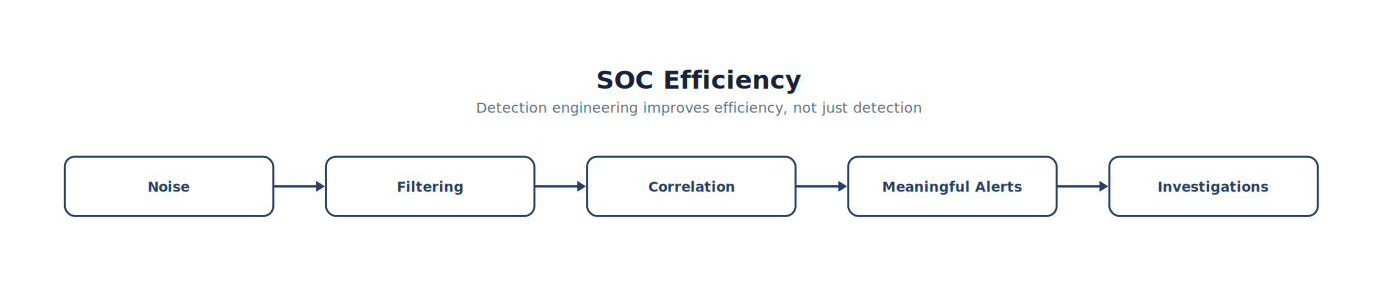
Note. The figure summarizes sOC Efficiency and highlights the relationships among its principal elements, evidence sources, and analytical outcomes.
Detection engineering improves efficiency—not merely detection.
ATT&CK Coverage Metrics
Every new detection should improve ATT&CK visibility.
Track:
| ATT&CK Technique | Detection Coverage |
|---|---|
| T1059.001 | Strong |
| T1105 | Strong |
| T1046 | Moderate |
| T1003 | None |
| T1021 | None |
Coverage metrics help prioritize future engineering efforts.
Rule Health
Every production rule should be reviewed.
Example scorecard:
| Question | Yes |
|---|---|
| Recently Tested | □ |
| Documented | □ |
| ATT&CK Mapped | □ |
| Peer Reviewed | □ |
| Low False Positives | □ |
| Current Version | □ |
| Owner Assigned | □ |
This becomes part of the organization’s detection governance.
Trend Analysis
Measurements become more valuable over time.
Example:
| Month | False Positives |
|---|---|
| January | 32% |
| February | 24% |
| March | 15% |
| April | 9% |
Trend analysis demonstrates sustained improvement.
Engineering Dashboard
A Detection Engineering dashboard might display:
Precision
Recall
ATT&CK Coverage
Detection Maturity
Validation Status
Rules Pending Review
New Rules This Month
Rules Retired
Average MTTD
Average MTTR
This dashboard becomes the operational view of detection quality.
Common Student Mistake
Students often measure success by:
Number of alerts generated.
Professional engineers measure:
Analyst time saved.
High-confidence detections.
Detection accuracy.
ATT&CK coverage.
Reduced investigation time.
Increased confidence.
Generating more alerts is rarely the objective.
Chapter Exercise 5.8 — Detection Metrics
Objective
Evaluate the custom PowerShell detection developed throughout Chapter 5 using measurable engineering metrics.
Tasks
Over a controlled laboratory period:
Generate:
Normal PowerShell
Administrative PowerShell
Encoded PowerShell
Script download
Word → PowerShell
Record:
| Activity | Alert | Correct? |
|---|---|---|
| Normal | □ | □ |
| Admin | □ | □ |
| Encoded | □ | □ |
| Download | □ | □ |
| Word → PS | □ | □ |
Calculate:
Precision
Estimated Recall
False Positive Rate
Analyst Confidence
Recommend:
Three improvements.
Detection Scorecard
| Category | Rating (1–5) |
|---|---|
| Accuracy | □ |
| Precision | □ |
| Recall | □ |
| Documentation | □ |
| ATT&CK Mapping | □ |
| Testing | □ |
| Operational Value | □ |
| Maintainability | □ |
| Scalability | □ |
| Analyst Usability | □ |
Students should justify each score with evidence from testing.
Capstone Preparation
Everything students have learned in this chapter prepares them for the final engineering project.
They now know how to:
Identify behaviors.
Analyze telemetry.
Create Wazuh rules.
Create Suricata signatures.
Tune detections.
Correlate multiple sensors.
Measure effectiveness.
Document engineering decisions.
Map detections to ATT&CK.
The only remaining step is integrating all of these skills into a complete detection engineering project.
Think Like a Detection Engineer
Imagine a senior engineer asks:
“How do you know your detection is better than the one it replaced?”
If your answer is:
“It generated fewer alerts.” You have measured activity.
If your answer is:
“It reduced false positives by 72%, maintained recall during controlled testing, increased ATT&CK coverage, shortened average investigation time by six minutes, and improved analyst confidence according to peer review.” You have measured engineering quality. Professional SOCs make decisions using evidence. Detection Engineers should do the same.
Key Concepts
By the end of this section, you should understand that:
Detection quality can and should be measured objectively.
Precision, recall, MTTD, MTTA, and MTTR are foundational SOC metrics.
ATT&CK coverage provides a useful way to measure detection maturity.
Engineering dashboards help prioritize future improvements.
The goal of Detection Engineering is sustained operational improvement—not simply creating more rules.
Looking Ahead — Chapter 5 Capstone
The final section of Chapter 5 is a Detection Engineering Capstone Project. Students will work as members of an enterprise Detection Engineering team to design, implement, validate, document, present, and defend a complete detection package. They will integrate Wazuh rules, Suricata signatures, Sysmon telemetry, ATT&CK mappings, testing plans, validation evidence, operational metrics, documentation, and executive reporting into a portfolio-quality deliverable. This capstone is designed to resemble the work products expected from entry-level Detection Engineers in modern Security Operations Centers and serves as the culminating assessment for the entire Detection Engineering portion of the textbook.
5.10 Detection Engineering Capstone Project
Scenario
Congratulations. You have recently joined the Detection Engineering team at Falcon Manufacturing, a multinational organization with approximately 8,000 employees.
The organization operates:
Windows 11 workstations
Ubuntu Linux servers
Wazuh SIEM
Sysmon
Suricata
Windows Defender
Active Directory
Over the past several weeks, the Incident Response team has observed an increase in suspicious PowerShell activity originating from user workstations.
Although existing detections identify some malicious behavior, analysts report:
Excessive false positives
Duplicate alerts
Poor correlation
Limited ATT&CK coverage
Difficult investigations
Your manager has assigned your team the responsibility of designing a new enterprise-quality detection package.
Project Objectives
Develop a production-quality detection package capable of identifying suspicious PowerShell-based download activity while minimizing analyst workload. The project must demonstrate the engineering process introduced throughout this chapter.
Required Deliverables
Students will submit the following.
Deliverable 1 — Detection Requirements
Clearly define:
Security problem
Detection objective
Business justification
Risk addressed
Assumptions
Scope
Deliverable 2 — Threat Analysis
Describe:
Threat actor behavior
Attack sequence
ATT&CK tactics
ATT&CK techniques
Expected telemetry
Students should include an attack diagram.
Deliverable 3 — Detection Architecture
Create a system diagram.
Example:
Figure 5-43
From Windows 11 to Dashboard
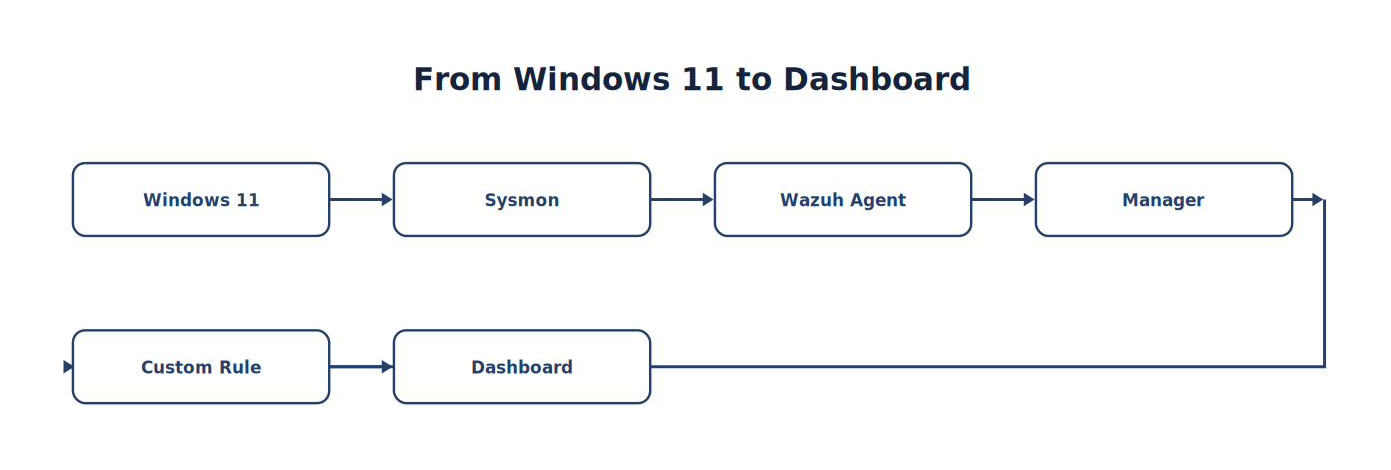
Note. The sequence traces how Windows 11 progresses to Dashboard, emphasizing the intermediate evidence and processing steps.
──────────────
Figure 5-44
From Network to Correlation Rule
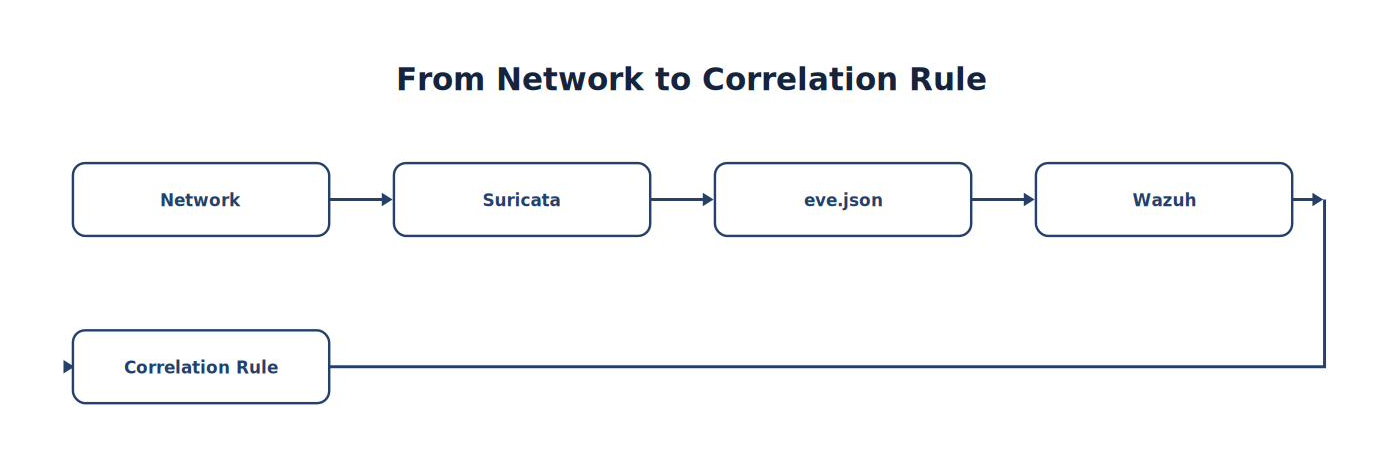
Note. The sequence traces how Network progresses to Correlation Rule, emphasizing the intermediate evidence and processing steps.
Students should clearly identify every telemetry source.
Deliverable 4 — Wazuh Detection
Develop:
Custom rule
Rule documentation
Rule ID
Severity
ATT&CK mapping
Validation required.
Deliverable 5 — Suricata Detection
Develop:
Local signature
SID
Revision
Validation
Documentation
Deliverable 6 — Correlation Design
Demonstrate:
Figure 5-45
From PowerShell to Correlated Alert
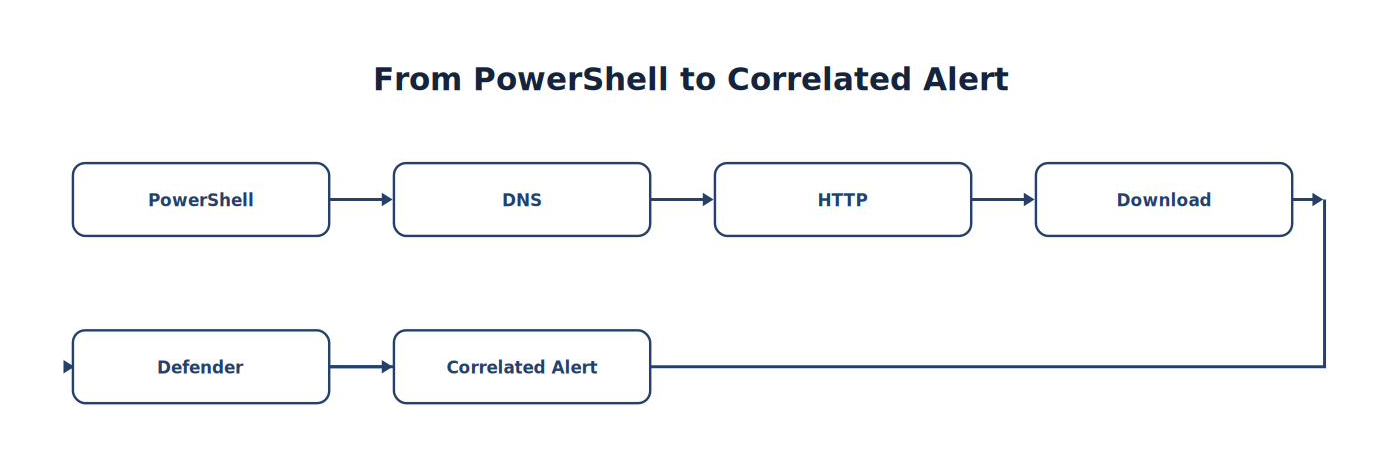
Note. The sequence traces how PowerShell progresses to Correlated Alert, emphasizing the intermediate evidence and processing steps.
Students should explain:
Why each event contributes to confidence.
Deliverable 7 — Test Plan
Develop repeatable validation. Positive tests. Negative tests. Boundary tests. Stress tests. Students should include expected results before testing begins.
Deliverable 8 — Validation Results
Document:
Successful detections
Failed detections
False positives
False negatives
Screenshots
Supporting evidence
Deliverable 9 — Detection Metrics
Calculate:
Precision
Estimated Recall
Alert Reduction
ATT&CK Coverage
Analyst Impact
Support every conclusion with collected evidence.
Deliverable 10 — Engineering Documentation
Include:
| Item | Required |
|---|---|
| Rule Documentation | ✓ |
| Version History | ✓ |
| ATT&CK Mapping | ✓ |
| Validation History | ✓ |
| Test Results | ✓ |
| Known Limitations | ✓ |
| Future Improvements | ✓ |
Team Roles
Students should organize themselves into engineering teams.
Suggested roles include:
| Role | Responsibility |
|---|---|
| Detection Engineer | Wazuh rules |
| Network Detection Engineer | Suricata signatures |
| Threat Intelligence Analyst | ATT&CK mapping |
| SOC Analyst | Validation |
| Documentation Engineer | Engineering documentation |
| Project Lead | Final presentation |
For individual courses, one student may perform multiple roles while still documenting responsibilities separately.
Engineering Timeline
| Phase | Activity |
|---|---|
| Week 1 | Requirements |
| Week 2 | Threat Analysis |
| Week 3 | Detection Design |
| Week 4 | Rule Development |
| Week 5 | Validation |
| Week 6 | Tuning |
| Week 7 | Documentation |
| Week 8 | Final Presentation |
Engineering Notebook
Students maintain an engineering notebook throughout the project.
Include:
Daily work log
Problems encountered
Design decisions
Testing notes
Lessons learned
Future improvements
This notebook becomes part of the project grade.
Peer Review
Each project must receive an engineering review.
Reviewers evaluate:
Detection logic
Documentation
ATT&CK mapping
Testing quality
Maintainability
Operational usefulness
No production detection should exist without peer review.
Management Presentation
Students prepare a professional presentation for SOC leadership.
Presentation should answer:
- What problem exists?
- Why was this detection created?
- How was it tested?
- How accurate is it?
- How much analyst time does it save?
- What ATT&CK techniques are now covered?
- What improvements remain?
Students should present evidence—not opinions.
Grading Rubric
| Category | Points |
|---|---|
| Threat Analysis | 10 |
| Detection Design | 15 |
| Wazuh Rule | 15 |
| Suricata Signature | 10 |
| Correlation Logic | 10 |
| Validation | 15 |
| Documentation | 10 |
| Metrics | 5 |
| Presentation | 10 |
| Professionalism | 10 |
| Total | 100 |
Capstone Success Criteria
A successful project demonstrates:
✓ Production-quality documentation
✓ Repeatable testing
✓ ATT&CK alignment
✓ Multi-source correlation
✓ Low false-positive rate
✓ Clear engineering rationale
✓ Measured operational value
✓ Professional presentation
Reflection Questions
Each student should submit a personal reflection addressing the following:
Which aspect of detection engineering was most challenging?
How did your understanding of SOC operations change during this project?
What improvements would you make if this detection were deployed in a production environment?
How did telemetry from multiple sources strengthen your confidence in the investigation?
Which engineering practices (testing, documentation, peer review, version control) had the greatest impact on the quality of your work?
Which additional ATT&CK techniques would you prioritize in the next iteration of the detection package?
What did you learn about balancing security visibility with analyst workload?
Chapter 5 Summary
By completing Chapter 5, you have transitioned from a Security Operations Center analyst to a junior Detection Engineer.
You can now:
Explain how the Wazuh detection engine processes events.
Understand rule hierarchy, inheritance, and evaluation order.
Create custom Wazuh rules using upgrade-safe engineering practices.
Validate detections through structured testing.
Tune detections to reduce false positives while preserving visibility.
Develop and maintain local Suricata signatures.
Correlate endpoint and network telemetry into high-confidence detections.
Measure detection quality using objective engineering metrics.
Document, version, and maintain detections using enterprise best practices.
Present and defend engineering decisions using operational evidence.
These skills mirror the workflow used by Detection Engineering teams in modern enterprise SOCs and provide the foundation for advanced topics such as threat hunting, purple teaming, automated response, and adversary emulation.
5.11 Chapter Summary
This chapter transitioned you from being a consumer of Wazuh alerts to being a builder of them. You learned how the Wazuh rule engine evaluates decoded events, how rules inherit from and chain off one another using <if_sid>, and how to write, test, and deploy your first custom local rule. You learned to use wazuh-logtest — the official tool for validating rules and decoders against sample log lines without needing to generate live traffic — and why systematic testing (including proving what should not trigger a rule) is as important as proving what should. You developed local Suricata signatures, learned to reduce false positives through deliberate tuning, and built multi-source correlation rules that combine endpoint and network telemetry into higher-confidence detections. Finally, you learned to measure detection effectiveness using objective metrics rather than gut feeling.
Detection Engineering is a discipline of continuous improvement. The rules you write today will be tuned, retired, and rewritten as your environment and the threat landscape change. The methodology — write, test, validate, tune, measure, document — is what will serve you regardless of which SIEM platform you use throughout your career.
Chapter 5 Key Terms
| Term | Definition |
|---|---|
| Decoder | A Wazuh Manager component that parses a raw log line and extracts its fields into a structured form before rules evaluate it. |
| Detection Tuning | The ongoing process of adjusting rule logic and thresholds to reduce false positives while preserving true positives. |
| False Negative | Malicious or policy-violating activity that produced no alert. |
| False Positive | An alert triggered by benign activity. |
| if_sid | A Wazuh rule element that causes a rule to evaluate only after a specified parent rule ID has matched. |
| Local Rule | A custom, analyst-authored Wazuh rule stored in local_rules.xml, separate from the vendor ruleset so it survives updates, that fires on defined field conditions. |
| Multi-Source Correlation Rule | A detection rule that combines telemetry from more than one sensor (e.g., Sysmon and Suricata) to raise confidence in an alert. |
| Rule Level | The numeric severity Wazuh assigns to each rule, from 0 (ignored — never alerts) to 15 (severe attack). |
| wazuh-logtest | The official Wazuh command-line tool for testing rules and decoders against sample log lines in a sandbox. |
Knowledge Check
Select the best answer for each question.
1. What is the purpose of the <if_sid> element in a Wazuh rule?
A. It sets the alert severity
B. It defines the decoder used
C. It causes the rule to evaluate only after a specified parent rule has already matched
D. It disables the rule
2. Where should custom Wazuh rules be stored so they survive ruleset updates?
A. In a separate local rule file
B. Directly inside the vendor rule files
C. In suricata.yaml
D. In the Wazuh Indexer configuration
3. What is the correct first step before assuming a custom rule “doesn’t work”?
A. Reinstall the Wazuh Manager
B. Delete the rule and start over
C. Restart the Wazuh Indexer
D. Test it with wazuh-logtest against a sample log line
4. In wazuh-logtest output, which phase shows whether your rule actually matched?
A. Phase 1 — Pre-decoding
B. Phase 2 — Decoding
C. Phase 3 — Rule filtering
D. There is no phase for this
5. Why does professional rule validation include testing activity that should NOT trigger the rule?
A. It helps confirm the rule is specific enough to avoid false positives
B. It is not necessary — only positive matches matter
C. Wazuh requires at least two test cases per rule
D. It has no real value
6. What is the primary goal of detection tuning?
A. To generate as many alerts as possible
B. To disable all default rules
C. To increase Suricata’s packet capture rate
D. To reduce false positives while preserving useful, actionable alerts
7. Why are multi-source correlation rules generally higher-confidence than single-source rules?
A. They are required by Wazuh licensing
B. No single sensor observes an entire attack; combining sources reduces the chance of a false conclusion
C. They run faster than single-source rules
D. They use less disk space
8. Which of the following is a legitimate objective metric for measuring detection effectiveness?
A. The number of PowerPoint slides in the SOC’s presentation
B. The number of analysts on shift
C. The ratio of true positives to total alerts generated by a rule
D. The color scheme of the Wazuh Dashboard
Chapter Discussion Questions
Explain the relationship between a decoder and a rule in the Wazuh pipeline.
Why should vendor-supplied rules never be edited directly, and where should custom rules live instead?
Walk through how you would use wazuh-logtest to debug a custom rule that isn’t generating alerts.
Why is testing for expected non-matches as important as testing for expected matches?
Describe a realistic scenario where a multi-source correlation rule would catch an attack that a single-source rule would miss.
What tradeoffs exist between writing very specific detection rules and very broad ones?
Why does “detection engineering” borrow so much of its methodology from software engineering?
Part V Preview — Threat Hunting and Adversary Simulation
The next major part of the textbook moves beyond responding to alerts and engineering detections. Students will learn how to proactively search for adversaries who have evaded automated detections. Rather than waiting for alerts, they will formulate hunting hypotheses, analyze endpoint and network telemetry, leverage the MITRE ATT&CK framework to guide investigations, and validate their hunts through controlled adversary emulation using tools such as Atomic Red Team and Caldera. This transition—from reactive monitoring to proactive hunting—represents one of the most significant milestones in a cybersecurity professional’s development and prepares students for advanced SOC, threat hunting, and purple team roles (MITRE Corporation, n.d.-b) (Red Canary, n.d.).
Further Resources
Wazuh — User Manual: Ruleset (https://documentation.wazuh.com/current/user-manual/ruleset/index.html) — Custom rule and decoder syntax reference.
Suricata — Rule Writing (https://docs.suricata.io/en/latest/rules/intro.html) — Official guide to signature structure and keywords.
Sigma Project (https://sigmahq.io/) — The vendor-neutral detection rule format used across the industry.
Atomic Red Team (https://github.com/redcanaryco/atomic-red-team) — Technique tests for validating the rules you write.