

Chapter Overview
Course Progression
This chapter prepares students for Progressive Labs PL-00 and PL-01, which validate the environment and introduce the analyst workflow and SOC operating context. Chapter Exercises are focused practice embedded in the book; Progressive Labs are cumulative investigations and do not map one-to-one to chapter numbers. See Course Progression and Progressive Lab Alignment in the front matter for the complete roadmap.
Organizations today operate in an environment where cyberattacks are no longer rare events—they are a routine part of doing business. Every day, security teams defend against phishing campaigns, ransomware, credential theft, insider threats, data exfiltration, web application attacks, and automated reconnaissance from attackers across the globe. The volume and sophistication of these attacks have increased dramatically over the last two decades, making it impossible for organizations to rely on manual monitoring or isolated security products.
To address this challenge, organizations created the Security Operations Center (SOC): a centralized function responsible for continuously monitoring, detecting, investigating, and responding to cybersecurity events. A SOC combines people, processes, and technology to transform raw security data into actionable intelligence (Knerler et al., 2022).
Throughout this textbook, you will build and operate a fully functional SOC laboratory using enterprise-grade technologies including Wazuh, Suricata, Sysmon, Windows Defender, and Ubuntu Linux. Although the environment is intentionally small enough to run on a single workstation using virtualization, the architecture and investigative workflow closely mirror those found in professional security operations centers.
This first chapter establishes the conceptual foundation for the remainder of the book. Before installing software or executing commands, you must understand why a SOC exists, what problems it solves, and how security information flows through a modern monitoring environment. These concepts will serve as the framework for every laboratory exercise and investigation that follows.
Learning Objectives
After completing this chapter, you should be able to:
- Define the purpose of a Security Operations Center (SOC).
- Explain the relationship between people, processes, and technology in security operations.
- Differentiate between an event, an alert, and an incident.
- Describe the responsibilities of Tier 1, Tier 2, and Tier 3 SOC analysts.
- Explain why centralized monitoring is essential in modern organizations.
- Describe the flow of security telemetry from sensors to analysts.
- Explain how Wazuh, Suricata, Sysmon, and Windows Defender complement one another.
- Recognize the importance of validating monitoring infrastructure before investigating alerts.
- Classify alert outcomes as true positives, false positives, or false negatives.
- Recognize how the MITRE ATT&CK® framework provides a shared vocabulary for adversary behavior.
Opening Scenario
Monday Morning
It is 8:07 AM on a Monday morning. You arrive at work carrying a cup of coffee when your phone begins ringing before you’ve even reached your desk.
The Help Desk reports that employees cannot authenticate to several internal systems. A finance employee believes files have disappeared from a shared drive. The network team has observed unusually high outbound traffic leaving the organization overnight. Meanwhile, your email contains dozens of automated security notifications generated during the weekend.
Within minutes, your manager walks into the room and asks a simple question:
“Are we under attack?”
Although the question is simple, the correct answer is not.
A novice analyst might immediately respond:
“Yes.”
An experienced analyst answers differently:
“I don’t know yet. Let’s collect evidence.”
This distinction represents one of the most important lessons in cybersecurity.
Effective analysts do not make assumptions. They develop hypotheses, gather evidence, validate telemetry, correlate information from multiple sources, and only then draw conclusions. Every alert is treated as a clue rather than proof. Every investigation begins by confirming that the monitoring infrastructure itself is functioning correctly.
This investigative mindset forms the foundation of professional security operations and will be reinforced throughout this textbook.
1.1 What Is a Security Operations Center?
A Security Operations Center (SOC) is a centralized organizational function responsible for continuously monitoring, detecting, investigating, and responding to cybersecurity events across an organization’s technology environment (Knerler et al., 2022).
The SOC serves as the operational hub of an organization’s cyber defense program. Rather than relying on individual administrators to notice suspicious behavior, the SOC continuously analyzes information collected from servers, workstations, network devices, cloud platforms, security appliances, and applications.
A modern SOC performs four primary functions:
- Monitoring – Collecting and reviewing security telemetry from multiple sources.
- Detection – Identifying suspicious or malicious activity using automated rules and analyst expertise.
- Investigation – Determining whether observed activity represents normal operations or a genuine security threat.
- Response – Coordinating containment, eradication, and recovery activities when an incident is confirmed.
These functions operate continuously. Unlike many IT departments that primarily work during business hours, SOCs often provide around-the-clock monitoring because cyber threats do not follow a business schedule.
Figure 1-1
Core Functions of a Security Operations Center
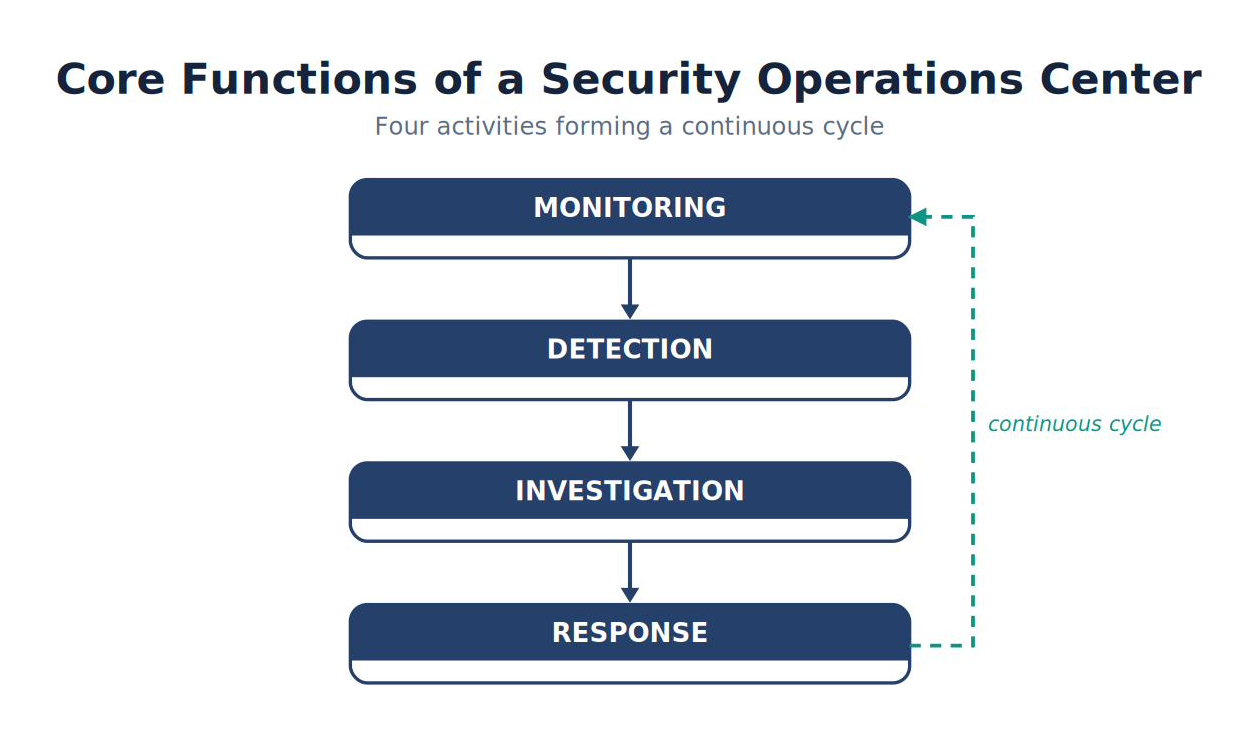
Note. The SOC cycle connects monitoring, detection, investigation, and response; response outcomes feed improvements back into monitoring.
These four activities form a continuous cycle. Information gathered during incident response often leads to improved monitoring, new detection rules, and enhanced defensive capabilities.
Analyst Tradecraft Tip
A SOC does not exist merely to catch hackers; it exists to reduce uncertainty through evidence.
Ask whether activity is expected, the alert is accurate, telemetry is complete, more evidence is needed, and escalation is justified.
Analyst Checkpoint
1.2 Why Organizations Need a SOC
Every device connected to a network generates data. Servers record authentication attempts, operating systems log process creation, firewalls record permitted and denied connections, applications generate error messages, and intrusion detection systems inspect millions of packets each day.
A medium-sized organization may generate millions of security events every 24 hours. Large enterprises routinely process billions.
Without centralized monitoring, identifying malicious activity within this volume of information would be nearly impossible. A SOC addresses this challenge by collecting telemetry from diverse sources, normalizing the data into a consistent format, correlating related events, and presenting analysts with prioritized alerts that warrant investigation. Rather than asking analysts to search manually through countless log files, the SOC provides a consolidated operational picture of the organization’s security posture.
Real-World Example
Consider a phishing email that successfully compromises a workstation.
Several independent systems may observe different aspects of the attack:
- Microsoft Defender detects a suspicious executable.
- Sysmon records the malicious process creation (Russinovich & Garnier, n.d.).
- Windows records a failed privilege escalation attempt.
- Suricata identifies outbound communication to a known malicious domain.
- The firewall records the external connection.
- Wazuh correlates these observations and presents them as related alerts.
Viewed individually, each event appears relatively minor. Together, they reveal the complete attack sequence.
This ability to correlate seemingly unrelated observations is one of the defining characteristics of a modern Security Operations Center.
1.3 The Evolution of Cyber Defense
Learning Objectives
After completing this section, you should be able to:
- Describe how cyber defense has evolved over the past four decades.
- Explain why traditional security technologies are no longer sufficient by themselves.
- Differentiate between preventive, detective, and responsive security controls.
- Understand why modern organizations require layered security.
The Changing Threat Landscape
Cybersecurity has undergone a remarkable transformation since the early days of personal computing. During the 1980s and early 1990s, organizations primarily focused on protecting standalone computers from viruses distributed on floppy disks. Networks were relatively small, Internet connectivity was limited, and attackers generally sought recognition rather than financial gain.
Today’s environment is dramatically different.
Organizations operate cloud infrastructures, mobile workforces, Internet-connected devices, virtual machines, Software-as-a-Service (SaaS) platforms, and globally distributed applications. Attackers have evolved as well. Modern adversaries include organized criminal groups, nation-state intelligence agencies, hacktivists, insiders, and automated malware operating at Internet scale.
As the threat landscape evolved, so did defensive technologies.
The First Generation: Perimeter Security
The earliest cybersecurity strategy relied heavily on a simple assumption:
If attackers cannot enter the network, they cannot compromise the organization.
This philosophy led to the widespread deployment of firewalls. A firewall examines network traffic entering or leaving a network and determines whether communication should be allowed based on predefined security policies.
Although firewalls remain one of the most important security technologies in use today, they primarily answer one question:
Should this communication be allowed?
They generally do not answer:
- Is this communication malicious?
- Has this computer already been compromised?
- Is an employee abusing legitimate access?
- Has malware begun communicating with an attacker?
These questions require visibility beyond simple access control.
The Second Generation: Intrusion Detection Systems
As attacks became more sophisticated, organizations recognized that preventing unauthorized access was not enough. They also needed to observe network activity. This requirement led to the development of Intrusion Detection Systems (IDSs) (Scarfone & Mell, 2007). Unlike a firewall, which decides whether traffic should pass, an IDS inspects network traffic looking for suspicious behavior.
Common examples include:
- Port scans
- Malware communications
- Exploit attempts
- Protocol anomalies
- Command-and-control traffic
- Data exfiltration patterns
Throughout this textbook, Suricata will serve as our Network Intrusion Detection System (NIDS) (Open Information Security Foundation, n.d.).
Unlike a firewall, Suricata generally does not block traffic in our laboratory. Instead, it examines packets, compares them against thousands of detection rules, and produces alerts describing suspicious activity.
The Third Generation: Endpoint Visibility
Organizations soon discovered another important limitation.
Not every attack is visible on the network.
Consider the following examples:
- An employee launches PowerShell locally.
- Malware creates a scheduled task.
- A user creates a new administrator account.
- A malicious DLL loads into memory.
- A registry key establishes persistence.
These activities may never generate network traffic. If security monitoring relies solely on network sensors, these attacks remain invisible. This realization led to the development of Host-Based Intrusion Detection Systems (HIDS) and endpoint monitoring tools. In our laboratory, Sysmon provides this visibility.
Sysmon records detailed information about activity occurring directly on the Windows operating system, including:
- Process creation
- Network connections
- DNS queries
- File creation
- Registry modifications
- Driver loading
- Process injection
Together, Suricata and Sysmon provide complementary perspectives.
One observes the network.
The other observes the endpoint.
The Fourth Generation: Security Information and Event Management
As organizations deployed more security products, a new challenge emerged.
Every device generated alerts independently.
Consider the following simplified environment:
| Device | Daily Alerts |
|---|---|
| Firewall | 18,000 |
| Windows Servers | 120,000 |
| Active Directory | 45,000 |
| Endpoint Protection | 9,500 |
| Suricata IDS | 3,200 |
| VPN Gateway | 11,000 |
An analyst would need to examine alerts across numerous consoles, each using different formats and terminology. This fragmentation slowed investigations and increased the likelihood that important indicators would be overlooked. To address this problem, organizations introduced Security Information and Event Management (SIEM) platforms. A SIEM collects security telemetry from many sources, stores it centrally, correlates related events, and presents analysts with a unified view of organizational security. In this textbook, our SIEM platform is Wazuh (Wazuh, Inc., n.d.-a). Rather than replacing existing security technologies, Wazuh brings them together.
Wazuh is often described as both a SIEM and an Extended Detection and Response (XDR) platform. XDR refers to unifying detection and response telemetry across endpoints, networks, and cloud workloads within a single system (Gartner, n.d.-c). Chapter 2 examines both terms in depth.
Figure 1-2
Evolution of Enterprise Cyber Defense
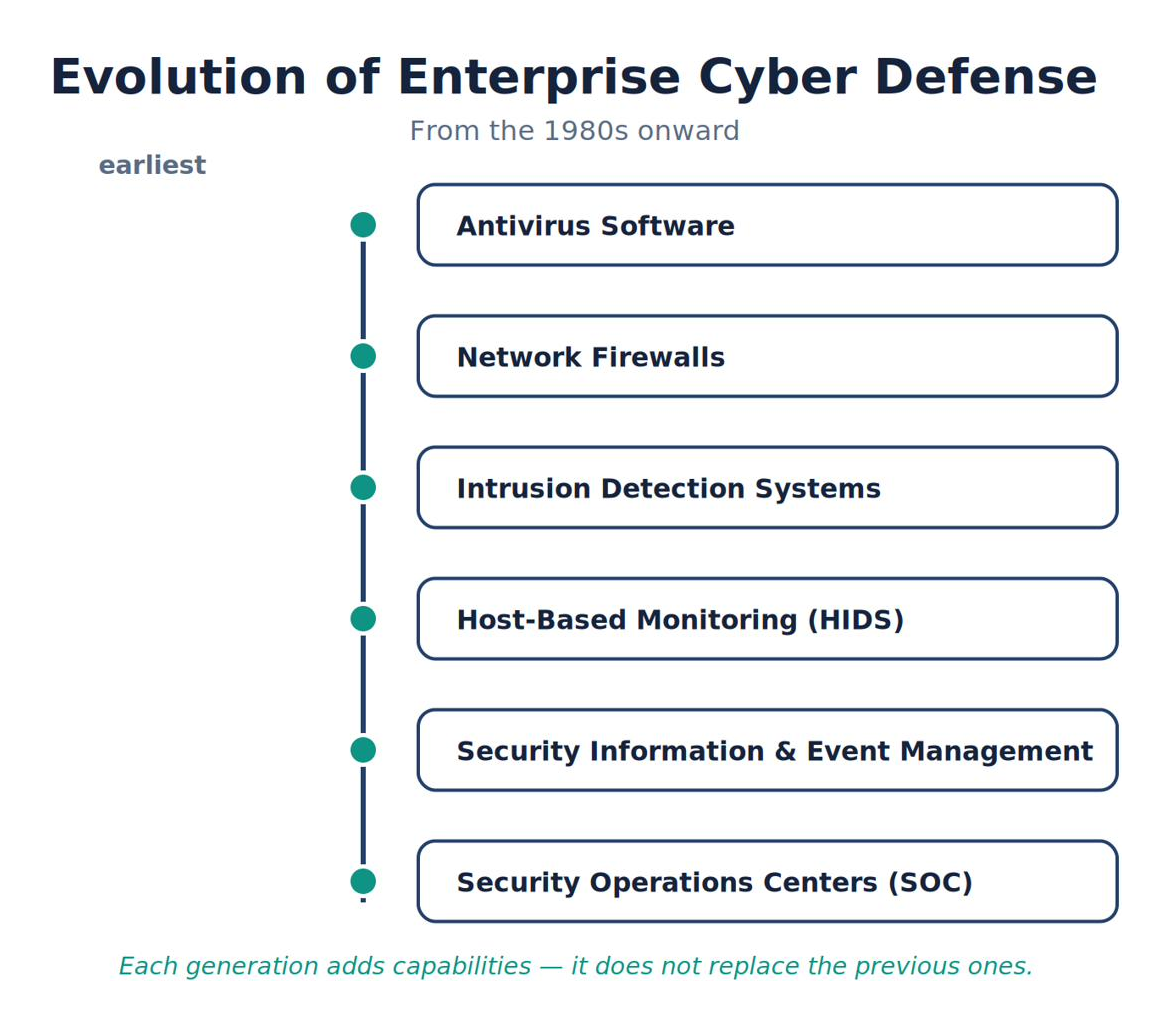
Note. Successive generations expand cyber defense from endpoint and perimeter controls to centralized analytics, automation, and intelligence-led operations.
Each generation adds capabilities rather than replacing earlier technologies. Modern organizations still use firewalls, deploy antivirus software, and operate intrusion detection systems, but these technologies now work together instead of operating independently.
Defense in Depth
One of the most important concepts in cybersecurity is Defense in Depth (Joint Task Force, 2020).
Defense in Depth recognizes a fundamental reality:
No single security technology can stop every attack.
Instead, organizations deploy multiple, overlapping security controls. If one control fails, another may detect or prevent the attack.
Consider a phishing attack.
The email passes through several layers of defense:
- Email security gateway
- Endpoint protection
- Windows Defender
- Sysmon
- Suricata
- Wazuh correlation rules
- SOC analyst investigation
An attacker must bypass every defensive layer. A defender only needs one layer to identify malicious activity.
Analyst Tradecraft Tip
No security tool is “the best” in isolation. Ask two questions: What can this tool see, and what can it not see? Every product has blind spots. Correlate multiple sensors before reaching a conclusion.
1.4 Events, Alerts, and Incidents
Learning Objectives
After completing this section, you should be able to:
- Define an event, alert, and incident.
- Explain how these three terms differ within a Security Operations Center.
- Describe how a single incident may generate thousands of individual events.
- Recognize why confusing these terms leads to poor investigations.
- Understand how Wazuh transforms raw telemetry into actionable security information.
Why These Terms Matter
New cybersecurity students—and many new analysts—often use event, alert, and incident interchangeably. Although related, the terms describe different conditions in the investigative process. Understanding that distinction is fundamental to SOC analysis, so this textbook uses the terms consistently.
What Is an Event?
An event is an observable occurrence in a system or network. Analysts usually encounter events as log or telemetry records, and most reflect normal activity (Cichonski et al., 2012).
Examples include:
- A user successfully logs into Windows.
- A web browser starts.
- A DNS query resolves a hostname.
- A firewall allows a connection.
- A file is opened.
- A printer receives a print job.
- A USB device is inserted.
- A process terminates.
None of these actions necessarily indicates malicious activity; each is simply an observation of something that happened.
Examples of Events
| Technology | Example Event |
|---|---|
| Windows | User logs on successfully |
| Sysmon | Process creation (Event ID 1) |
| Sysmon | DNS Query (Event ID 22) |
| Linux | SSH login |
| Firewall | TCP connection allowed |
| Suricata | HTTP request observed |
| Windows Defender | File scanned |
These are events—not conclusions about security impact.
Events Are Constant
Imagine sitting beside a busy highway: every passing car, truck, or motorcycle is an event, and most are ordinary. You would not call the police merely because a vehicle passed; likewise, a SOC analyst does not investigate every event. Modern systems can generate thousands of events per minute and millions per day, most of which reflect routine operations.
What Is an Alert?
An alert is a notification generated when detection logic identifies an event or related events as activity of interest (Scarfone & Mell, 2007). Alerts help analysts prioritize telemetry they cannot review individually; they are investigative claims, not proof of compromise.
Examples include:
- Multiple failed logon attempts
- Known malware hash detected
- PowerShell launched from Microsoft Word
- Network scan detected
- Suspicious DNS request
- Ransomware behavior observed
Each alert prioritizes analyst attention but still requires validation.
Figure 1-3
Events Become Alerts
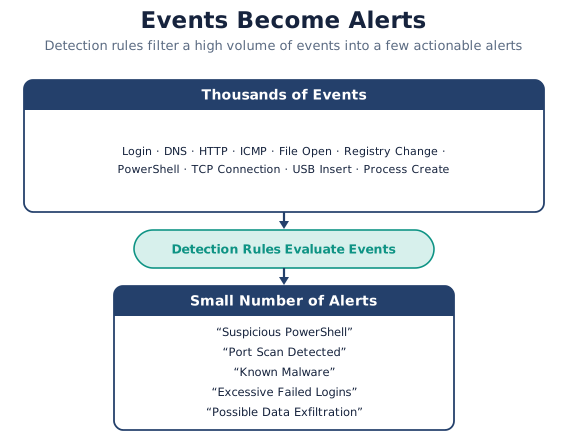
Note. Raw events are collected and evaluated; events matching detection logic become alerts that require analyst review.
This filtering process dramatically reduces analyst workload.
Alerts Are Investigative Starting Points
One of this textbook's most important lessons is that an alert is not proof of an attack. It means only that something deserves investigation.
Many alerts ultimately prove to be:
- Normal business activity
- User error
- Administrative maintenance
- Software updates
- Misconfigured applications
- False positives
Professional analysts understand that alerts represent hypotheses—not conclusions.
True Positives, False Positives, and False Negatives
Analysts classify alert outcomes using three terms you will use constantly throughout this textbook:
- A true positive is an alert that correctly identified genuinely malicious or policy-violating activity.
- A false positive is an alert triggered by benign activity—the detection logic matched, but nothing malicious occurred. Tier 1 analysts spend much of their day identifying false positives.
- A false negative is malicious activity that generated no alert at all—the most dangerous outcome, because the SOC does not know it is missing anything.
False negatives connect directly to this chapter’s central theme. A disconnected agent, a stopped sensor, or a broken telemetry pipeline manufactures false negatives silently. This is why professional analysts validate their monitoring infrastructure before trusting the absence of alerts.
Analyst Tradecraft Tip
One of the easiest ways to identify an inexperienced analyst is by how they react to alerts.
New analysts often think, “The alert says malware.” Experienced analysts ask, “What evidence supports that conclusion?”
The alert begins the investigation; it does not end it.
Never confuse detection with proof.
What Is an Incident?
An incident is a violation or imminent threat of violation of security policy, acceptable-use policy, or standard security practice (Cichonski et al., 2012). Investigation determines whether an alert meets the organization's incident criteria; malicious activity is common, but a qualifying policy violation can also constitute an incident.
Examples include:
- Confirmed ransomware infection
- Unauthorized administrator account creation
- Active data exfiltration
- Insider theft
- Successful phishing compromise
- Malware execution
- Domain controller compromise
Incidents may require coordinated action involving:
- Security Operations
- Incident Response
- IT Operations
- Management
- Legal Counsel
- Human Resources
- Public Relations
- Law Enforcement
The participants depend on severity, business impact, legal obligations, and organizational policy.
Figure 1-4
Event → Alert → Incident
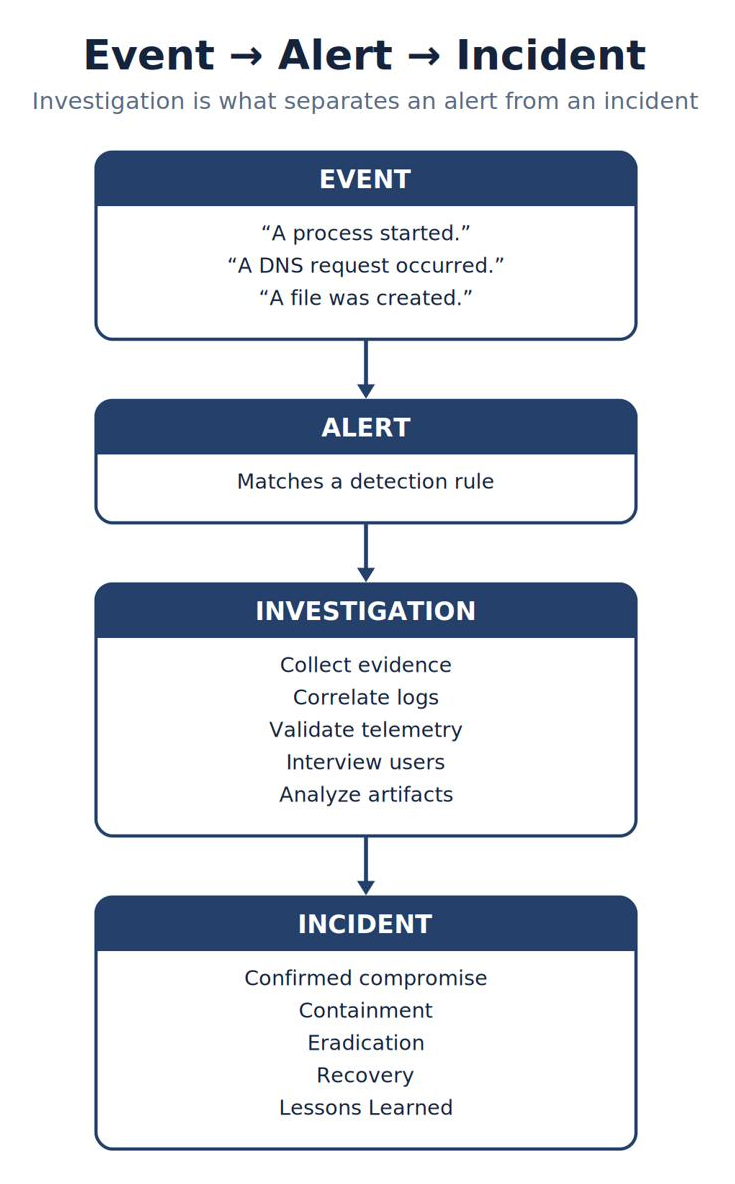
Note. An event is an observation, an alert is a detection-generated claim requiring validation, and an incident meets the organization's defined response criteria.
A Real Example
Suppose Sysmon records the following event.
Process Create powershell.exe
Parent Process:
WINWORD.EXE
This is simply an event.
Later, Wazuh detects that Microsoft Word launched PowerShell.
A detection rule matches.
Now Wazuh generates an alert.
At this point, the SOC analyst investigates.
Questions include:
- Did the user intentionally execute PowerShell?
- Was Word exploiting a vulnerability?
- Did Defender quarantine malware?
- What network connections followed?
- Did Suricata observe suspicious traffic?
- Were additional endpoints affected?
Only after answering these questions can the analyst determine whether an incident exists.
Best Practice
Never investigate an alert in isolation.
Correlate information from multiple sources.
For example:
| Data Source | What It Can Tell You |
|---|---|
| Sysmon | What happened on the endpoint |
| Suricata | What happened on the network |
| Windows Defender | Was malware detected or blocked? |
| Windows Event Logs | Authentication and system activity |
| Wazuh | Correlation across all data sources |
This textbook will repeatedly demonstrate that the best investigations combine information from multiple sensors rather than relying on a single alert.
Common Student Mistake
A student performs an Nmap scan during a laboratory exercise.
Suricata generates twenty alerts.
The student immediately concludes:
“The network has been hacked.”
This conclusion is incorrect.
The student generated the traffic intentionally.
The alerts indicate that Suricata correctly detected scanning activity.
The proper conclusion is:
The detection system is functioning correctly.
Always interpret alerts within their operational context.
Analyst Tradecraft Tip
Investigate first; conclude second. Before acting on an alert, identify its rule, sensor, supporting telemetry, prior occurrences, and missing evidence. Never allow the alert title to become your conclusion.
Chapter Connection
Understanding the difference between events, alerts, and incidents prepares us for the next section, where we examine security telemetry in greater depth. Before Wazuh can correlate alerts or analysts can investigate incidents, security data must first be generated, collected, transmitted, and stored. Understanding this data pipeline is essential to understanding how a modern Security Operations Center operates.
1.5 Security Telemetry — The Lifeblood of the Security Operations Center
Learning Objectives
After completing this section, you should be able to:
- Define security telemetry.
- Explain why telemetry is the foundation of every Security Operations Center.
- Identify the major sources of security telemetry.
- Describe how telemetry moves through a monitoring pipeline.
- Explain why missing telemetry creates security blind spots.
- Understand why validating telemetry is the first step of every investigation.
What Is Security Telemetry?
Imagine that you are the pilot of a modern commercial aircraft.
Although you can see out the cockpit window, you cannot directly observe:
- Engine temperatures
- Fuel flow
- Hydraulic pressure
- Cabin pressure
- Electrical systems
- Navigation equipment
- Wind speed
- Altitude
Instead, thousands of sensors continuously report the health of the aircraft.
These measurements are called telemetry.
Cybersecurity works exactly the same way.
A SOC analyst cannot directly observe what every computer is doing. Instead, analysts rely on security telemetry—the continuous stream of data generated by systems, applications, operating systems, security products, and network devices.
Security telemetry answers one fundamental question:
“What is happening inside my environment right now?”
Without telemetry, a SOC operates blindly.
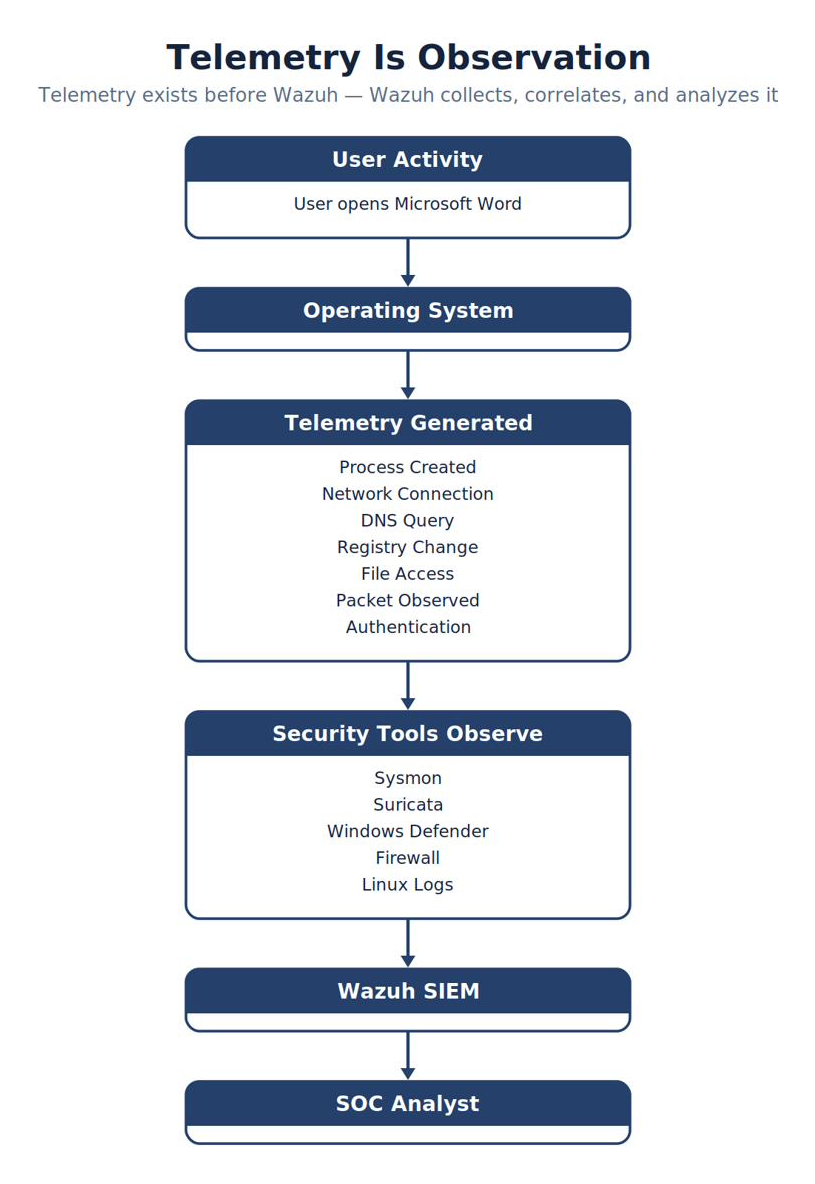
Telemetry Is Observation
It is important to understand that telemetry is observation, not interpretation.
For example:
A workstation sends a DNS request.
That DNS request is telemetry.
A user starts PowerShell.
That process creation is telemetry.
A firewall records an outbound TCP connection.
That connection is telemetry.
Suricata records an HTTP request.
That packet inspection is telemetry.
Telemetry simply records what happened.
It does not determine whether the activity is good or bad. That responsibility belongs to detection rules and analysts.
Figure 1-5
Telemetry Is Observation
Note. Telemetry records observable system activity; interpretation occurs only after analysts correlate the evidence with context.
The telemetry existed before Wazuh.
Wazuh did not create the information.
It collected, organized, correlated, and analyzed it.
Telemetry Is Everywhere
Every technology in your organization generates telemetry.
Some examples include:
| Technology | Example Telemetry |
|---|---|
| Windows | User logon |
| Windows | Service started |
| Windows | Process created |
| Linux | SSH login |
| Linux | sudo command |
| Firewall | Connection allowed |
| Firewall | Connection denied |
| Suricata | DNS request |
| Suricata | HTTP transaction |
| Windows Defender | Malware detected |
| Active Directory | Password change |
| VMware | Virtual machine powered on |
Each source provides only one part of the overall story. The role of the SOC is to combine these observations into a complete picture.
Telemetry Versus Logs
Students often believe that telemetry and logs are the same thing.
They are related—but not identical.
A log is one method of storing telemetry.
Telemetry can also exist as:
- Network packets
- Windows Event Records
- JSON documents
- Database entries
- API responses
- Cloud events
- Streaming data
- Security alerts
For example, Suricata stores telemetry inside eve.json. Sysmon stores telemetry inside the Windows Event Log. Windows Defender stores telemetry within Microsoft Defender operational logs. Although the storage formats differ, all represent security telemetry.
Raw Data Becomes Intelligence
In a single day, one Windows workstation might generate:
- 40,000 process events
- 25,000 file operations
- 8,000 registry changes
- 12,000 network connections
- 5,000 DNS queries
None of these numbers help an analyst by themselves. The value comes from identifying meaningful relationships.
For example, Suppose Wazuh observes:
- Microsoft Word launches PowerShell.
- PowerShell downloads a remote script.
- Defender quarantines a malicious executable.
- Suricata detects communication with a known malicious IP address.
Each observation is independent telemetry.
Together, they describe an attack.
This process of combining related telemetry is called correlation.
Correlation transforms data into information.
Information supports investigation.
Investigation produces intelligence.
Figure 1-6
From Data to Intelligence
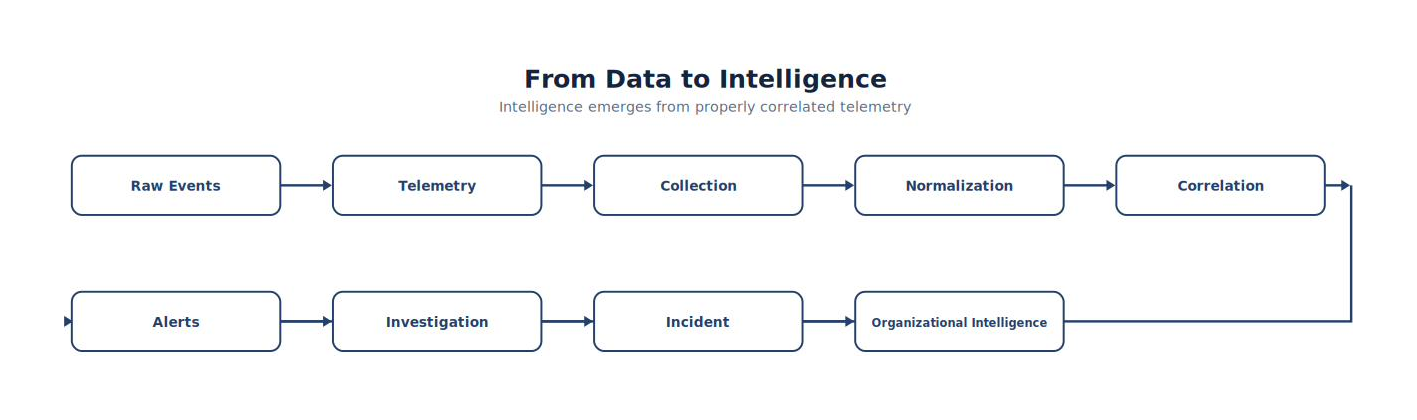
Note. Collected data is normalized, enriched, correlated, and analyzed to produce actionable security intelligence.
This figure represents one of the central ideas of modern security operations: a SOC does not create intelligence; it creates the conditions under which intelligence can emerge from properly correlated telemetry.
Verify Visibility Before Drawing Conclusions
No telemetry does not automatically mean no attack. A lack of telemetry may instead indicate that visibility has failed. Before concluding that nothing happened, verify whether:
- Sysmon stopped running.
- Suricata crashed.
- The Wazuh Agent disconnected.
- Windows Defender logging failed.
- A firewall stopped forwarding logs.
- The SIEM index became full.
Professional analysts verify that sensors, collection paths, and storage are functioning before interpreting silence as evidence.
Analyst Tradecraft Tip
Silence is not safety.
Verify visibility before concluding that nothing happened.
The Security Monitoring Pipeline
Every event investigated within a SOC follows a journey. Understanding this journey is one of the most important concepts you will learn.
Suppose a user opens PowerShell.
The following sequence occurs:
- Windows creates a new process.
- Sysmon records Process Creation (Event ID 1).
- Windows stores the event.
- The Wazuh Agent reads the event.
- The event is transmitted securely to the Wazuh Manager.
- Wazuh applies decoders and detection rules.
- If conditions are met, an alert is generated.
- The alert is indexed.
- The Wazuh Dashboard displays the alert.
- A SOC analyst begins an investigation.
This sequence is called the security monitoring pipeline. Understanding this pipeline makes troubleshooting significantly easier. If an alert does not appear, the analyst knows exactly where to begin looking.
Figure 1-7
Security Monitoring Pipeline
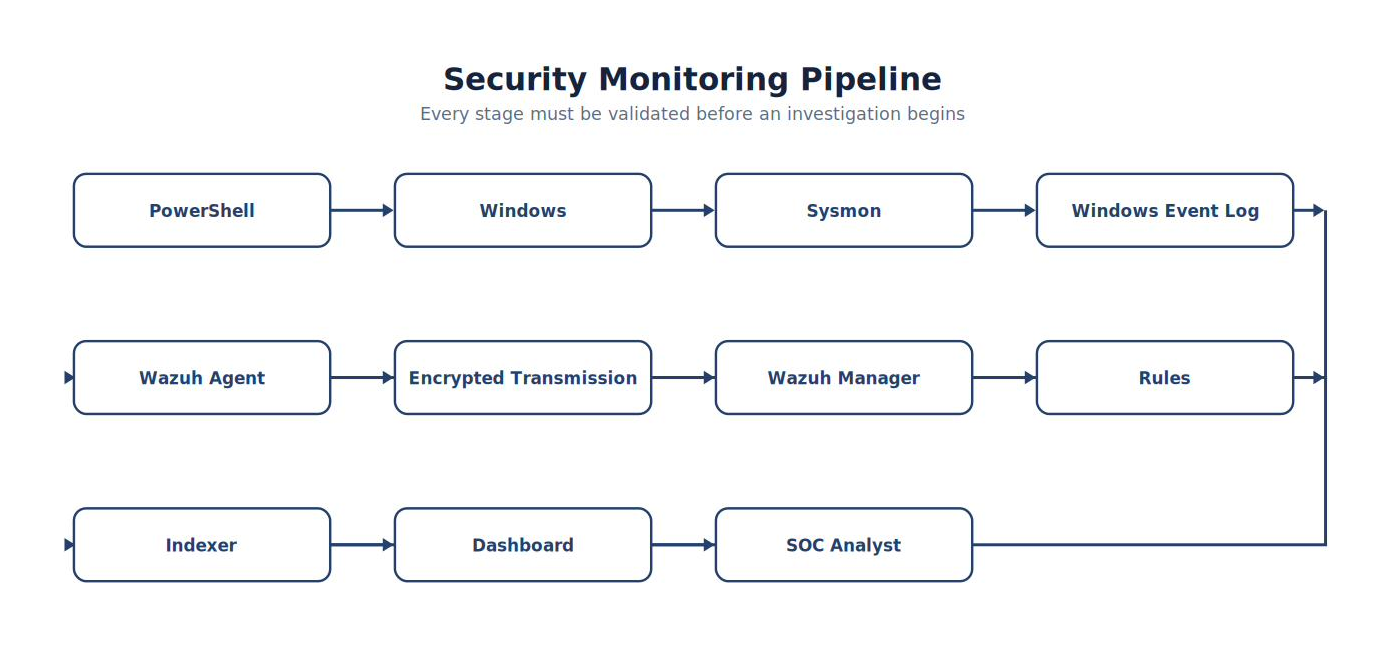
Note. Endpoint and network telemetry move through collection, transport, processing, detection, investigation, and response stages.
Throughout this textbook you will learn to validate every stage of this pipeline.
Best Practice
Never assume your monitoring infrastructure is healthy.
Validate it.
Before beginning an investigation, verify:
- Is the Wazuh Manager running?
- Is the Wazuh Agent connected?
- Is Suricata generating telemetry?
- Is Sysmon logging events?
- Is Windows Defender operational?
- Is the Dashboard receiving data?
- Are timestamps current?
- Are alerts being indexed?
Only after these questions have been answered should an investigation begin. This validation process forms the basis of Lab 0, where you will verify the operational health of every monitoring component before generating your first security alert.
Real-World Example
During one of the laboratory exercises later in this book, students intentionally generated network traffic using Nmap.
Suricata detected the activity correctly.
However, nothing appeared inside the Wazuh Dashboard.
Was the scan missed?
No.
Investigation showed that:
- Suricata had generated the alert.
- The alert was written to eve.json.
- The Wazuh Agent was no longer monitoring the file.
The problem was not detection.
The problem was telemetry collection.
Had students assumed “no alert equals no attack,” they would have reached the wrong conclusion. Instead, by validating each stage of the monitoring pipeline, they identified the actual fault in the telemetry path. This textbook will emphasize this methodology repeatedly because it reflects how professional SOC analysts troubleshoot monitoring systems.
1.6 Security Operations Center Organization and Analyst Roles
Learning Objectives
After completing this section, you should be able to:
- Explain how a modern Security Operations Center is organized.
- Describe the responsibilities of Tier 1, Tier 2, and Tier 3 analysts.
- Differentiate between monitoring, investigation, and incident response.
- Identify the individuals and teams that interact with the SOC.
- Understand how alerts move through the analyst workflow.
The SOC Is More Than Technology
When many people first hear the term Security Operations Center, they immediately think about computer screens filled with dashboards, scrolling alerts, and world maps displaying cyberattacks. While these images are common in movies and marketing materials, they represent only a small portion of what actually makes a SOC effective.
A Security Operations Center is built upon three equally important pillars:
- People
- Processes
- Technology
If any one of these pillars is weak, the effectiveness of the SOC is significantly reduced.
Technology alone cannot investigate incidents.
People alone cannot manually analyze millions of security events each day. Processes ensure that investigations are performed consistently, evidence is preserved, and incidents are handled according to organizational policy. Successful cybersecurity programs require all three components working together.
Figure 1-8
The Three Pillars of a Security Operations Center
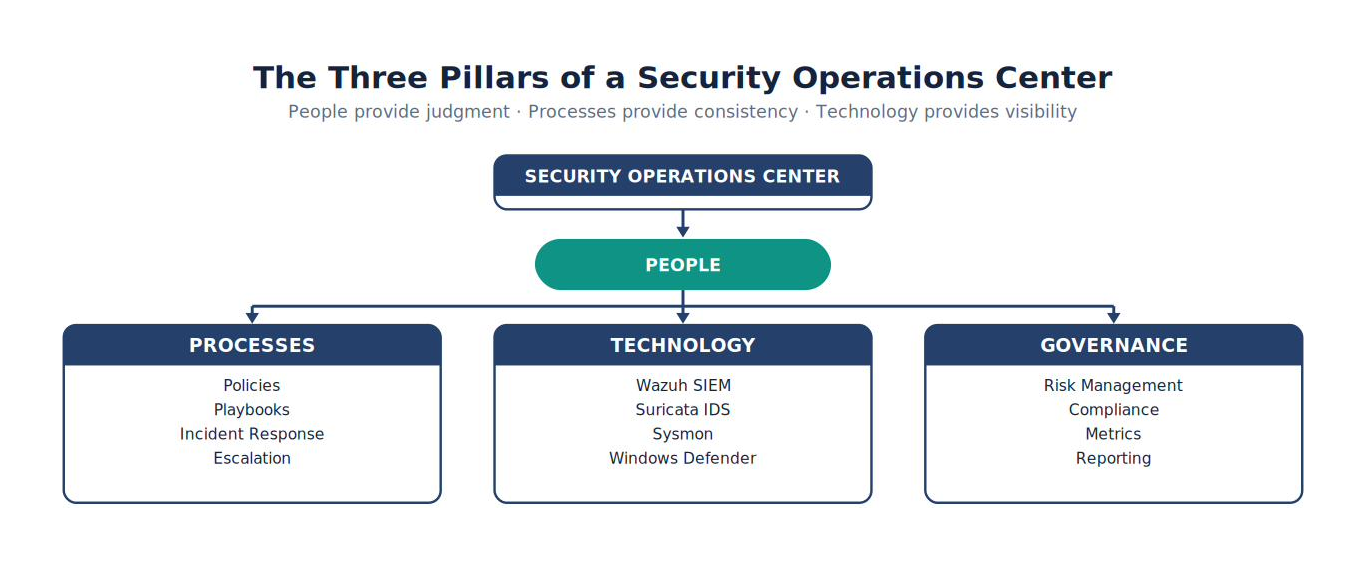
Note. People, process, and technology form the mutually reinforcing foundations of an effective Security Operations Center.
Each pillar reinforces the others.
Technology provides visibility.
Processes provide consistency.
People provide judgment.
The Human Side of Security Operations
Despite advances in automation and artificial intelligence, cybersecurity remains fundamentally a human discipline.
Security products can identify suspicious activity.
They cannot understand organizational context.
Consider the following alert:
PowerShell launched from Microsoft Word
Should the organization declare a security incident?
The answer depends on context.
Perhaps:
- A system administrator intentionally launched PowerShell.
- An instructor demonstrated PowerShell during a classroom exercise.
- An attacker exploited a malicious Office document.
The telemetry is identical.
The context is different.
Only trained analysts can make that determination.
Typical SOC Structure
Although every organization is different, most Security Operations Centers follow a similar organizational structure.
Figure 1-9
Typical SOC Structure
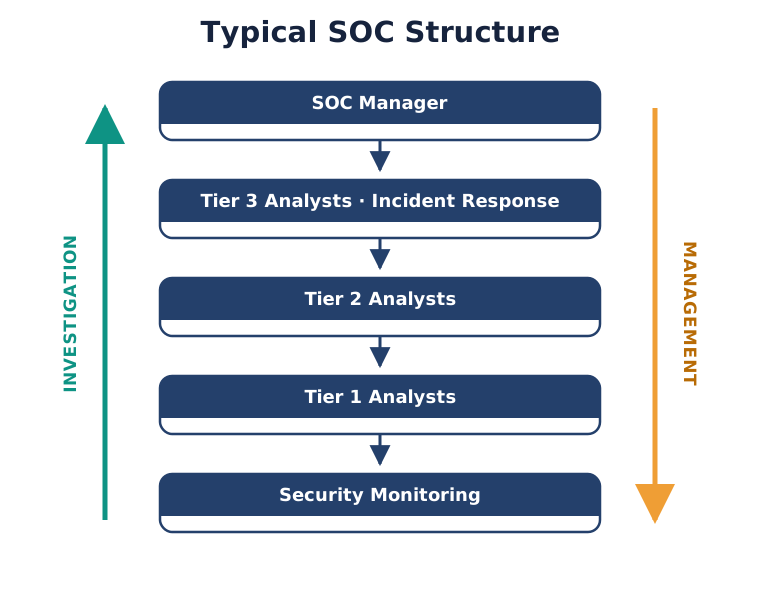
Note. The SOC structure escalates work from initial monitoring through investigation and specialized expertise to coordinated incident response.
Notice that investigations generally begin at the bottom and move upward only when additional expertise is required.
Analyst Tiers at a Glance
The three analyst tiers represent increasing investigative depth, specialization, and responsibility. Actual titles and boundaries vary by organization, but the progression is consistent: Tier 1 validates and prioritizes, Tier 2 reconstructs and explains, and Tier 3 solves complex problems while improving detection capability.
| Tier | Duties | Questions | Example |
|---|---|---|---|
| Tier 1 — Monitoring and triage | Review incoming alerts; validate alert quality; identify obvious false positives; confirm sensor availability; document observations; open or escalate tickets. | Is the alert real? Which system and user are involved? Is the activity ongoing? Has it occurred before? Does it require deeper investigation? | For multiple failed Windows logons, verify the account, search for related failures, check authentication logs, document the result, and escalate when warranted. |
| Tier 2 — Investigation and correlation | Correlate alerts; build timelines; perform host and network investigation; triage malware; review forensic artifacts; identify attacker techniques; conduct focused threat hunts. | What happened before and after the alert? Which parent and child processes were involved? What network, DNS, persistence, or lateral-movement evidence supports the finding? Are other endpoints affected? | For suspicious PowerShell execution, examine the parent process, command line, child processes, network connections, DNS requests, scheduled tasks, registry changes, and related hosts. |
| Tier 3 — Expertise and detection improvement | Analyze complex malware or forensic evidence; reverse engineer tools; research emerging threats; develop and tune detections; mentor analysts; support major incidents and specialized investigations. | What technique or root cause explains the activity? Which visibility or detection gap allowed it? What rule, telemetry, or engineering change will prevent recurrence? Does the finding affect the broader environment? | Analyze a novel technique, reproduce its telemetry safely, create and test a detection, document limitations, and guide Tier 1 and Tier 2 analysts on future handling. |
Tier 1 analysts are not expected to solve every problem; they determine which alerts deserve more investigation. Tier 2 analysts expand beyond the original alert to reconstruct the surrounding activity. Tier 3 analysts apply specialized expertise and spend substantial time improving the SOC itself.
Analyst Tradecraft Tip
Investigate the story, not just the alert.
Reconstruct the timeline surrounding the activity.
Correlate evidence from multiple sensors before reaching a conclusion.
SOC Manager
The SOC Manager oversees daily operations.
Responsibilities include:
- Staffing
- Scheduling
- Performance metrics such as mean time to detect (MTTD) and mean time to respond (MTTR)
- Escalation procedures
- Incident reporting
- Executive communication
- Resource allocation
- Continuous improvement
The SOC Manager ensures that analysts have the people, tools, and processes necessary to perform effective investigations.
Beyond the SOC
Although the Security Operations Center plays a central role in cyber defense, it does not operate in isolation.
A typical investigation may involve:
| Team | Example Responsibilities |
|---|---|
| IT Operations | Restore servers and workstations |
| Network Engineering | Firewall changes, switch configuration |
| System Administration | Account management, patching |
| Legal Counsel | Regulatory compliance |
| Human Resources | Insider threat investigations |
| Executive Leadership | Business decisions |
| Public Relations | External communications |
| Law Enforcement | Criminal investigations |
Cybersecurity is a team effort.
The SOC serves as the technical coordination point during many incidents, but successful response often requires cooperation across the entire organization.
The Analyst Workflow
Although every organization has its own procedures, most investigations follow a similar pattern.
Figure 1-10
The Analyst Workflow
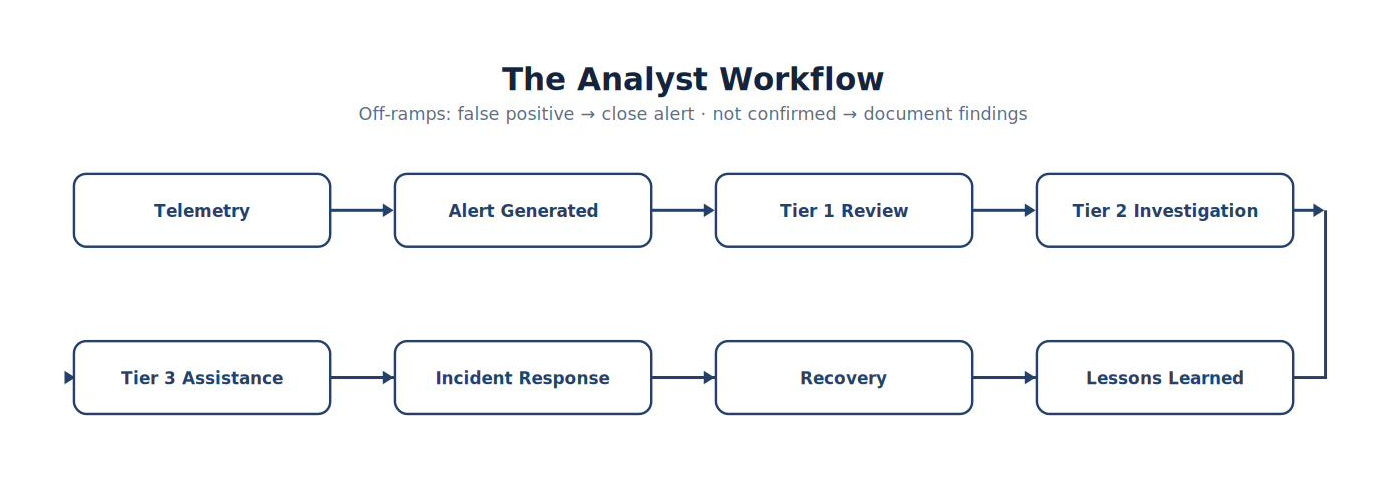
Note. The analyst workflow moves from alert review through validation, scoping, evidence collection, conclusion, documentation, and improvement.
This workflow emphasizes an important principle:
Not every alert becomes an incident.
In fact, the overwhelming majority of alerts investigated by SOC analysts are ultimately determined to be benign, expected, or low risk. Understanding this helps analysts remain objective during investigations and prevents unnecessary escalation.
Best Practice
A mature Security Operations Center measures success not by the number of alerts generated, but by the organization’s ability to:
- Detect threats quickly.
- Investigate efficiently.
- Respond consistently.
- Learn from each incident.
- Continuously improve detection capabilities.
A SOC that generates thousands of alerts but cannot prioritize or investigate them effectively is less effective than a SOC that generates fewer, higher-quality (Knerler et al., 2022) alerts supported by disciplined investigative processes. The industry term for the desensitization caused by excessive low-quality alerts is alert fatigue—a leading cause of missed detections and analyst burnout, and one of the primary problems detection engineering (Chapter 5) exists to solve.
1.7 A Day in the Life of a SOC Analyst
Learning Objectives
After completing this section, you should be able to:
- Describe the daily responsibilities of a SOC analyst.
- Explain the importance of shift turnover and operational awareness.
- Follow the lifecycle of a security investigation from initial detection through incident determination.
- Understand how multiple security technologies contribute to a single investigation.
- Recognize why validation of the monitoring infrastructure always precedes incident analysis.
Introduction
Cybersecurity is often portrayed as a profession filled with constant attacks, flashing dashboards, and emergency response. While major incidents certainly occur, the daily work of a Security Operations Center is far more methodical.
A successful SOC is built upon discipline rather than excitement.
Every shift begins by answering a simple question:
“Can I trust the information I am about to investigate?”
Only after the monitoring infrastructure has been verified do analysts begin reviewing alerts. This disciplined approach prevents analysts from wasting valuable time investigating problems caused by failed sensors, disconnected agents, or misconfigured logging systems. Throughout this textbook you will learn that operational validation always precedes threat investigation.
Starting the Day
Imagine you are the morning Tier 1 analyst arriving for your shift. Before examining a single alert, you review the operational status of the monitoring environment.
Typical questions include:
- Is the Wazuh Manager running?
- Are all agents connected?
- Is the Dashboard receiving new events?
- Is Suricata generating alerts?
- Is Sysmon logging events?
- Are Windows Defender updates current?
- Are timestamps synchronized?
- Did any critical services restart overnight?
Notice that none of these questions concern attackers.
They concern visibility.
Without visibility, investigations become unreliable.
Figure 1-11
Daily SOC Startup Checklist
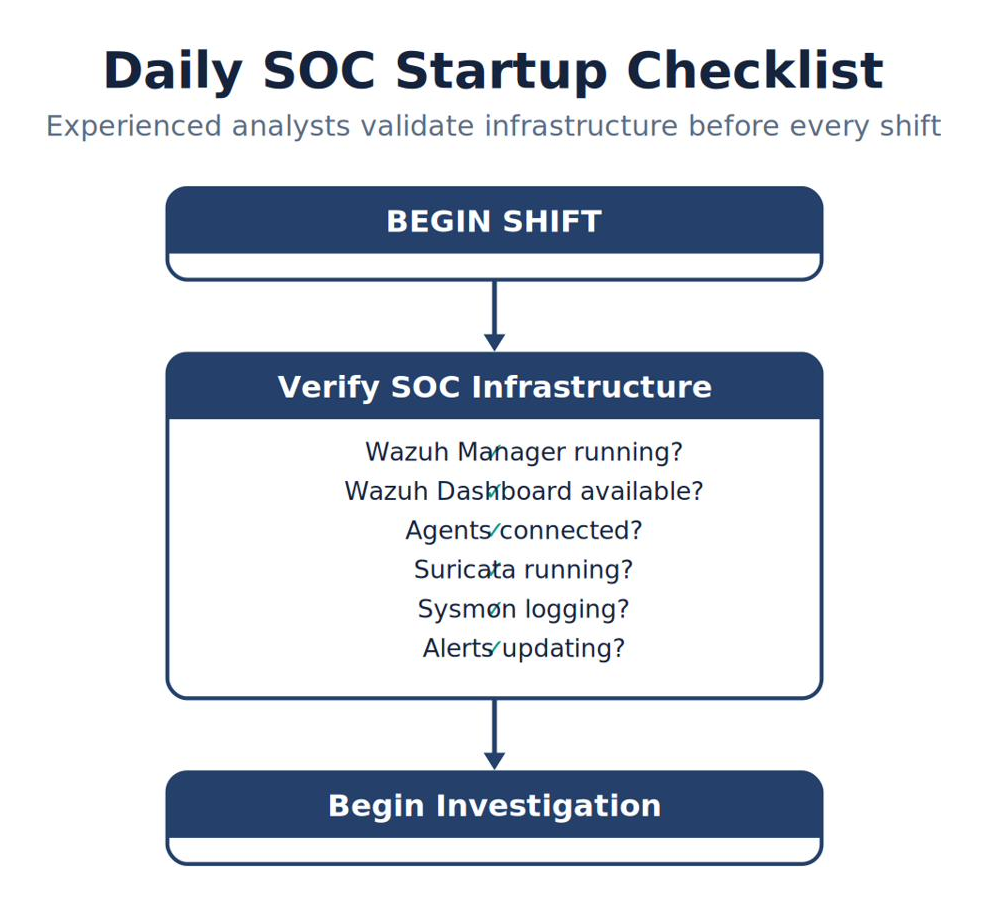
Note. The startup checklist verifies platform health, sensor coverage, data freshness, rule status, and analyst readiness before alert review begins.
This startup checklist may appear simple, but experienced analysts perform it every day.
Reviewing Overnight Activity
Once the monitoring infrastructure has been validated, analysts review events generated since the previous shift. This process is commonly called shift turnover.
The outgoing analyst documents:
- Active investigations
- Newly discovered alerts
- Systems under observation
- Outstanding incident tickets
- Known infrastructure issues
- Planned maintenance activities
The incoming analyst continues where the previous shift ended. Good documentation ensures investigations continue smoothly regardless of personnel changes.
Your SOC Engineering Notebook
Documentation is not an afterthought in security operations—it is a Tier 1 responsibility. Beginning with Lab 0, you will maintain a SOC Engineering Notebook: a running record of your laboratory’s configuration and operational baselines.
Record in it:
- Software versions (Wazuh, Suricata, loaded rule counts)
- Hostnames, agent names, IP addresses, and interface roles
- Validation dates and results
- Every change you make, and why
- Problems encountered and how you resolved them
The notebook turns future troubleshooting from archaeology into lookup. When something breaks after an update, your notebook tells you what “working” looked like. Every professional SOC maintains exactly this kind of operational baseline.
Reviewing the Dashboard
The analyst opens the Wazuh Dashboard.
Several alerts are visible.
| Time | Alert |
|---|---|
| 02:14 | Multiple Failed Windows Logons |
| 03:09 | Suricata – Possible Port Scan |
| 04:56 | Windows Defender Malware Detected |
| 06:33 | Suspicious PowerShell Execution |
| 07:02 | Agent Reconnected |
At first glance, these alerts appear unrelated.
The analyst begins examining them individually.
Alert 1 — Multiple Failed Logons
The first alert indicates repeated authentication failures against a Windows workstation.
Initial questions include:
- Which account failed?
- From which IP address?
- Did authentication eventually succeed?
- Has this account generated similar alerts previously?
- Is the activity still occurring?
The analyst discovers the failures occurred immediately before a successful login.
This may indicate:
- A user forgetting a password.
- An outdated scheduled task.
- An automated service using an expired password.
- Password spraying.
- Brute-force authentication.
At this stage, several explanations remain possible.
The investigation continues.
Alert 2 — Suricata Detects a Port Scan
The next alert originates from Suricata.
The signature reports:
ET SCAN Potential SSH Scan
The analyst asks:
- Which host performed the scan?
- Which destination was targeted?
- How many ports were contacted?
- Was the activity internal or external?
- Is the source known?
Additional investigation reveals that the source IP belongs to another machine within the laboratory. Reviewing the activity log confirms that the instructor intentionally executed an Nmap scan as part of a classroom exercise.
The alert is legitimate.
The activity is expected.
No incident exists.
Analyst Tradecraft Tip
Students often believe that if an alert is real, then an attack must have occurred.
Not true.
The Suricata alert correctly identified scanning activity.
Its job is detection—not determining intent.
The analyst must provide context.
In this case, the detection was accurate, but the activity was authorized. Good analysts distinguish between malicious activity and expected activity that resembles malicious behavior.
Alert 3 — Windows Defender Malware Detection
The next alert originates from Microsoft Defender.
Windows Defender reports:
Trojan:Script/Wacatac
Before declaring an incident, the analyst gathers additional information.
Questions include:
- Which file triggered the alert?
- Was the file quarantined?
- Did the user execute it?
- Did Sysmon observe process creation?
- Did Suricata detect outbound communication?
- Did additional systems observe similar activity?
The investigation shows:
- Defender quarantined the file immediately.
- Sysmon shows no execution.
- Suricata observed no suspicious network traffic.
- The file was the EICAR antivirus test file used during laboratory validation (EICAR, n.d.).
The alert demonstrates that Defender is functioning correctly. It does not indicate an active compromise.
Alert 4 — Suspicious PowerShell
The fourth alert receives greater attention.
Sysmon reports:
- PowerShell launched.
The parent process is:
WINWORD.EXE
This immediately attracts the analyst’s attention.
Microsoft Word rarely launches PowerShell during normal operation.
Additional telemetry is collected.
The analyst examines:
- Command-line arguments
- Child processes
- Network connections
- DNS queries
- Registry modifications
- Scheduled tasks
- Defender events
- Suricata alerts
Each piece of telemetry contributes another part of the story.
Figure 1-12
Multi-Sensor Investigation
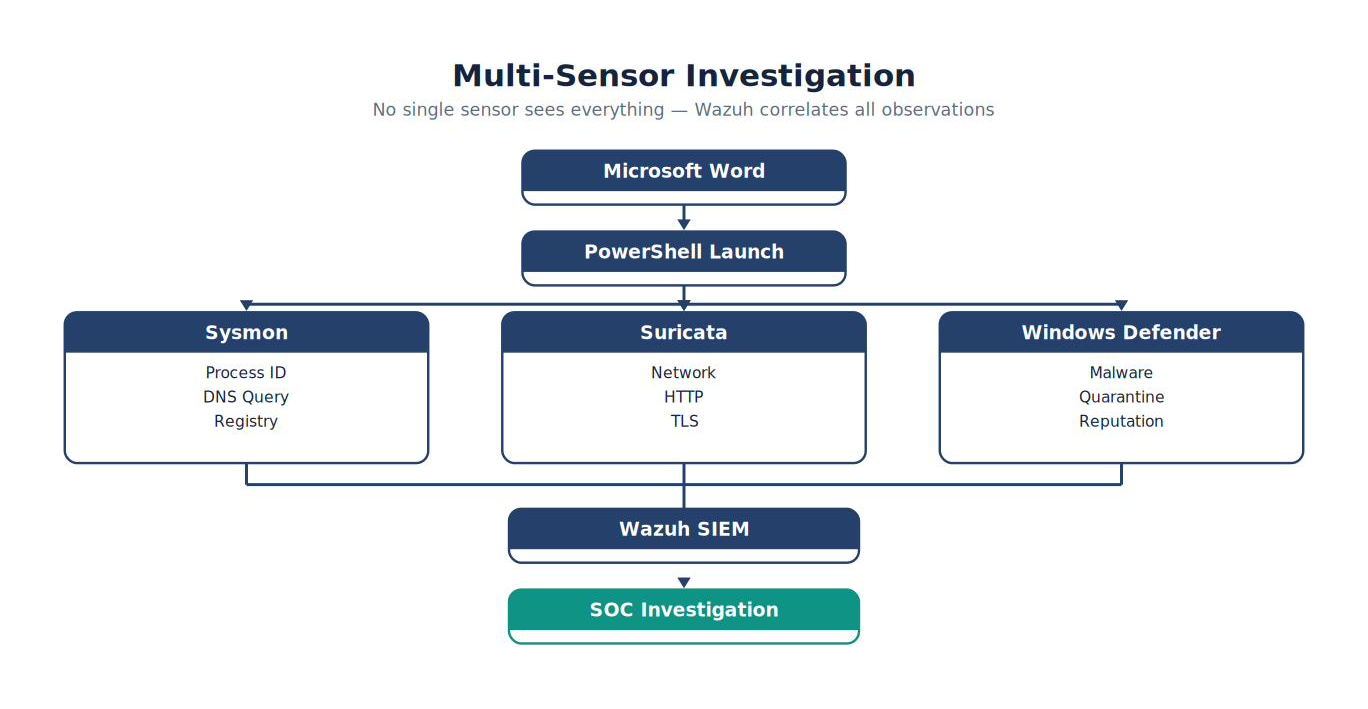
Note. Endpoint, network, identity, and security-control telemetry provide complementary evidence for a single investigation.
Notice that no single technology provides the complete picture.
Each contributes one piece of evidence.
Wazuh collects these observations into a single investigative workspace.
Correlation
Correlation is one of the most valuable capabilities of a SIEM. Rather than reviewing each alert independently, the analyst recognizes relationships.
The following observations occur within two minutes:
- Word launches PowerShell.
- PowerShell contacts an external IP address.
- Suricata detects suspicious HTTP traffic.
- Defender quarantines a downloaded executable.
Viewed separately, these observations may appear unrelated. Viewed together, they strongly suggest malicious activity. Correlation transforms isolated observations into investigative intelligence (Kent & Souppaya, 2006).
Best Practice
Always investigate the timeline, not just the alert.
Ask:
- What happened before this event?
- What happened immediately afterward?
- Which additional systems observed related activity?
- Which user was logged in?
- Did network activity increase?
- Did the endpoint change state?
Building a timeline often reveals relationships that individual alerts cannot.
The Investigation Ends
After reviewing all available telemetry, the analyst concludes:
- The failed logons resulted from a mistyped password.
- The Suricata port scan was an authorized classroom exercise.
- Defender correctly quarantined the EICAR test file.
- The PowerShell execution originated from an approved administrative script distributed by IT.
None of the alerts represented malicious activity.
No incident ticket is opened.
The shift continues.
Lessons Learned
Many beginning students would describe this shift as “nothing happened.”
An experienced analyst sees it differently.
The shift successfully demonstrated:
- Wazuh collected telemetry.
- Sysmon generated endpoint events.
- Suricata detected network activity.
- Windows Defender identified malware.
- Correlation worked correctly.
- Analysts validated every alert.
- The monitoring infrastructure proved trustworthy.
This was a successful operational day.
One of the goals of a Security Operations Center is not simply to find attackers—it is to maintain confidence that the organization’s monitoring systems are functioning correctly and will detect malicious activity when it occurs.
A Common Language for Adversary Behavior — MITRE ATT&CK
During the shift described above, the analyst investigated a port scan, suspicious PowerShell, and a malware detection. Security professionals worldwide describe these behaviors using a shared vocabulary: MITRE ATT&CK, a publicly available knowledge base of adversary tactics (the attacker’s goals) and techniques (how those goals are achieved), each assigned a unique identifier (MITRE Corporation, n.d.-a).
For example:
| Activity | ATT&CK Technique | ID |
|---|---|---|
| Nmap port scan | Network Service Discovery | T1046 |
| PowerShell execution | Command and Scripting Interpreter: PowerShell | T1059.001 |
| Malicious file download | User Execution: Malicious File | T1204.002 |
ATT&CK provides analysts three practical benefits. First, it supplies precise, shared terminology—“T1046” means the same thing in every SOC on Earth (MITRE Corporation, n.d.-a). Second, it helps analysts reason about coverage: which techniques can our sensors see, and which are blind spots? Third, it organizes threat hunting—later chapters use ATT&CK techniques as hunting hypotheses.
You will encounter ATT&CK immediately. Lab 0 maps every validation activity you perform to the technique it simulates, so you learn what each technique looks like in telemetry under controlled, known conditions—before you must find it during an investigation.
1.8 Building Your First Security Operations Center Laboratory
Learning Objectives
After completing this section, you should be able to:
- Describe the architecture of the laboratory used throughout this textbook.
- Identify the purpose of each virtual machine in the environment.
- Explain the role of Wazuh, Suricata, Sysmon, and Windows Defender.
- Understand how security telemetry flows through the laboratory.
- Recognize why a properly designed laboratory mirrors the workflow of a production Security Operations Center.
Why Build a Laboratory?
Reading about cybersecurity is valuable.
Watching demonstrations is helpful.
However, cybersecurity is ultimately a practical discipline. Professional analysts develop expertise by configuring systems, generating telemetry, validating alerts, troubleshooting failures, and investigating real security events. Throughout this textbook you will build and operate your own Security Operations Center using enterprise security software. Unlike many classroom exercises that rely on simulated screenshots or prerecorded demonstrations, every alert, log entry, and investigation in this book is generated by your own laboratory. When something fails—and eventually it will—you will learn to troubleshoot the problem exactly as a SOC analyst would in a production environment.
That experience is invaluable.
Laboratory Philosophy
The laboratory is intentionally small.
Its purpose is not to replicate a Fortune 500 data center. Instead, it provides a realistic environment in which every component has a clear purpose. As you progress through the textbook, you will understand how each system contributes to the overall monitoring pipeline. Although the environment consists of only a few virtual machines, the architecture closely resembles that of much larger enterprise deployments. The same investigative techniques apply whether monitoring ten systems or ten thousand.
Laboratory Architecture
The laboratory consists of five primary components.
- Wazuh Server v4.14.5 (Manager, Indexer, and Dashboard)
- Ubuntu 26.04 Network Sensor (dual network interface)
- Windows 11 Pro Workstation
- Security Onion 14.04.5.2 (comparison network security monitoring platform; hostname
SO14) - VMware Virtual Network
Each component contributes unique telemetry to the Security Operations Center.
Throughout this textbook—and in every laboratory—refer to systems by their exact hostnames, agent names, and IP addresses:
| System | Hostname | Agent Name | IP Address | Role |
|---|---|---|---|---|
| Wazuh Server 4.14.5 | WAZUH-SRV | — | 192.168.1.30 | SIEM — Manager, Indexer, Dashboard |
| Ubuntu 26.04 Sensor | UB2604 | u2604 | 192.168.1.10 (ens160) / no IP (ens192) | Suricata NIDS + Wazuh Agent (dual-NIC) |
| Windows 11 Pro | WIN11 | win11 | 192.168.1.40 | Endpoint — Sysmon + Wazuh Agent |
| Security Onion 14.04.5.2 | SO14 | — | 192.168.1.20 (eth0); eth1 sniffing, no IP | Comparison NSM platform |
A note on names: hostnames are uppercase (UB2604, WIN11), but the Wazuh agent names used in Dashboard queries were set at enrollment in lowercase (u2604, win11). Wazuh queries are case-sensitive—agent.name:“u2604” returns events, while agent.name:“U2604” returns nothing. This distinction becomes important the moment you run your first query in Lab 0.
Figure 1-13
Laboratory Architecture
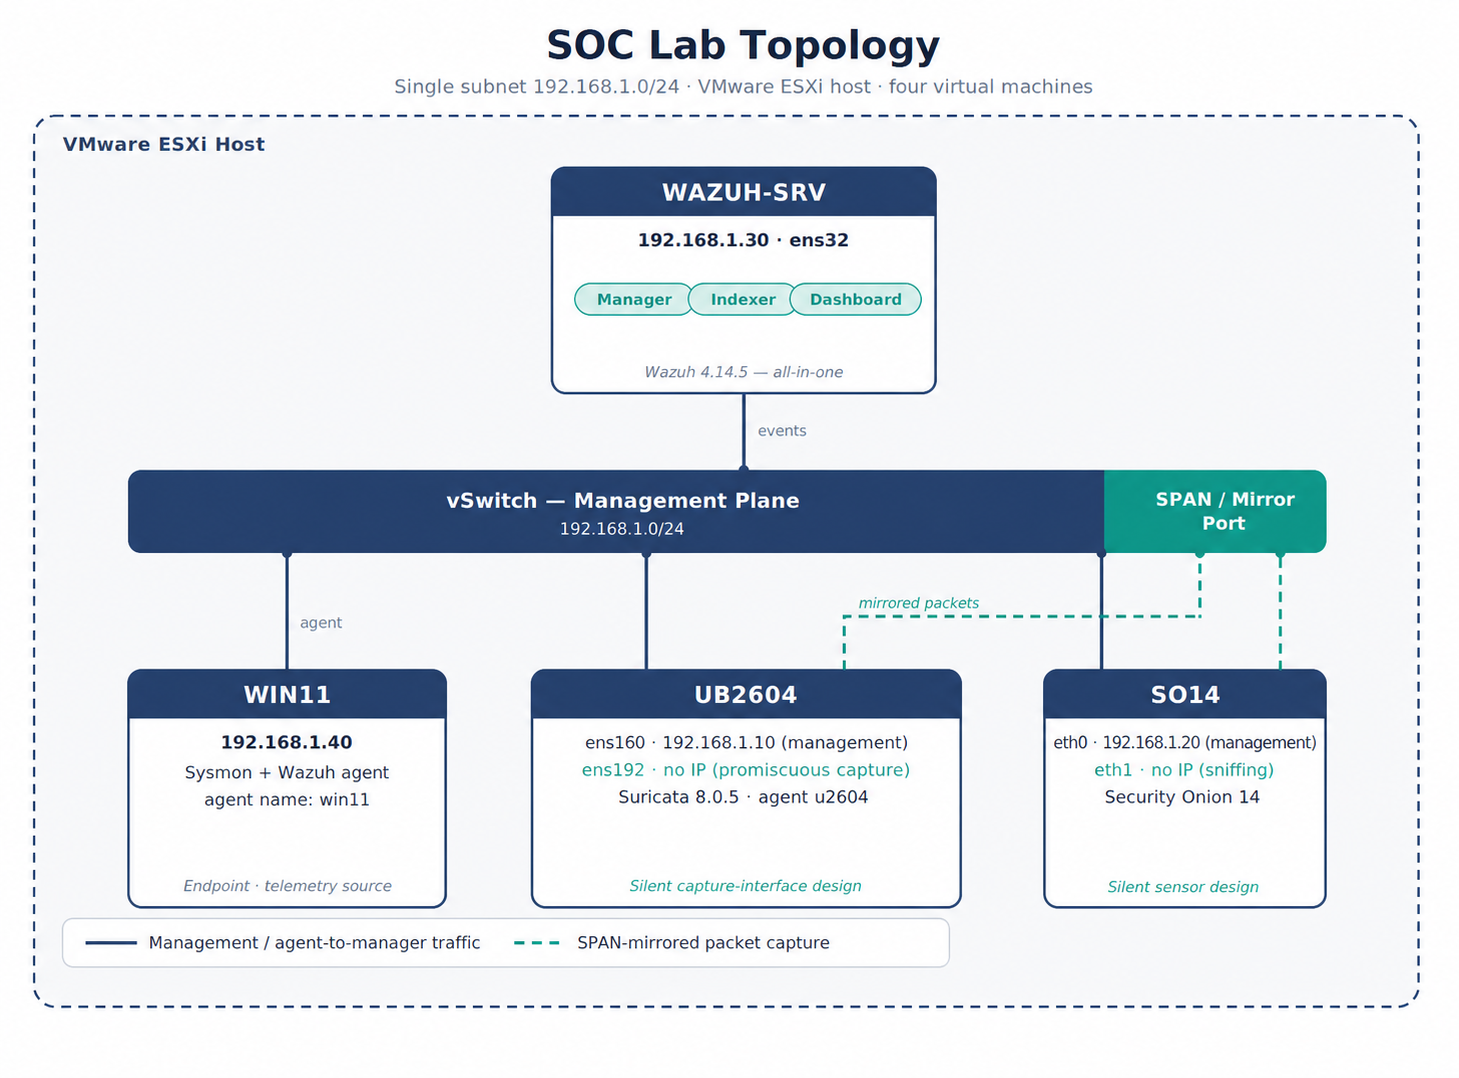
Note. The laboratory connects the Wazuh platform, Windows endpoint, and Ubuntu network sensor so endpoint and network telemetry can be correlated.
The Wazuh Manager
The Wazuh Manager serves as the operational center of the laboratory. Throughout this textbook it performs several critical functions.
It:
- Receives telemetry from agents.
- Processes incoming events.
- Applies decoders.
- Executes detection rules.
- Generates alerts.
- Stores security information.
- Presents information within the Dashboard.
Think of the Wazuh Manager as the central nervous system of the Security Operations Center.
Every investigation eventually leads here.
Ubuntu Network Sensor
The Ubuntu virtual machine serves two important purposes. First, it operates as a standard Linux endpoint monitored by the Wazuh Agent. Second, it functions as the laboratory’s dedicated Network Intrusion Detection System by running Suricata.
To perform both roles reliably, the Ubuntu sensor is configured with two network interfaces:
- ens160 (192.168.1.10) handles normal system traffic — management access, software updates, and communication with the Wazuh Manager.
- ens192 carries no IP address and operates in promiscuous mode, dedicated entirely to Suricata. Its only job is to see the traffic Suricata needs to inspect.
Notice what ens192 does not have: an address. This is the passive (silent) sensor design used in production SOCs. Because a silent interface cannot be addressed, scanned, or attacked, the sensor is effectively invisible on the segment it monitors — an attacker who compromises a host on that network has no way to discover that anything is listening.
Some laboratory deployments instead give the capture interface an IP address as well — the addressed sensor design. It simplifies administration, because the capture interface can be reached directly, but it trades away the sensor’s invisibility and gives an attacker something to find.
Your laboratory uses the silent design on both sensors: UB2604’s ens192 and Security Onion’s eth1 are each promiscuous with no address. The two sensors still differ in an important way. UB2604 is dual-homed — one interface manages the host and runs the Wazuh Agent, a second one captures — while Security Onion is a dedicated appliance whose entire purpose is capture. Chapter 3 walks through configuring both.
Separating management traffic from monitoring traffic onto different interfaces is standard practice for network sensors in production SOCs. Suricata observes network traffic rather than activity occurring inside Windows. It examines packets, applies thousands of Emerging Threats signatures, and records findings within eve.json. Those findings are forwarded to Wazuh where they become searchable alerts. This separation between endpoint monitoring and network monitoring reflects real enterprise deployments.
Emerging Threats Open
Suricata is only as effective as the detection rules it evaluates. Throughout this textbook the laboratory uses the Emerging Threats Open rule set (Proofpoint, n.d.).
These community-maintained signatures identify thousands of known attack techniques including:
- Port scanning
- Malware downloads
- Command-and-control communication
- DNS tunneling
- Web application attacks
- Protocol anomalies
- Exploit attempts
Later chapters explain how these signatures are organized, updated, enabled, disabled, and customized. Students will also learn to create their own Suricata rules.
Windows 11 Workstation
The Windows workstation is the primary endpoint investigated throughout the book. It represents a typical user computer inside an enterprise network.
The workstation runs:
- Windows 11 Pro
- Wazuh Agent
- Sysmon
- Microsoft Defender
Together these technologies generate rich endpoint telemetry. Rather than relying upon simulated attack data, students will create their own telemetry through laboratory exercises.
Examples include:
- PowerShell execution
- DNS lookups
- File creation
- Network connections
- EICAR antivirus testing
- Nmap scanning
- Windows authentication
- Registry changes
Every activity becomes an opportunity to practice investigation.
Sysmon
Sysmon is one of the most valuable tools available to a SOC analyst. Unlike standard Windows logging, Sysmon provides detailed information about security-relevant operating system activity (Russinovich & Garnier, n.d.).
Throughout the book you will investigate events including:
- Process Creation (Event ID 1)
- Network Connections (Event ID 3)
- Create Remote Thread (Event ID 8)
- File Creation (Event ID 11)
- DNS Queries (Event ID 22)
These events become the foundation for many later threat hunting exercises.
Microsoft Defender
Microsoft Defender provides another independent source of telemetry (Microsoft, n.d.). Although many people think of Defender only as antivirus software, it also contributes valuable investigative information.
Examples include:
- Malware detection
- Quarantine actions
- Reputation analysis
- Threat severity
- Scan results
- Protection history
Because Defender operates independently of Sysmon and Suricata, it provides additional evidence that analysts can use during investigations.
Security Onion
The laboratory also includes Security Onion (Security Onion Solutions, n.d.). Its purpose is not to replace Wazuh. Instead, it allows students to compare different approaches to network security monitoring.
Students can observe:
- How multiple monitoring platforms process identical traffic.
- Differences between detection engines.
- Variations in dashboards.
- Alternative investigative workflows.
This comparison helps students appreciate that security operations is larger than any individual product.
Telemetry Flow Through the Laboratory
One of the most important concepts introduced in this chapter is the complete telemetry pipeline.
Consider the following scenario.
A user executes PowerShell on the Windows workstation.
The telemetry follows this path:
Figure 1-14
Endpoint Telemetry Pipeline
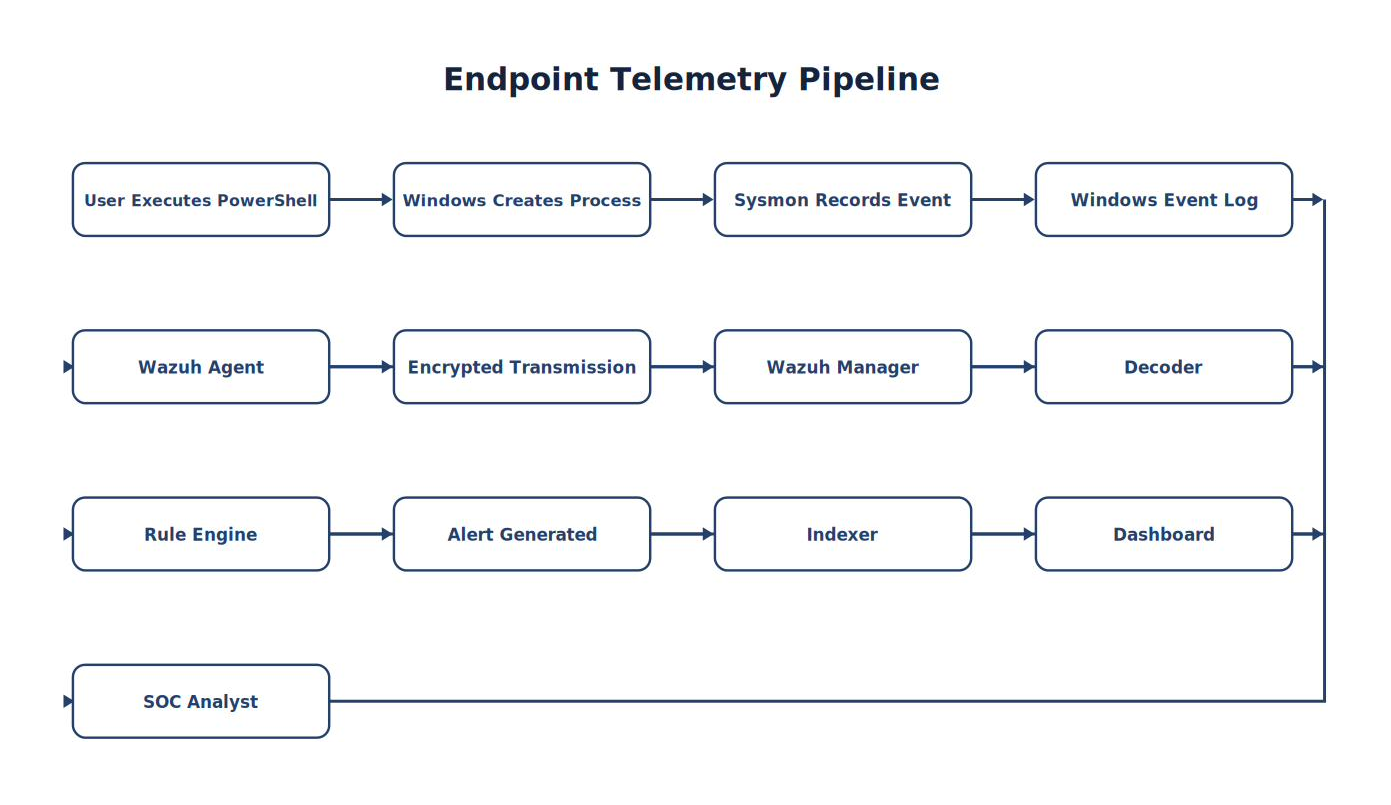
Note. Endpoint actions generate operating-system telemetry that the Wazuh agent forwards to the Wazuh platform for analysis.
Now consider a network scan.
Figure 1-15
Network Detection Pipeline
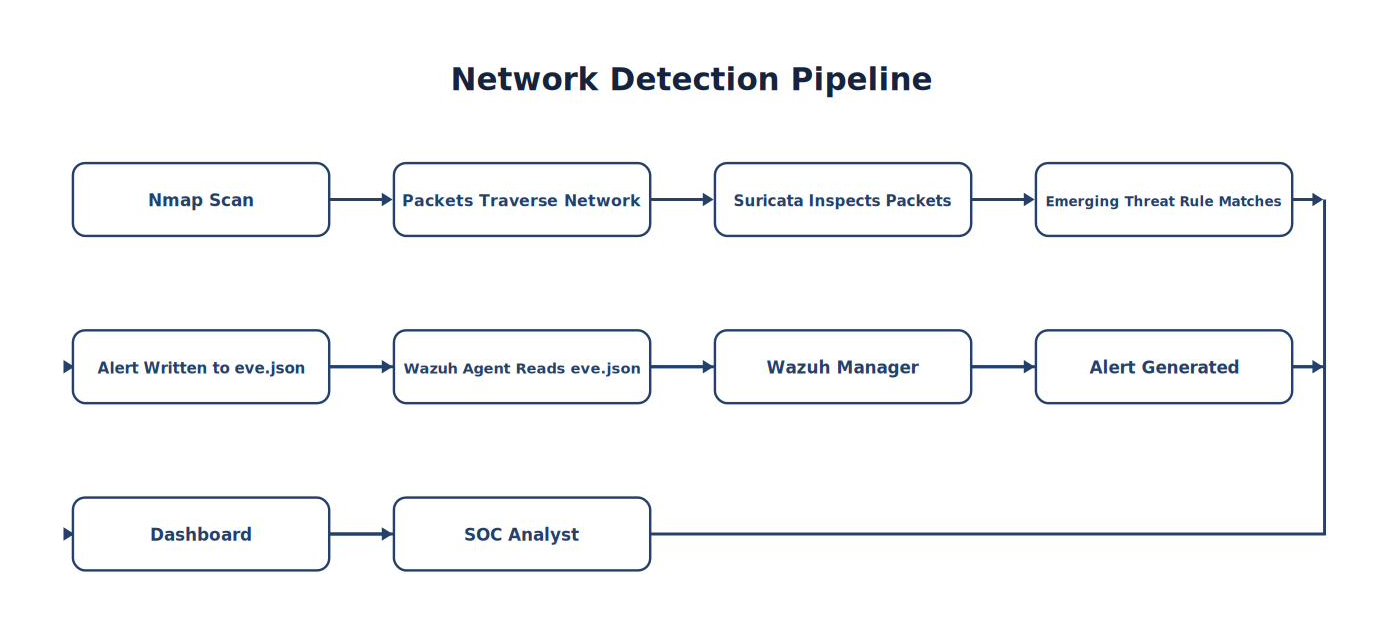
Note. Network activity is observed by Suricata, converted into alerts and logs, and forwarded to Wazuh for correlation.
Although the telemetry originates from different sources, it ultimately reaches the same destination. This unified view is one of the defining characteristics of a Security Information and Event Management platform.
Analyst Tradecraft Tip
When an expected alert is missing, do not conclude “Wazuh is broken.” Ask: Where did the telemetry stop? Trace the evidence from sensor to agent, Manager, rule engine, Indexer, and Dashboard until you find the broken handoff.
Change One Variable at a Time
Never introduce multiple changes simultaneously.
If you install Suricata, modify HOME_NET, update Emerging Threats rules, edit the Wazuh Agent configuration, and restart several services at once, identifying the source of a problem becomes difficult. Professional analysts make one change at a time.
After each change they:
- Restart the appropriate service.
- Validate operation.
- Generate test telemetry.
- Confirm the expected result.
- Document the outcome.
This disciplined methodology dramatically reduces troubleshooting time and is one of the most valuable operational habits you can develop.
Preparing for the Journey
You now understand:
- Why Security Operations Centers exist.
- How cyber defense evolved.
- The difference between events, alerts, and incidents.
- The importance of security telemetry.
- The roles within a modern SOC.
- How analysts investigate alerts.
- The architecture of the laboratory you will build.
How the Labs Work
The laboratory exercises follow a deliberate two-track structure. Lab 0 validates the environment you build in Chapter 3 and Appendix A—it becomes the standard operational health check you repeat before every future exercise. Labs 1–4 then place you in pre-built vendor cloud environments for guided SIEM familiarization, configuration and attack analysis, analyst use-case walkthroughs, and a full ransomware investigation. Beginning with Lab 5, you return to your own environment for progressively deeper investigations using Sysmon telemetry, Emerging Threats detections, threat intelligence, and a capstone correlation exercise.
Beginning with the next chapter, we transition from concepts to implementation.
You will start building the technologies that form the Security Operations Center described throughout this chapter, beginning with one of the most important platforms in modern cybersecurity:
Security Information and Event Management (SIEM).
Before installing Wazuh, however, you must first understand what a SIEM is, why organizations depend on it, and how it transforms millions of security events into actionable intelligence.
That is the focus of Chapter 2 – Understanding Security Information and Event Management (SIEM).
1.9 Chapter Summary
Throughout this chapter, you have been introduced to the fundamental concepts that define a modern Security Operations Center (SOC). Before learning how to install or configure security technologies, it is essential to understand the mission they serve.
A SOC is much more than a room full of computers displaying dashboards. It is an operational function that combines people, processes, and technology to continuously monitor, detect, investigate, and respond to cybersecurity threats. Technology generates data, but trained analysts transform that data into actionable intelligence through disciplined investigation (Knerler et al., 2022).
You also learned that cybersecurity monitoring is built upon security telemetry. Every operating system, application, firewall, intrusion detection system, and endpoint security product continuously generates information describing what is occurring within the environment (Kent & Souppaya, 2006). This telemetry becomes the raw material used by a SIEM to identify suspicious activity (Kent & Souppaya, 2006).
One of the most important concepts introduced in this chapter is the distinction between an event, an alert, and an incident.
- An event is simply something that happened (Cichonski et al., 2012).
- An alert is an event (or collection of events) that matches predefined detection logic (Scarfone & Mell, 2007).
- An incident is a confirmed security event requiring organizational response (Cichonski et al., 2012).
Understanding this progression is essential because the overwhelming majority of alerts investigated by SOC analysts never become incidents (Knerler et al., 2022).
You were also introduced to the concept of Defense in Depth. Modern organizations no longer rely on a single security product to protect their infrastructure. Instead, multiple technologies provide overlapping visibility into endpoint activity, network traffic, authentication, malware detection, and operating system behavior.
The laboratory you will build throughout this textbook reflects this philosophy.
Each technology contributes a unique perspective:
| Technology | Primary Visibility |
|---|---|
| Wazuh | Centralized monitoring, correlation, alerting |
| Suricata | Network traffic inspection |
| Sysmon | Endpoint activity |
| Windows Defender | Malware protection |
| Windows Event Logs | Operating system events |
| Ubuntu Linux | Network sensor and endpoint |
| Emerging Threats | Detection intelligence |
Although each technology operates independently, together they provide a comprehensive view of organizational activity.
Finally, you learned perhaps the most important operational principle in this textbook:
Never investigate an alert until you have verified your telemetry.
A missing alert may indicate:
- A disconnected agent.
- A failed logging service.
- A misconfigured rule.
- A network connectivity problem.
- A full index.
- A stopped security service.
Professional analysts validate their monitoring infrastructure before drawing conclusions. This philosophy will guide every laboratory exercise throughout this book.
Chapter 1 Key Terms
Students should understand the following terms before beginning Chapter 2.
| Term | Definition |
|---|---|
| Alert | An event, or collection of related events, that satisfies detection logic and therefore requires analyst attention. |
| Alert Fatigue | Analyst desensitization caused by excessive low-quality alerts, increasing the risk of missed detections. |
| Correlation | Associating multiple related events — across time, host, user, or network, and often from multiple telemetry sources — into a single coherent picture that identifies meaningful activity. |
| Detection Rule | Manager-side logic that evaluates decoded fields and, when its conditions match, assigns a severity level and generates an alert. |
| Endpoint | A device such as a workstation or server connected to the network. |
| Event | Any recorded activity generated by a system, application, or device. |
| Extended Detection and Response (XDR) | A platform approach that unifies detection and response across endpoints, networks, and cloud workloads. |
| False Negative | Malicious or policy-violating activity that produced no alert. |
| False Positive | An alert triggered by benign activity. |
| Incident | A confirmed security event requiring response. |
| Intrusion Detection System (IDS) | A system that monitors network or host activity for suspicious behavior. |
| MITRE ATT&CK | A publicly available, globally used knowledge base of adversary tactics and techniques, based on real-world observations, each assigned a unique identifier. |
| Security Information and Event Management (SIEM) | A platform that centralizes security telemetry collection, normalization, correlation, analysis, and investigation. |
| Security Operations Center (SOC) | An organizational function responsible for monitoring, detecting, investigating, and responding to cybersecurity threats. |
| Security Telemetry | Security-related data (logs, events, alerts) generated by monitored systems, applications, networks, and security products. |
| Threat Hunting | Proactively searching for evidence of adversary activity that has not generated an automated alert. |
| Tier 1 Analyst | Initial alert monitoring and triage. |
| Tier 2 Analyst | Detailed investigation and correlation. |
| Tier 3 Analyst | Advanced technical specialist responsible for detection engineering and complex investigations. |
| True Positive | An alert that correctly identified genuinely malicious activity. |
| Wazuh | Open-source SIEM and XDR platform used throughout this textbook. |
Knowledge Check
Select the best answer for each question.
1. What is the primary purpose of a Security Operations Center?
A. Install antivirus software
B. Continuously monitor, detect, investigate, and respond to cybersecurity events
C. Manage user accounts
D. Configure routers
2. Which statement best defines an event?
A. A confirmed cyberattack
B. A malware infection
C. A firewall rule
D. Any recorded system activity
3. Every incident begins as:
A. An alert
B. A firewall rule
C. A software update
D. A help desk ticket
4. Which technology primarily provides network visibility in our laboratory?
A. Sysmon
B. Windows Defender
C. Suricata
D. PowerShell
5. Which technology primarily records Windows process creation?
A. DNS Server
B. Sysmon
C. VMware
D. Active Directory
6. Which statement best describes telemetry?
A. Security observations generated by systems
B. A security incident
C. Firewall rules
D. Antivirus definitions
7. Which technology correlates alerts from multiple security products?
A. Suricata
B. Sysmon
C. Windows Defender
D. Wazuh
8. Which SOC tier performs initial alert triage?
A. Tier 1
B. Tier 2
C. Tier 3
D. Executive Management
9. Before investigating an alert, what should always be verified?
A. Monitoring infrastructure and telemetry
B. Windows Updates
C. Password Policy
D. Browser history
10. Which statement best summarizes this chapter?
A. Install software first.
B. Trust every alert.
C. Every alert is an incident.
D. Understand the mission before learning the tools.
11. Malicious activity occurs on an endpoint whose Wazuh Agent disconnected the previous night. No alert is generated. This outcome is best described as:
A. A true positive
B. A false positive
C. A false negative
D. An incident
Chapter Discussion Questions
- Why is centralized security monitoring necessary in modern organizations?
- Why can’t a firewall alone adequately protect an organization?
- Explain the difference between an event, an alert, and an incident using your own words.
- Why is telemetry considered the foundation of a Security Operations Center?
- Describe how Wazuh, Suricata, and Sysmon complement one another.
- Why is validation of monitoring infrastructure critical before beginning an investigation?
- How does Defense in Depth improve an organization’s security posture?
- Why do professional analysts avoid making conclusions immediately after receiving an alert?
- How would a Tier 1 analyst investigate differently than a Tier 2 analyst?
- What skills, beyond technical knowledge, make an effective SOC analyst?
Lab 0 — Operational Health Validation (Overview)
Purpose
Before investigating cybersecurity events, analysts must verify that the monitoring infrastructure is operating correctly. In Lab 0 you will validate every major component of your Security Operations Center. This lab becomes the standard operational health check performed before every future exercise in this textbook.
The complete step-by-step procedures, expected outputs, field-level analysis, and troubleshooting guidance are provided in the standalone laboratory document, Lab 0 — Wazuh & Suricata: Initial Lab Testing and Validation. This section summarizes what you will accomplish and why.
Learning Objectives
After completing this laboratory, you should be able to:
- Verify the operational status of the Wazuh Manager, Indexer, and Dashboard.
- Confirm agent enrollment and connectivity from the server, the Dashboard, and the endpoints.
- Trace a known Linux authentication event end-to-end from generation to a rendered Dashboard alert.
- Validate Suricata packet capture on ens192 and confirm Emerging Threats signatures fire as expected.
- Validate Sysmon telemetry (Event IDs 1, 3, and 22) and Windows Defender detection from WIN11 into Wazuh.
- Correlate network-based and host-based telemetry describing the same activity.
- Troubleshoot missing telemetry using the source-to-SIEM methodology in Appendix D.
What You Will Validate
| Component | Validation | Deterministic Trigger |
|---|---|---|
| Wazuh Manager (WAZUH-SRV) | All services running; Dashboard accessible; both agents Active | wazuh-control status; agent_control -l |
| Linux telemetry path (UB2604) | Authentication failure travels end-to-end to the Dashboard | Deliberate failed su/sudo attempt |
| Network sensor (UB2604) | ens192 UP and PROMISC; packets visible; configuration valid; ET Open rules loaded | tcpdump; suricata -T; testmyids.com (SID 2100498) |
| Windows endpoint (WIN11) | Sysmon Event IDs 1, 3, and 22 reach Wazuh; Defender detects and quarantines malware | notepad; Resolve-DnsName; EICAR test file |
| Correlation | A single event reconstructed from two independent telemetry sources | Nmap scan of WIN11 observed by both Suricata and the endpoint |
Every activity follows the same engineering pattern used throughout this textbook:
Figure 1-16
Laboratory Method
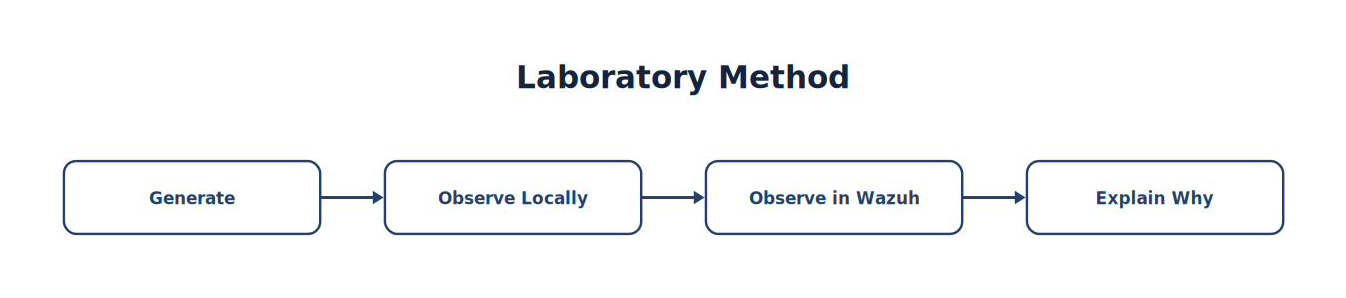
Note. The laboratory method repeats a disciplined cycle of building, generating activity, observing telemetry, investigating evidence, documenting results, and improving detections.
Troubleshooting Workflow
If an expected alert does not appear, investigate in pipeline order. Never skip steps or assume the failure point:
- Was the activity actually generated?
- Did the originating sensor observe it?
- Was telemetry written to the appropriate local log (auth.log, eve.json, Event Viewer)?
- Did the Wazuh Agent forward the telemetry?
- Did the Manager receive and process it?
- Did a rule generate an alert?
- Was the alert indexed, and does the Dashboard display it?
Record every validation result and baseline value—versions, rule counts, agent names, interface roles, and dates—in your SOC Engineering Notebook.
Chapter 1 Wrap-Up
Congratulations—you have completed the foundational chapter of this textbook.
You now understand:
- Why Security Operations Centers exist.
- How security telemetry flows through an organization.
- The difference between events, alerts, and incidents.
- The responsibilities of SOC analysts.
- How your laboratory is organized.
- Why validating telemetry is the first responsibility of every analyst.
In Chapter 2, you will build on this foundation by exploring the technology that ties the entire monitoring ecosystem together:
Security Information and Event Management (SIEM)
You will learn how SIEM platforms collect millions of events, normalize diverse log formats, correlate seemingly unrelated observations, and present analysts with the information needed to detect and investigate modern cyber threats.
Further Resources
- Wazuh — Getting Started (https://documentation.wazuh.com/current/getting-started/index.html) — Platform overview and architecture; read before Chapter 2.
- MITRE ATT&CK Enterprise Matrix (https://attack.mitre.org/matrices/enterprise/) — Browse the tactics and techniques referenced throughout this book.
- NIST Cybersecurity Framework 2.0 (https://www.nist.gov/cyberframework) — The governance context in which SOCs operate.
- Suricata Documentation (https://docs.suricata.io/) — Official user guide for the network sensor used in the lab.
- SANS Reading Room (https://www.sans.org/white-papers/) — Free practitioner white papers on security operations topics.